[Preprint]. 2024 May 13:2024.01.30.577899.
doi: 10.1101/2024.01.30.577899.

Detailing organelle division and segregation in Plasmodium falciparum

Affiliations

Detailing organelle division and segregation in Plasmodium falciparum

Julie M J Verhoef et al. bioRxiv. .

Update in

Abstract

The malaria causing parasite, Plasmodium falciparum, replicates through a tightly orchestrated process termed schizogony, where approximately 32 daughter parasites are formed in a single infected red blood cell and thousands of daughter cells in mosquito or liver stages. One-per-cell organelles, such as the mitochondrion and apicoplast, need to be properly divided and segregated to ensure a complete set of organelles per daughter parasites. Although this is highly essential, details about the processes and mechanisms involved remain unknown. We developed a new reporter parasite line that allows visualization of the mitochondrion in blood and mosquito stages. Using high-resolution 3D-imaging, we found that the mitochondrion orients in a cartwheel structure, prior to stepwise, non-geometric division during the last stage of schizogony. Analysis of focused ion beam scanning electron microscopy (FIB-SEM) data confirmed these mitochondrial division stages. Furthermore, these data allowed us to elucidate apicoplast division steps, highlighted its close association with the mitochondrion, and showed putative roles of the centriolar plaques (CPs) in apicoplast segregation. These observations form the foundation for a new detailed mechanistic model of mitochondrial and apicoplast division and segregation during P. falciparum schizogony and pave the way for future studies into the proteins and protein complexes involved in organelle division and segregation.


Figures

Figure 1.
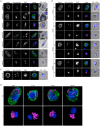
Figure 1.. Comparison of MitoTracker and a new mitochondrial marker for fluorescence imaging.
A) Fluorescent imaging of WT parasites stained with MitoTracker Orange CMTMRos (MT orange) or MitoTracker Red CMXRos (MT red). B) Fluorescence microscopy of MitoRed. The mito-mScarlet signal was observed in all asexual life-cycle stages including rings, trophozoites, early and late schizonts. No antibody staining was used and fluorescent signal observed is exclusively the mito-mScarlet signal. C) Fluorescence microscopy of MitoRed, either unstained (no MT) or stained with MT orange, MT red or MitoTracker Deep Red FM (MT deep red). Mito signal is the combined MitoTracker and mito-mScarlet signal that is observed in this channel. DAPI (blue) is used to visualize DNA and DIC (differential interference contrast) for general cellular context. All images are maximum intensity projections of Z-stacks (41 slices, 150 nm interval) taken with Airyscan confocal microscope. Scale bars, 2 μm.
Figure 2.
Figure 2.. Mitochondrial dynamics during gametocyte development and activation.
A) Immunofluorescence assay on MitoRed gametocytes stages IIa, IIb, III, IV, and V, stained with anti-β-tubulin (green) and DAPI (DNA, blue). The mito-mScarlet signal is shown in magenta. In stage IV and V, male (M) and female (F) gametocytes are distinguished based on the intensity of the tubulin signal (males high, females low). B) Immunofluorescence assay on MitoRed parasites during different stages of gametocyte activation (2, 5, 10 and 20 min after activation). C) Immunofluorescence assay on MitoRed exflagellating male gamete 20 min after activation. A-C) Images are maximum intensity projections of Z-stacks (41 slices, 150 nm interval) taken with an Airyscan confocal microscope. Scale bars, 2 μm. D) 3D visualization of male and female MitoRed parasites 2, 5, 10, and 20 min after activation. The mito-mScarlet fluorescent signal is segmented based on manual thresholding.
Figure 3.
Figure 3.. Mitochondrial dynamics during ookinete development.
A) Live imaging of MitoRed ookinetes one day after mosquito feed. Different stages of ookinete maturation (II – V) were distinguished based on description by Siciliano et al.. Cells were stained with an Alexa fluor 488 conjugated anti-Pfs25 antibody to visualize parasite outline (green). Images are maximum intensity projections of Z-stacks (30 slices, 185 nm interval) taken with an Airyscan confocal microscope. Scale bars, 2 μm. B) 3D visualization of different ookinete maturation stages. The mito-mScarlet fluorescent signal is segmented based on manual thresholding. Two smaller images in upper right corner of stage II-III and stage III are crops of the mitochondrial fluorescent signal with increased brightness and contrast. Scale bars, 1 μm.
Figure 4.
Figure 4.. Mitochondrial fission in asexual blood-stage parasites.
Immunofluorescence assay on MitoRed schizonts stained with anti-GAP45 antibody (green) to visualize IMC and DAPI (DNA, blue). The mito-mScarlet signal is shown in magenta. Four different stages of schizont maturity are distinguished: pre-segmentation (pre seg), schizonts still undergo nuclear division (nuclei are large and irregularly shaped) and there is no, or very little IMC staining without clear curvature. Early-segmentation (early seg), schizonts have (almost completely) finished nuclear division (nuclei are small and round), there is a clear IMC signal that has a curved shape at the apical end of the forming merozoites but is less than half-way formed. Mid-segmentation (mid seg), the IMC of the segmenting merozoites in these schizonts is more than half-way formed, but there is still a clear opening at the basal end of the merozoite. Late-segmentation (late seg), in these schizonts the IMC seems to be completely formed with no clear opening at the basal end of the forming merozoites. Images are single slices of a Z-stack taken with an Airyscan confocal microscope. Images of the mito-mScarlet signal in the seventh column are maximum intensity projections (MIPs) (41 slices, 150 nm interval). Images in the eighth column are crops of the GAP45 signal depicted in the first column, indicated by the dotted-line areas. Scale bars, 2 μm.
Figure 5.
Figure 5.. 3D analysis of mitochondrial fission stages during schizogony.
A) 3D visualization of mitochondrial segmentations based on thresholding of the mito-mScarlet signal in Arivis image analysis software. Smaller images in top row are a single slice of the Z-stack with anti-GAP45 labelling (IMC, green), DAPI (DNA, blue) and mito-mScarlet (magenta), and a maximum intensity projection of the mito-mScarlet signal. The larger bottom picture is a 3D visualization of the segmented mitochondrial signal. The color of the mitochondrial fragment represents the size of this fragment, as is shown in the color bar at the bottom. Two representative parasites are depicted for each of the four segmentation stages defined in Figure 4. Scale bars, 2 μm. B) Boxplot indicating the number of nuclei per parasite in the different segmentation stages. **, p<0.01; ***, p < 0.001. C) Boxplot indicating the number of mitochondrial fragments per parasite in the different segmentation stages. ***, p < 0.001. D) Boxplot indicating the size of the mitochondrial fragments in the different segmentation stages.
Figure 6.
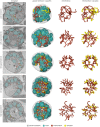
Figure 6.. 3D rendering of mitochondrion and apicoplast during different stages of schizogony.
First column contains representative micrograph images from different schizont stages. The numbers between brackets indicate the parasite ID number and detailed information can be found in table S2 and S3. The red blood cell (RBC) and food vacuole (FV) are indicated by their abbreviations. Rhoptries are indicated by white arrowheads, parasitophorous vacuole membrane is indicated by red arrowheads, and parasite membrane invaginations are indicated by black arrowheads. Scale bars, 1 μm. The second, third, and fourth column contain 3D renderings of parasite membrane (gray, 5% transparency), nuclei (teal, 50% transparency), mitochondrion (red), and apicoplast (yellow). Red arrows indicate merozoite entrance bulins.
Figure 7.
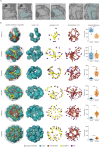
Figure 7.. Association of apicoplast and not the mitochondrion with centriolar plaques during schizont development.
A) Micrographs of nuclei (teal) with centriolar plaques (CPs, purple). B) 3D rendering of nuclei (teal), apicoplast (yellow), mitochondrion (red), CPs (purple), and parasite membrane (gray, 5% opacity). Parasite ID numbers are indicated on the left side of the micrograph images. Right column shows measured distances between CPs and closest point to the apicoplast or mitochondrion. ***, p < 0.001.
Figure 8.
Figure 8.. Schematic model for mitochondrial and apicoplast division and segregation in P. falciparum during schizogony.
(1) Nuclear division is ongoing, while inner membrane complex (IMC) formation has not started and both the mitochondrion and apicoplast are branched networks. The apicoplast localizes more to the center of the cell, while the mitochondrion is stretched throughout the whole cell. (2) When IMC formation starts, the apicoplast branches associate with the centriolar plaques (CPs) at the periphery of the parasite. (3) The apicoplast divides in a non 2n progression, while it keeps its interaction with the CPs. (4) When nuclear division is finishing, apicoplast division is completely finished. The apical end of the apicoplast fragments associate with the CPs, while mitochondrial branches associate with the basal end of the apicoplast fragments. (5) The IMC develops further and envelops large parts of the nuclei. The mitochondrion orients itself in a cartwheel structure, while its branches align with the apicoplast fragments. (6) IMC formation is almost finished, and just a small opening connects the merozoites to the residual body. The mitochondrion divides in a non 2n progression. The apicoplast still associates with the CPs and aligns with mitochondrial branches/fragments. (7) Merozoite segmentation is complete, the apicoplast loses its clear association with the CPs since they become smaller and do not have a clear extra nuclear compartment anymore. The mitochondrion is fully divided and still aligns with the apicoplast. Red blood cell (RBC), parasitophorous vacuole (PV).

References

    1. WHO. World malaria report 2023. (2023).
    1. Vaidya A. B. & Mather M. W. Mitochondrial evolution and functions in malaria parasites. Annu. Rev. Microbiol. 63, 249–267 (2009). - PubMed
    1. Painter H. J., Morrisey J. M., Mather M. W. & Vaidya A. B. Specific role of mitochondrial electron transport in blood-stage Plasmodium falciparum. Nature 446, 88–91 (2007). - PubMed
    1. Ke H. et al. Genetic investigation of tricarboxylic acid metabolism during the Plasmodium falciparum life cycle. Cell Rep. 11, 164–174 (2015). - PMC - PubMed
    1. Evers F. et al. Composition and stage dynamics of mitochondrial complexes in Plasmodium falciparum. Nat. Commun. 12, 3820 (2021). - PMC - PubMed

Publication types