[Preprint]. 2024 Jan 30:2024.01.29.577733.
doi: 10.1101/2024.01.29.577733.

Spike transmission failures in axons from mouse cortical pyramidal neurons in vivo

Affiliations

Spike transmission failures in axons from mouse cortical pyramidal neurons in vivo

Netanel Ofer et al. bioRxiv. .

Update in

Abstract

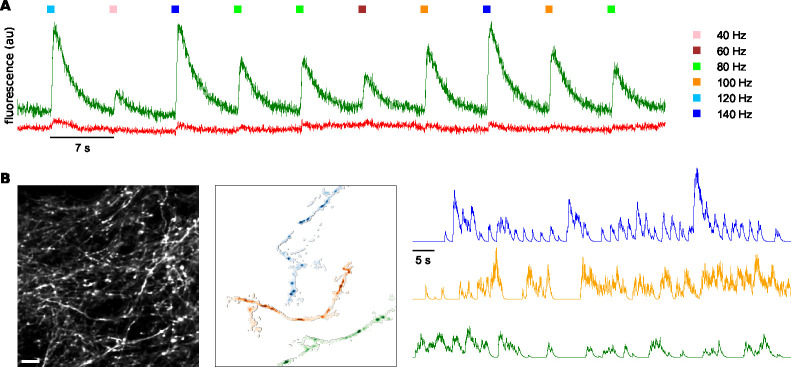
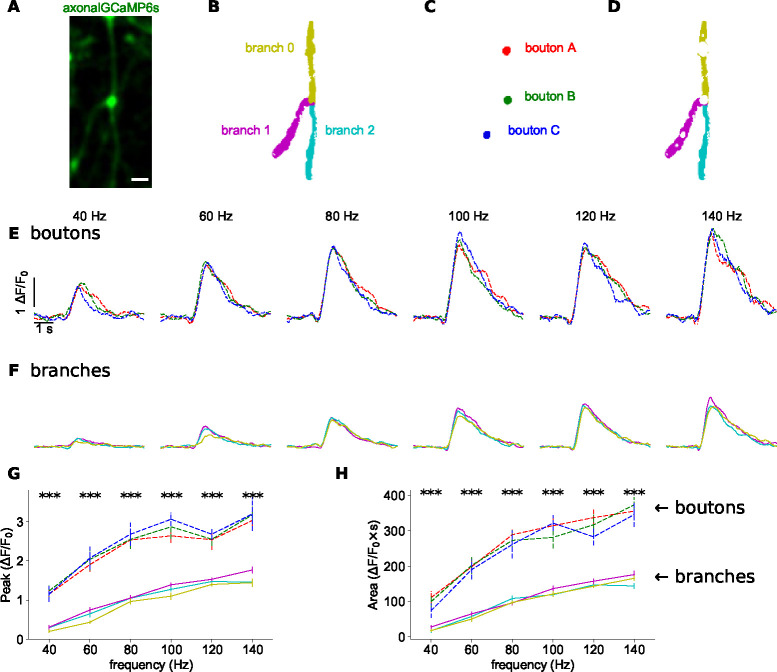
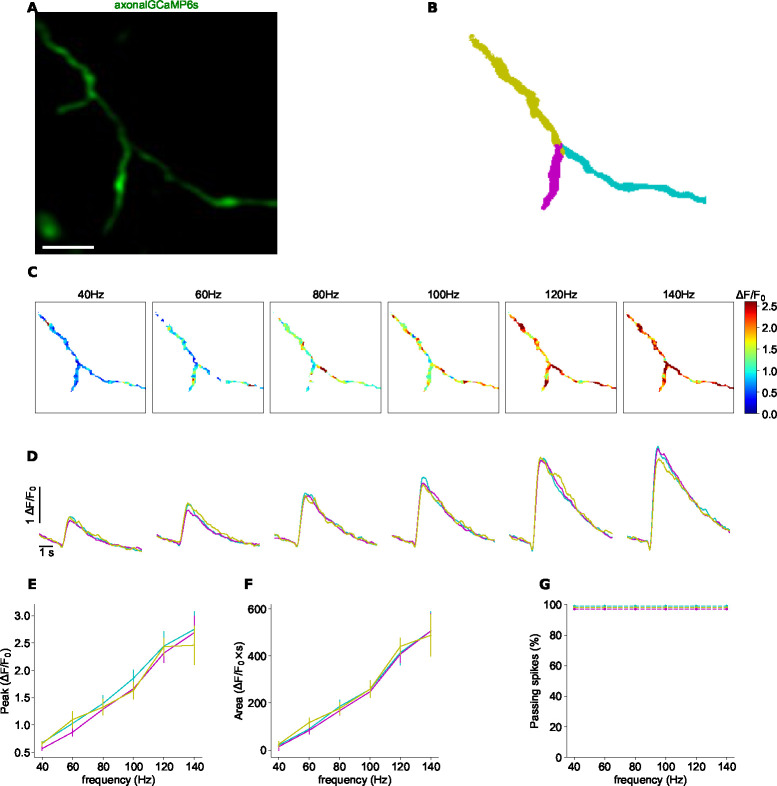
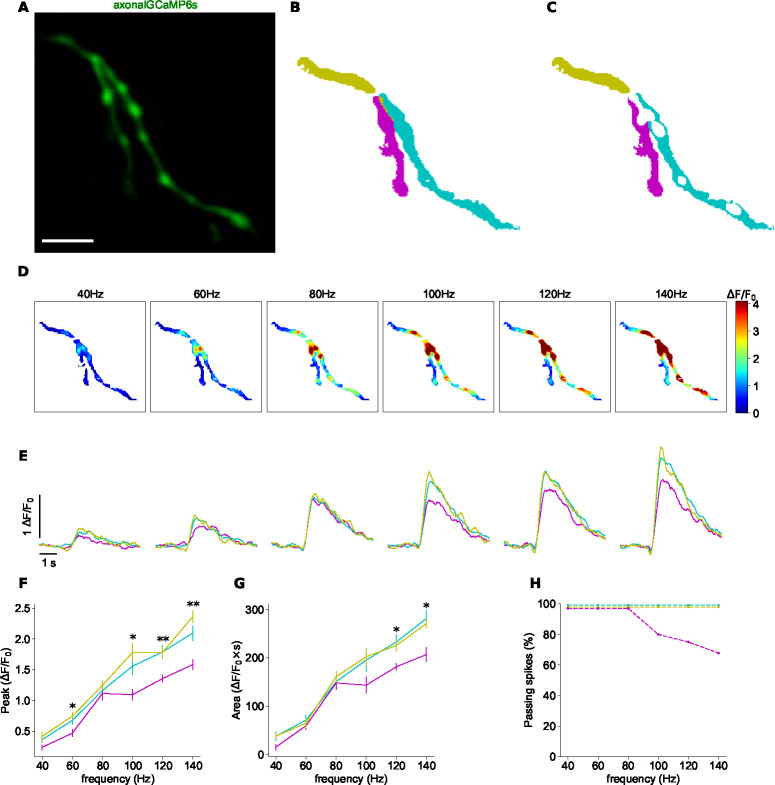
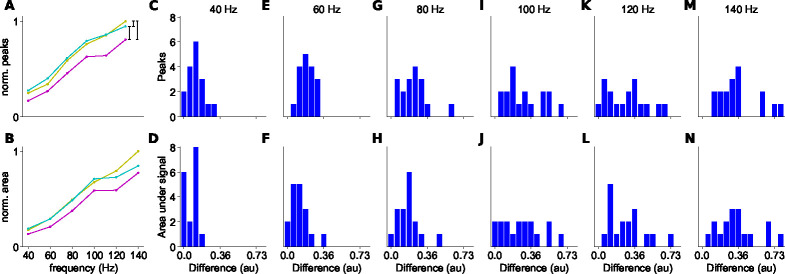
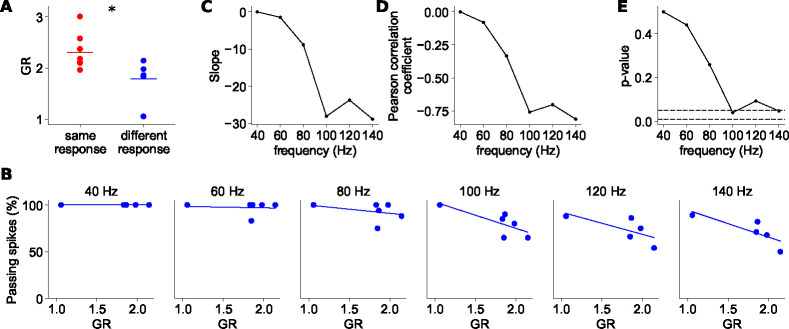
The propagation of action potentials along axons is traditionally considered to be reliable, as a consequence of the high safety factor of action potential propagation. However, numerical simulations have suggested that, at high frequencies, spikes could fail to invade distal axonal branches. Given the complex morphologies of axonal trees, with extensive branching and long-distance projections, spike propagation failures could be functionally important. To explore this experimentally in vivo, we used an axonal-targeted calcium indicator to image action potentials at axonal terminal branches in superficial layers from mouse somatosensory cortical pyramidal neurons. We activated axons with an extracellular electrode, varying stimulation frequencies, and computationally extracted axonal morphologies and associated calcium responses. We find that axonal boutons have higher calcium accumulations than their parent axons, as was reported in vitro. But, contrary to previous in vitro results, our data reveal spike failures in a significant subset of branches, as a function of branching geometry and spike frequency. The filtering is correlated with the geometric ratio of the branch diameters, as expected by cable theory. These findings suggest that axonal morphologies contribute to signal processing in the cortex.


Figures

Figure 1.
Figure 1.. Experimental design and spatiotemporal analysis of axonal branches.
A: Fluorescence responses of axons to electrical stimulation of neuropil at different stimulation frequencies; GCaMP6s in green, mRuby3 in red. B: Computational extraction of axonal branches, separating different axons and neuropil background based on activity. Scale bar: 10 μm.
Figure 2.
Figure 2.. Increased calcium responses at axonal boutons.
A: Time-averaged image of GCaMP6s activity during electrical stimulation. Scale bar: 2 μm. B: Color map of parent (0) and two secondary branches (1 and 2). C: Masks of three axonal boutons (a, b, and c). D: Masks of axonal branches after removing the boutons. E: Normalized GCaMP6s/mRuby3 signal for each bouton at different frequency. Average of 7 trials. Colors according to boutons in 2C. F: Normalized GCaMP6s/mRuby3 signal for each branch at different frequency. Average of 7 trials. Colors according to branches in 2D. G: Peak amplitudes of signals in 2E and 2F as a function of frequency. H: Area under curve of signals in 2E and 2F as a function of frequency. Vertical lines show standard error. Asterisks indicate statistical significance difference between signals; Kruskal-Wallis H-test.
Figure 3.
Figure 3.. Reliable propagation of action potentials at axonal branching point.
A: Time-averaged image of GCaMP6s activity during electrical stimulation. Scale bar: 5 μm. B: Color map of parent (0) and two secondary branches (1 and 2). C: Maps of normalized peak amplitudes at each frequency. D: Normalized GCaMP6s/mRuby3 signal for each branch at different frequency. Average of 5 trials. Colors according to branches in 1B. E: Peak amplitudes of signals in 3D as a function of frequency. F: Area under curve of signals in 3D as a function of frequency. Vertical lines show standard error. G: Percentage of signals that propagate at each branch, as a function of frequency.
Figure 4.
Figure 4.. Differential spike propagation in axonal branches.
A: Time-averaged image of GCaMP6s activity during electrical stimulation. Scale bar: 5 μm. B: Color map of parent and two secondary branches. C: Color map of parent and two secondary branches after removing the axonal boutons. D: Maps of normalized peak amplitudes at each frequency. E: Normalized GCaMP6s/mRuby3 signal for each branch at different frequency. Average of 7 trials. Colors according to branches in 4C. F: Peak amplitudes of signals in 4E as a function of frequency. G: Area under curve of signals in 4E as a function of frequency. Vertical lines show standard error. Asterisks indicate statistical significance differences between signals; Kruskal-Wallis H-test. H: Percentage of signals that propagate at each branch, as a function of frequency.
Figure 5.
Figure 5.. Differences in peak responses and areas between branches.
A: Example of the normalized peak fluorescence as a function of stimulus frequency at a branchpoint. Parent branch in yellow, secondary branch with higher signal in cyan, and secondary branch with lower signal in magenta. B: Normalized integrated fluorescence as a function of stimulus frequency. C-N: Differences between normalized signals (black vertical lines in A), for peak (upper row) and area under the signal (bottom row) different spike trains frequencies (n=17).
Figure 6.
Figure 6.. Spike filtering correlates with axonal branchpoint geometrical ratio (GR).
A: GR values of ‘similar’ and ‘different’ response branchpoints; t-test two-sided. B: Percentage of propagating spikes as a function of GR for each spike train frequency. Lines represent linear fit to the data. C: Slope of the regression line as a function of action potential frequency. D: Pearson correlation coefficient (R) between the percentage of passing spikes and GR, as a function of action potential frequency. E: p-value of the linear regression fitting as a function of the action potential frequency. Dashed lines indicate p-values of 0.05 and 0.01.

References

    1. Ali F, Kwan AC. Interpreting in vivo calcium signals from neuronal cell bodies, axons, and dendrites: a review. 2019. Neurophotonics; 7(01):1 doi: 10.1117/1.nph.7.1.011402. - DOI - PMC - PubMed
    1. Apostolides PF, Milstein AD, Grienberger C, Bittner KC, Magee JC. Axonal filtering allows reliable output during dendritic plateau-driven complex spiking in CA1 neurons. 2016. Neuron; 89(4):770–783 doi: 10.1016/j.neuron.2015.12.040. - DOI - PubMed
    1. Broussard GJ, Liang Y, Fridman M, Unger EK, Meng G, Xiao X, Ji N, Petreanu L, Tian L. In vivo measurement of afferent activity with axon-specific calcium imaging. 2018. Nature Neuroscience; 21(9):1272–1280 doi: 10.1038/s41593-018-0211-4. - DOI - PMC - PubMed
    1. Chen TW, Wardill TJ, Sun Y, Pulver SR, Renninger SL, Baohan A, Schreiter ER, Kerr RA, Orger MB, Jayaraman V, Looger LL, Svoboda K, Kim DS. Ultrasensitive fluorescent proteins for imaging neuronal activity. 2013. Nature; 499(7458):295–300 doi: 10.1038/nature12354. - DOI - PMC - PubMed
    1. Chéreau R, Saraceno GE, Angibaud J, Cattaert D, Nägerl UV. Superresolution imaging reveals activity-dependent plasticity of axon morphology linked to changes in action potential conduction velocity. 2017. Proceedings of the National Academy of Sciences of the United States of America; 114(6):1401–1406 doi: 10.1073/pnas.1607541114. - DOI - PMC - PubMed

Publication types