[Preprint]. 2024 May 15:2024.02.04.578811.
doi: 10.1101/2024.02.04.578811.

Psilocybin-enhanced fear extinction linked to bidirectional modulation of cortical ensembles

Affiliations

Psilocybin-enhanced fear extinction linked to bidirectional modulation of cortical ensembles

Sophie A Rogers et al. bioRxiv. .

Update in

Abstract

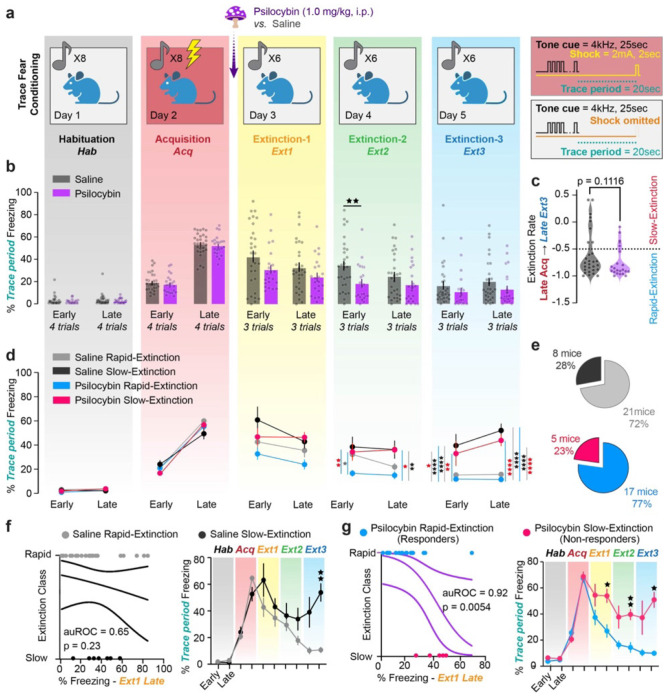
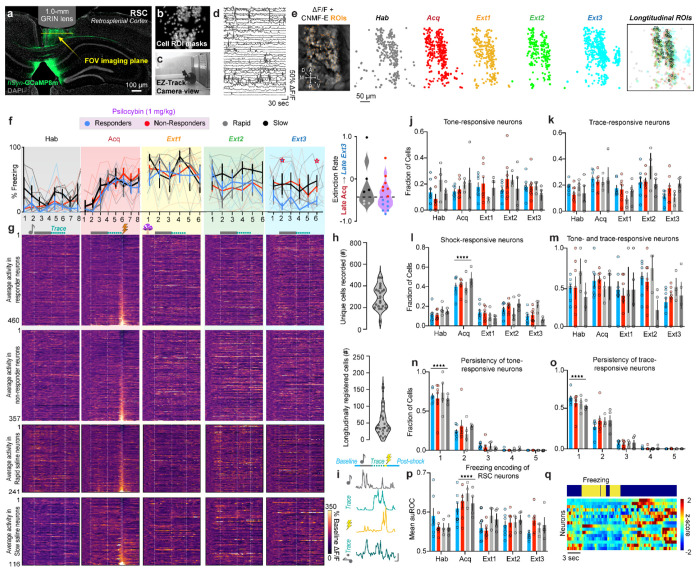
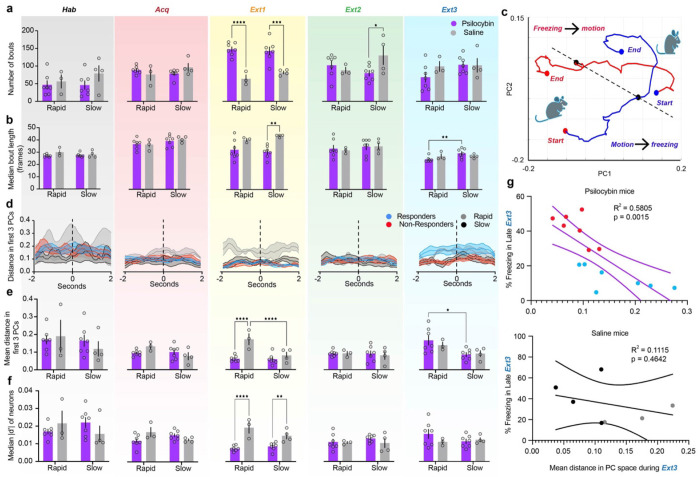
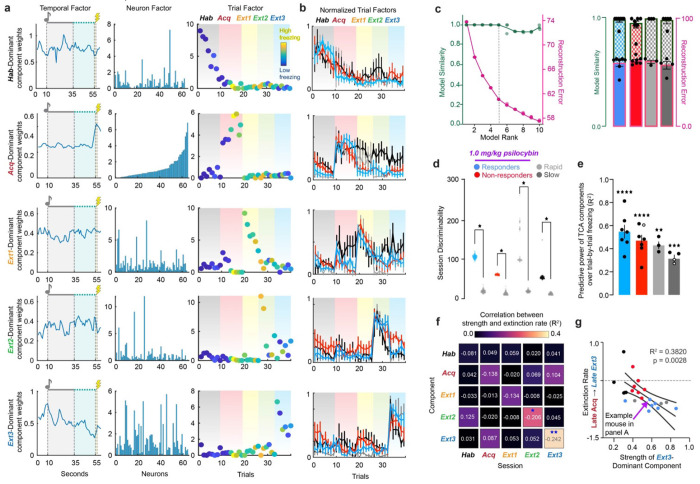
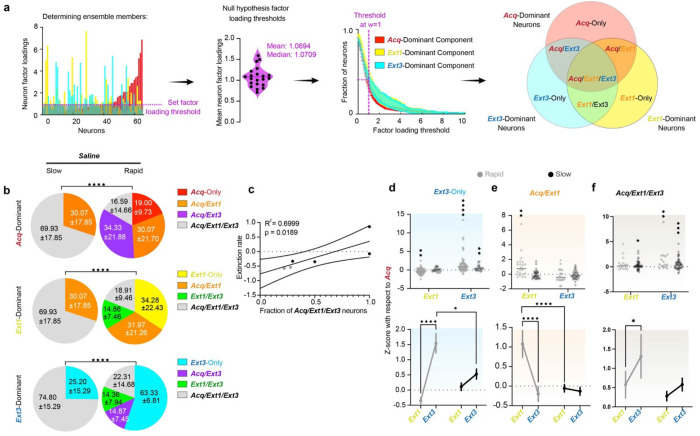
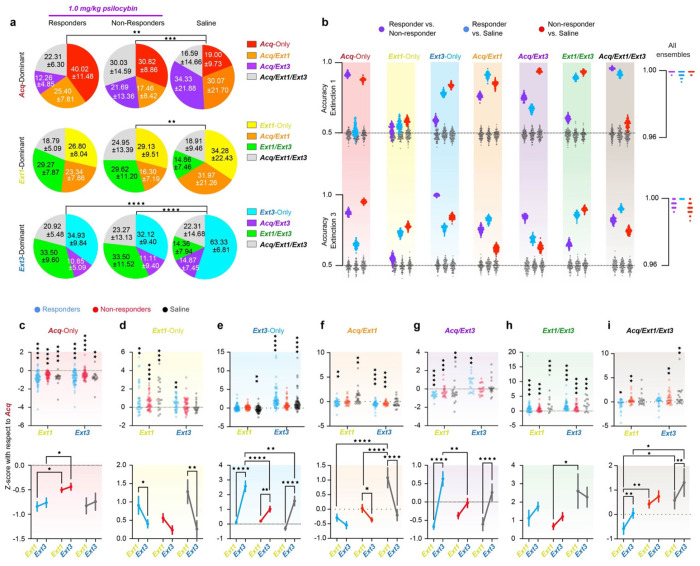
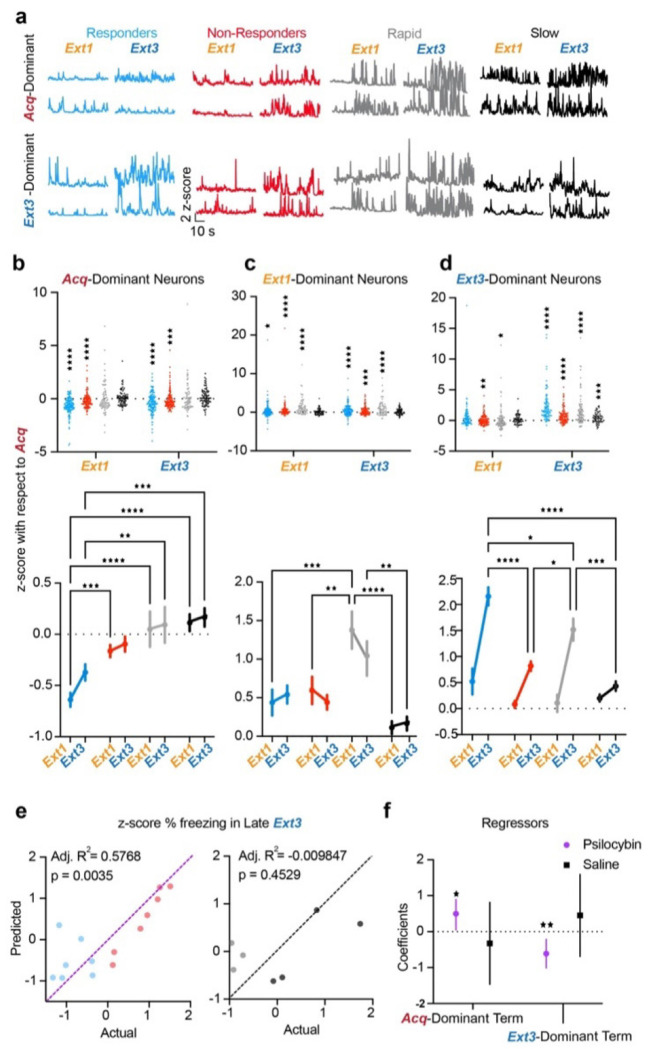
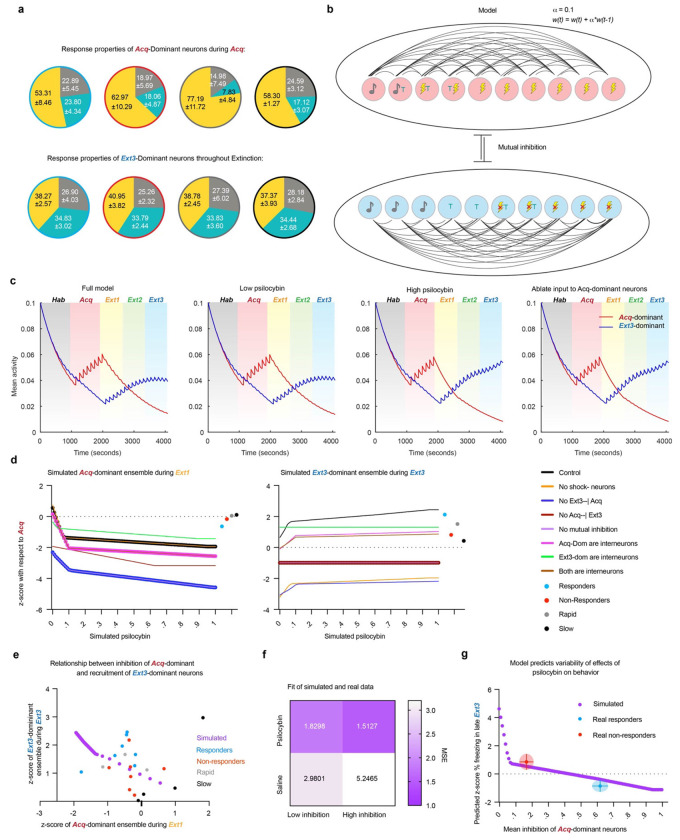
The serotonin 2 receptor (5HT2R) agonist psilocybin displays rapid and persistent therapeutic efficacy across neuropsychiatric disorders characterized by cognitive inflexibility. However, the impact of psilocybin on patterns of neural activity underlying sustained changes in behavioral flexibility has not been characterized. To test the hypothesis that psilocybin enhances behavioral flexibility by altering activity in cortical neural ensembles, we performed longitudinal single-cell calcium imaging in the retrosplenial cortex across a five-day trace fear learning and extinction assay. A single dose of psilocybin induced ensemble turnover between fear learning and extinction days while oppositely modulating activity in fear- and extinction- active neurons. The acute suppression of fear-active neurons and delayed recruitment of extinction-active neurons were predictive of psilocybin-enhanced fear extinction. A computational model revealed that acute inhibition of fear-active neurons by psilocybin is sufficient to explain its neural and behavioral effects days later. These results align with our hypothesis and introduce a new mechanism involving the suppression of fear-active populations in the retrosplenial cortex.


Conflict of interest statement

Declaration of competing interests. The authors declare no competing interests.

Figures

Figure 1 |
Figure 1 |. Psilocybin enhances TFC extinction in a responsive subpopulation of mice.
a. Diagram of five-day TFC experiment. Right-hand panels depict conditioned and unconditioned one parameters. b. Average % time freezing during trace period in the first and last 3 trials of each day (“Early,” “Late” respectively) in saline and psilocybin-administered mice (black and purple respectively, n=25 each). Dots are individual animals. Two-Way ANOVA with Sidak multiple comparisons correction (Supp. Table 1, rows 1-5) c. Extinction rate calculated as the difference between freezing during late Acquisition and late Extinction 3 divided by freezing during late Acquisition. Red line indicates −50% threshold distinguishing rapidly- from slowly-extinguishing mice. Unpaired t-test. (Supp. Table 1, rows 6) d. Same as B; treatment groups subdivided into rapid- and slow-extinguishing mice (light colors, rapid; dark colors, slow). Two-Way ANOVA with Sidak multiple comparisons correction. (Supp. Table 1, rows 7-11) e. Pie charts describing breakdown of rapid- and slow-extinguishing mice within treatment groups. f. Left: Logistic regression predicting extinction rate based on % time freezing during early Extinction 1 during acute drug treatment in saline-administered mice. Right: Direct comparison of % freezing over time between saline rapid- and slow-extinguishing mice. 2-Way ANOVA. (Supp. Table 1, rows 12-13) g. Same as F for psilocybin-administered mice. (Supp. Table 1, rows 14-15) Data are mean ± SEM. * p ≤ 0.05, ** p < 0.01, *** p < 0.001, **** p < 0.0001.
Figure 2 |
Figure 2 |. RSC neurons are modulated over TFC extinction in psilocybin- and saline-administered mice.
a. Representative image of AAV8-syn-GCaMP8m-WPRE expression (green) and nuclei (grey) in RSC under GRIN lens tract. b. Cell masks of imaged neurons during one session from same mouse. c. Image of behavioral set-up during an extinction session. Example frame of freezing mouse. d. Example traces of neurons recorded during behavior in dF/F in same mouse. e. Left: Representative image from Ca2+-imaging video in the same mouse. Right: Cell masks of each recorded neuron in each session, overlayed with masks of longitudinally registered cells. f. Left: Percent of time freezing during each trial in responders (n=7 mice), non-responders (n=7 mice), and saline mice (n=7 mice). Two-Way ANOVA. (Supp. Table 1, rows 16-20) Right: Extinction rate. Unpaired t-test. (Supp. Table 1, row 21). g. Average activity in each neuron over all trials from each session, normalized to baseline before one onset and aligned to shock. Top: Responders (n=460 neurons), Top middle: Non-responders (n=357 neurons), Bottom middle: rapid saline (n=241 neurons), Bottom: slow saline (n=116 neurons). h. Top: Number of unique cells accepted over all sessions in each animals. Bottom: Number of longitudinally registered neurons in each animal. i. Example traces of tone-, trace-, shock, and tone+trace-responsive neurons (top to bottom). Vertical scale bar = 2dF/F, horizontal scale bar = 5 sec. j. Fraction of tone-responsive cells in each group over each day. Two-Way RM ANOVA. (Supp. Table 1, row 22) k. Fraction of trace-responsive cells in each group over each day. Two-Way RM ANOVA. (Supp. Table 1, row 23) L. Fraction of shock/omission-responsive cells in each group over each day. Two-Way RM ANOVA. (Supp. Table 1, row 24) m. Fraction of one-responsive neurons that are also trace-responsive cells in each group over each day. Two-Way RM ANOVA. (Supp. Table 1, row 25) n. Fraction of one-responsive cells that are one-responsive for 1-5 days in each animal. Two-Way RM ANOVA. (Supp. Table 1, row 26) o. Fraction of trace-responsive cells that are trace-responsive for 1-5 days in each animal. Two-Way RM ANOVA. (Supp. Table 1, row 27) p. Average freezing encoding of neurons in each group over each day (auROC, Two-Way ANOVA). (Supp. Table 1, row 28) q. Representative traces of freezing-encoding neurons in 1 animal sorted from greatest to least (bottom to top) auROC. Data are represented as mean ± SEM. * p ≤ 0.05, ** p < 0.01, *** p < 0.001, **** p < 0.0001.
Figure 3 |
Figure 3 |. Psilocybin alters dynamics and encoding of freezing behavior.
a. Total number of freezing bouts per session. (Left to right, Black = Habituation, Red = Acquisition, Yellow = Extinction 1, Green = Extinction 2, Blue = Extinction 3). Two-way ANOVA. (Supp. Table 1, rows 29-33). b. Median bout length per session in frames. Two-way ANOVA. (Supp. Table 1, rows 34-38). c. Representative average trajectories of motion-to-freezing (blue line, bout start) and freezing-to-motion (red line, bout end) transitions in the first two PCs, from two seconds before to two seconds after transition. (Black point = time of transition, red points = starting and ending points in motion, blue points = starting and ending points in freezing) A dashed line is drawn between the two transition points. d. Average Euclidean distance in PC space between each pair of points in motion-to-freezing and freezing-to-motion trajectories in the first three PCs on each day. Dashed line indicates time of behavioral transition. Shaded areas are SEM. e. Mean distance in PC space between bout start and bout end over the four-second time window between trajectories. Two-way ANOVA. (Supp. Table 1, rows 39-43). f. Median absolute value of d-prime between motion and freezing in all recorded neurons on each day. Two-way ANOVA. (Supp. Table 1, rows 44-48). g. Linear regression of distance in PC space between trajectories (Fig. E, right) and % trace period freezing in late Extinction 3 in psilocybin (top) and saline mice (bottom). (Supp. Table 1, rows 49-50). Data are mean ± SEM. * p ≤ 0.05, ** p < 0.01, *** p < 0.001, **** p < 0.0001.
Figure 4 |
Figure 4 |. Tensor Component Analysis (TCA) captures evolution of RSC through different task-relevant states over learning.
a. Representative rank-5 TCA model of neural activity over RSC in one mouse. Rows correspond to unique components of neural activity and columns correspond to temporal, neuron, and trial factors. Values in each panel correspond to the factor loadings, or weights, of each component at each time, cell, and trial in the given component. Pink dashed line over temporal factors indicates time of conditioned one delivery, and lightning bolt indicates time of shock-delivery. Gradients over the trial factor indicate session of trials (Black = Habituation, Red = Acquisition, Yellow = Extinction 1, Green = Extinction 2, Blue = Extinction 3). Trial weights are color coded according to the animals % time freezing in each trial (dark blue = 0%, bright yellow = 100%). b. Normalized trial factor weights for each component, averaged within groups. Two-Way RM ANOVA. (Supp. Table 1, rows 51-55). c. Validation of choice of rank-5 model. Left: Four TCA models at each of ranks 1-10 were generated on neurons pooled from all psilocybin administered animals and their reconstruction error (pink) and model similarity (blue) plotted against each other. Rank-5 was chosen by minimizing reconstruction error while maximizing model similarity (black dashed line). (Supp. Table 1, row 56) Right: Reconstruction error (solid colors) and similarity (checkered colors) in individual animals. (Supp. Table 1, row 57) Ordinary One-Way ANOVA with Tukey multiple comparisons correction. d. Trial weights of dominant factor during a given session divided by those of each other factor, summed over sessions, calculated over 100 iterations of TCA on real data from each group and TCA models generated on 100 shuffles of the data. Data was shuffled over cells at each individual timepoint to preserve all temporal and trial dynamics of activity that could lead to session discriminability. Multiple unpaired t-tests. P<0.0001 for all comparisons. (Supp. Table 1, row 58) e. Linear regression trial factor value of each of 5 components and trial-by-trial freezing across all 5 days (R2). Significant values are filled and non-significant values are hollow. One-sample t-test. (Supp. Table 1, rows 59-60) f. Linear regression of relative strength of each component during each session and extinction rate in all mice (R2). Numbers are linear coefficients. Stars indicate where slope is significantly non-zero. (Supp. Table 1, row 61-65) g. Data in D for the Extinction 3-dominant component during Extinction 3. (Supp. Table 1, rows 66) * p ≤ 0.05, ** p < 0.01, *** p < 0.001, **** p < 0.0001
Figure 5 |
Figure 5 |. Turnover in the dominant neural ensembles driving RSC dynamics predicts fear extinction.
a. Choosing Acq-, Ext1-, and Ext3-dominant neurons (red, yellow, and blue, respectively). Left: The fraction of neurons included in the ensemble at various thresholds across animals (mean, SEM) and the neuron factor weights of each neuron in each component in a representative animal. Neurons crossing the chosen threshold of w=1 are indicated by enhanced opacity. Middle: Schematic of the overlaps between these neurons, yielding Acq-Only, Acq/Ext1, Ext1-Only, Ext1/Ext3, Ext3-Only, Acq/Ext3, and Acq/Ext1/Ext3. Ensembles are denoted by the corresponding ROYGBIV color code throughout the figure. Right: Example traces. b. Pie charts describing the average overlap of the Acq-, Ext1, and Ext3-dominant ensembles (top, middle, bottom) in rapidly and slowly extinguishing saline-administered mice. Numbers are mean ± SEM. Stars indicate comparisons between each psilocybin group and saline. Chi-square test. (Supp. Table 1, rows 67-69). c. Linear regression of the fraction of Acq/Ext1/Ext3 neurons and extinction rate in saline mice. (Supp. Table 1, row 70). d. Top: z-score activity in individual Ext3-only neurons in each ensemble from Acquisition. Wilcoxon rank-sum to test if change is different from zero. Bottom: Same data displayed as mean ± SEM. Two-way RM ANOVA to compare changes over time and between groups. (Supp. Table 1, rows 71-72). e,f. Same as D for Acq/Ext1 and Acq/Ext1/Ext3. (Supp Table 1, rows 73-76). * p ≤ 0.05, ** p < 0.01, *** p < 0.001, **** p < 0.0001.
Figure 6 |
Figure 6 |. Psilocybin bidirectionally modulates neural ensembles driving RSC dynamics during TFC in responders.
a. Pie charts describing the average overlap of the Acq-, Ext1, and Ext3-dominant ensembles (top, middle, bottom) in responders, non-responders and rapidly extinguishing saline-administered mice. Numbers are mean ± SEM. Stars indicate comparisons between each psilocybin group and saline. Chi-square test. (Supp. Table 1, rows 77-79) b. Accuracies of 100 Fisher decoders trained to predict responder status (left cloud, purple), responders from rapidly extinguishing saline-administered mice (middle cloud, blue around grey), and non-responders from saline administered mice (right cloud, red around grey). Grey clouds are the same decoders tested on shuffled class labels. Decoders were trained on activity during Extinction 1 (top) and Extinction 3 (bottom). Right-hand panels accuracies of decoders trained on all seven ensembles as predictors. c. Top: z-score activity in individual Acq-Only neurons in each ensemble from Acquisition. Wilcoxon rank-sum to test if change is different from zero. Bottom: Same data displayed as mean ± SEM. Two-way RM ANOVA to compare changes over time and between groups. (Supp. Table 1, rows 80-81) d-i. Same as C for Ext1-Only, Ext3-Only, Acq/Ext1, Ext1/Ext3, Acq/Ext3, and Acq/Ext1/Ext3, respectively. (Supp. Table 1, rows 82-93) * p ≤ 0.05, ** p < 0.01, *** p < 0.001, **** p < 0.0001
Figure 7 |
Figure 7 |. Psilocybin induces long-term suppression of Acq-dominant neurons and strong post-acute recruitment of Ext3-dominant neurons in responders.
a. Example traces of Acq-dominant (top) and Ext3-dominant (bottom) neurons during Extinction 1, and Extinction 3 in each group. b. Top: z-score with respect to Acquisition of individual Acq-dominant neurons in each ensemble during Extinction 1 and 3. Wilcoxon rank-sum to test if median ≠ 0. Bottom: Same data displayed as mean ± SEM. Two-way RM ANOVA to compare changes over time and between groups. Data are represented as mean ± SEM. (Supp. Table 1, rows 94-95) c. Same as B) for Ext1-dominant neurons. (Supp. Table 1, rows 96-97). d. Same as B) for Ext3-dominant neurons. (Supp. Table 1, rows 98-99) e. Multiple regression of z-score % freezing in late Extinction 3 on z-score from Acquisition of activity of Acq-dominant neurons in Extinction 1 and Ext3-dominant neurons in Extinction 3 in psilocybin (left) and saline mice (right). (Supp. Table 1, rows 100-1) f. Mean ± 95% confidence intervals of regression coefficients. (Supp. Table 1, row 102) * p ≤ 0.05, ** p < 0.01, *** p < 0.001, **** p < 0.0001
Figure 8 |
Figure 8 |. A computational model of a two-ensemble RSC microcircuit explains psilocybin’s effects.
a. Fractions of tone, trace, and shock responsive neurons in the Acq-dominant ensemble during Acquisition (top) and Ext3-dominant neurons over all extinction sessions. b. Diagram of computational model of Acq- and Ext3-dominant ensembles and learning function. c. Average activity of ensembles over each simulation of the full model with no simulated psilocybin (first panel), low psilocybin simulated as direct synaptic inhibition to Acq-dominant units (second panel) during Extinction 1, high psilocybin during Extinction 1 (third panel), and with all synaptic input to the Acq-dominant units ablated during during Extinction 1 (last panel). d. Z-score with respect to Acquisition of Acq-dominant neurons during Extinction 1 (left) and of Ext3-dominant neurons during Extinction 3 (right) over multiple conditions: the full model (black), without shock-omission sensitive neurons (yellow), without inhibition of Acq-dominant units by Ext3-dominant units (deep blue), without inhibition of Ext3-dominant units by Acq-dominant units (deep red), without mutual inhibition (purple), if Acq-dominant units were inhibitory interneurons (pink), if Ext3-dominant units were inhibitory interneurons (green), if all units were inhibitory interneurons (brown). Mean values of real data are plotted to the right of each plot. e. Real and simulated z-score with respect to Acquisition of Ext3-dominant neurons during Extinction 3 plotted as a function of Acq-dominant neurons during Extinction 1. Simulated data (purple), responders (blue), non-responders (red), rapid mice (gray), and slow mice (black). f. Mean squared error (MSE) of the real data (rows) from the simulated data (columns) in E. g. Simulated z-score freezing late Ext3 in model as a function of amount of synaptic inhibition (purple). Average freezing and average inhibition of Acq-dominant neurons in responders (blue) and non-responders (red). Error bars and clouds are SD.

References

    1. Hoppen Thole H, Priebe Stefan, Vetter Inja, and Morina Nexhmedin. “Global Burden of Post-Traumatic Stress Disorder and Major Depression in Countries Affected by War between 1989 and 2019: A Systematic Review and Meta-Analysis.” BMJ Global Health 6, no. 7 (July 2021): e006303. 10.1136/bmjgh-2021-006303. - DOI - PMC - PubMed
    1. Nutt David, and Carhart-Harris Robin. “The Current Status of Psychedelics in Psychiatry.” JAMA Psychiatry 78, no. 2 (February 1, 2021): 121–22. 10.1001/jamapsychiatry.2020.2171. - DOI - PubMed
    1. Griffiths R. R., Johnson M.W., Richards W. A., Richards B.D., McCann U., and Jesse R.. “Psilocybin Occasioned Mystical-Type Experiences: Immediate and Persisting Dose-Related Effects.” Psychopharmacology 218, no. 4 (December 2011): 649–65. 10.1007/s00213-011-2358-5. - DOI - PMC - PubMed
    1. Agin-Liebes Gabrielle I, Malone Tara, Yalch Matthew M, Mennenga Sarah E, Ponté K Linnae, Guss Jeffrey, Bossis Anthony P, Grigsby Jim, Fischer Stacy, and Ross Stephen. “Long-Term Follow-up of Psilocybin-Assisted Psychotherapy for Psychiatric and Existential Distress in Patients with Life-Threatening Cancer.” Journal of Psychopharmacology 34, no. 2 (February 1, 2020): 155–66. 10.1177/0269881119897615. - DOI - PubMed
    1. Aday Jacob S., Mitzkovitz Cayla M., Bloesch Emily K., Davoli Christopher C., and Davis Alan K.. “Long-Term Effects of Psychedelic Drugs: A Systematic Review.” Neuroscience & Biobehavioral Reviews 113 (June 1, 2020): 179–89. 10.1016/j.neubiorev.2020.03.017. - DOI - PubMed

Publication types