[Preprint]. 2024 Jan 31:2024.01.31.578251.
doi: 10.1101/2024.01.31.578251.

Metapopulation model of phage therapy of an acute Pseudomonas aeruginosa lung infection

Affiliations

Metapopulation model of phage therapy of an acute Pseudomonas aeruginosa lung infection

Rogelio A Rodriguez-Gonzalez et al. bioRxiv. .

Update in

Abstract

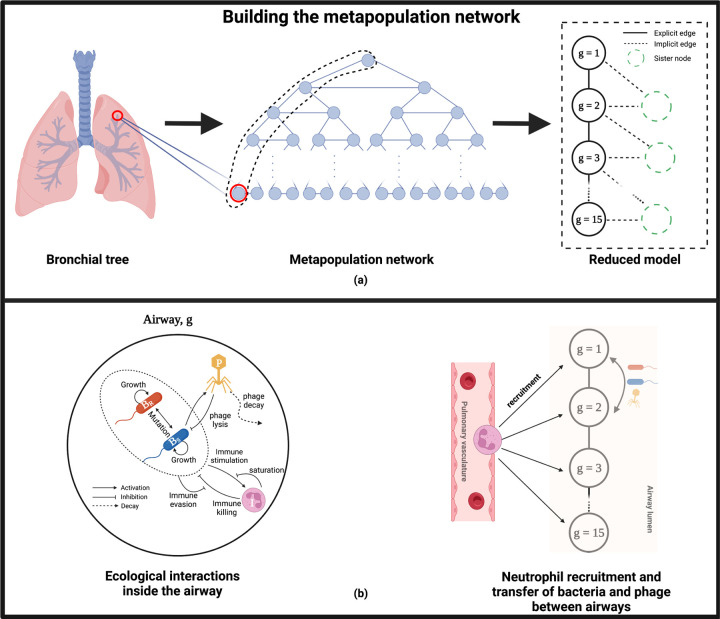
Infections caused by multi-drug resistant (MDR) pathogenic bacteria are a global health threat. Phage therapy, which uses phage to kill bacterial pathogens, is increasingly used to treat patients infected by MDR bacteria. However, the therapeutic outcome of phage therapy may be limited by the emergence of phage resistance during treatment and/or by physical constraints that impede phage-bacteria interactions in vivo. In this work, we evaluate the role of lung spatial structure on the efficacy of phage therapy for Pseudomonas aeruginosa infection. To do so, we developed a spatially structured metapopulation network model based on the geometry of the bronchial tree, and included the emergence of phage-resistant bacterial mutants and host innate immune responses. We model the ecological interactions between bacteria, phage, and the host innate immune system at the airway (node) level. The model predicts the synergistic elimination of a P. aeruginosa infection due to the combined effects of phage and neutrophils given sufficiently active immune states and suitable phage life history traits. Moreover, the metapopulation model simulations predict that local MDR pathogens are cleared faster at distal nodes of the bronchial tree. Notably, image analysis of lung tissue time series from wild-type and lymphocyte-depleted mice (n=13) revealed a concordant, statistically significant pattern: infection intensity cleared in the bottom before the top of the lungs. Overall, the combined use of simulations and image analysis of in vivo experiments further supports the use of phage therapy for treating acute lung infections caused by P. aeruginosa while highlighting potential limits to therapy given a spatially structured environment, such as impaired innate immune responses and low phage efficacy.


Figures

FIG. 1:
FIG. 1:. Schematic of the metapopulation network model of phage therapy of a P. aeruginosa infection.
The structure of the metapopulation network is based on the geometry of a symmetrical bronchial tree with a dichotomous branching pattern (a). The airways of the bronchial tree (a-left) are represented by the network nodes (a-middle), while the network links represent the branching points of the bronchial tree. For example, the section that connects the trachea to the left and right main bronchi is considered a branching point. We assume that the bronchial tree is symmetrical such that the left and right parts of the tree are identical, and so are their dynamics in a deterministic system. Therefore, we only focus on one side of the tree (the dashed line on the middle network) and reduce the number of nodes in our original network to one node per generation. The final network topology of this reduced model consists of 15 connected nodes forming a chain (a-right). The degree of the network nodes is 4, except for the first and last nodes, which have a degree of 2. In panel (b), we show the ecological interactions between phage-susceptible bacteria (BS), phage-resistant bacteria (BR), phage (P), and the host innate immune response (I) at the node level (b-left). Phage infect the susceptible strain, while the resistant strain is targeted only by the innate immune response. The immune response grows in the presence of bacteria and targets both bacterial strains. Neutrophils are recruited to the site of the infection from the pulmonary vasculature, while phage and bacteria transfer between connected nodes to spread across the network (a-right).
FIG. 2:
FIG. 2:. Spatiotemporal dynamics of phage therapy of a P. aeruginosa lung infection.
We show the population dynamics at the node level of phage (solid yellow line), phage-susceptible bacteria (solid blue line), phage-resistant bacteria (solid orange line), and the host innate immune response (purple solid line). We infect an immunocompetent host with 106 P. aeruginosa cells. Phage therapy (107 PFU) is administered 2 hr after the bacterial inoculation. We uniformly distribute the phage dose and the bacterial inoculum in the network such that each node had the same initial bacterial density (1.11 × 10⁶ CFU/ml) and phage density (1.11 × 10⁷ PFU/ml). When the host is immunocompetent, we set the initial immune density to I0 = 4.05 × 10⁵ cells/ml in all the network nodes. The simulation runs for 33 hr. Here, Node 1 = Generation 1 = trachea, and Node 15 = Generation 15 = terminal airway.
FIG. 3:
FIG. 3:. Bacterial dynamics under different phage and innate immune treatments.
We simulate four treatment scenarios that result from the presence or absence (−) of both phage and the innate immune response. We show the bacterial dynamics across the metapopulation network when the host is immunodeficient untreated (a) or phage-treated (c). Similarly, we show the bacterial dynamics when the host is immunocompetent untreated (b) or phage-treated (d). The heatmaps depict the progression of the bacterial infection across the network; each row represents a network node, g, while the columns indicate the simulation time (hr). The node color represents the bacterial density at a given time. The yellow regions represent high bacterial density, and the white areas represent infection clearance. When the host is immunocompetent and phage-treated, we zoom in and show the infection clearance pattern (e). We also test the effects of varying the mucin level (1–4%) on the infection clearance time (f). In all simulations, we inoculate a host with 106 bacterial cells. If phage therapy is used, we administer 107 phage (PFU) 2 hr after the beginning of the infection. We uniformly distribute the phage dose and the bacterial inoculum such that each node has the same initial bacterial density (1.11 × 10⁶ CFU/ml) and phage density (1.11 × 10⁷ PFU/ml). When the host is immunocompetent, we set an initial immune density of 4.05 × 10⁵ cells/ml in all the nodes. If the host is immunodeficient, we set the immune density to I0 = 0 cells/ml. A 2.5% mucin concentration was used for scenarios (a) to (e). All the simulations ran for 50 hr. On the heatmaps, row 1 represents Generation 1 and the top of the lungs, while row 15 represents Generation 15 and the bottom of the lungs.
FIG. 4:
FIG. 4:. Infection dynamics as a result of varying the distribution of phage dose and bacterial inoculum in the network.
We evaluate different forms of allocating the bacterial inoculum (B0) and the phage dose (P0) among network nodes (a). For example, 1) we uniformly distribute the phage dose or the bacterial inoculum among the network nodes, 2) we distribute the phage dose or the bacterial inoculum between the first three nodes of the network (Top distribution), 3) we distribute the phage dose or the bacterial inoculum among the last 12 nodes of the network (Bottom distribution), or 4) we inoculate the first node of the network with phage or bacteria. We use a heatmap to represent paired distributions of phage dose and bacterial inoculum. We show how bacterial infection progresses per network node (g). In the heatmap, each row represents a network node, while the columns indicate the simulation time. The node color represents the bacterial density, the yellow regions represent high bacterial density, and the white areas represent infection elimination. Given a pair of bacterial inoculum and phage dose distributions, we calculate the infection clearance time at the node level (b). For (a) and (b), we infect an immunocompetent host with 106 bacterial cells. We administer 107 phage (PFU) 2 hr after the bacterial infection. We set an initial immune density of I0 = 4.05 × 10⁵ cells/ml in all the nodes. The simulation ran for 50 hr. On the heatmaps, row 1 represents Generation 1 and the top of the lungs, while row 15 represents Generation 15 and the bottom of the lungs.
FIG. 5:
FIG. 5:. Probability of therapeutic success given intermediate phage efficacy and host innate immune levels.
To explore intermediate innate immune responses, we vary the percentage of neutrophils available in the lungs from 1 to 100%. We also test intermediate phage efficacy by varying the phage adsorption rate within the range 10−9 to 10−6 (ml/PFU)σh−1. We test the robustness of the model by randomizing the initial conditions and trying 84 different ways of distributing phage dose and bacterial inoculum across the network. Then, we calculate the probability of clearing the infection by simulating the 84 initial conditions under specific phage adsorption rates and immune response levels. The heatmap shows the probability of clearing the infection for the specified phage adsorption rates and immune response levels. The colored regions represent a p > 0 of clearing the infection, while black regions represent failure to clear the infection, i.e., a p = 0 of therapeutic success. The White solid line contours the region of infection clearance predicted by the well-mixed model. To simulate the phage treatment of a P. aeruginosa infection, we inoculate a host with 106 bacterial cells and introduce 107 phage 2 hr after the bacterial infection. The simulation runs for 250 hr. A 100% neutrophil availability represents a total of 3.24 × 10⁶ lung neutrophils. In this simulation, we use a 2.5% mucin level.
FIG. 6:
FIG. 6:. In vivo P. aeruginosa murine pneumonia data.
We show mice images depicting the evolution of a P. aeruginosa infection in vivo during 72 hr. We show data for two mice groups, WT (N = 4; mouse #1 to 4) and Rag2−/−Il2rg−/− (N = 9; mouse #5 to 13). The intensity of the bioluminescence signal represents the intensity of the infection in different mouse regions. The pixel intensity value is our proxy for the bacterial density. A pixel intensity of 1 represents the highest bacterial density, while 0 represents the threshold of detection. The white dashed line separates the upper and lower compartments of the mouse respiratory system. The orange and green boxes highlight the approximate time when the total intensity signal drops below the intensity threshold in the lower and upper compartments, respectively. Mice were inoculated with 107 P. aeruginosa cells, and 2 hr after the bacterial inoculation, mice were treated with phage (108 PFU).
FIG. 7:
FIG. 7:. Time series of total intensity signal and the infection clearance analysis using in vivo P. aeruginosa murine pneumonia data.
We show the time series of total intensity signals for the upper and lower compartments of 13 mice (a). The total intensity of one compartment is calculated by adding the pixel intensity values from all pixels making up a compartment. The black dashed line represents the intensity threshold below which the total intensity signal clears. We calculate the time to infection resolution for the upper and lower compartments (b). We use data from 13 mice, including WT (N = 4) and Rag2−/−Il2rg−/− (N = 9) mice groups. We used the one-sided Wilcoxon signed rank test to compare the infection clearance time difference between the upper and lower compartments (b).

Similar articles

References

    1. Murray C. J., Ikuta K. S., Sharara F., Swetschinski L., Aguilar G. R., Gray A., Han C., Bisignano C., Rao P., Wool E., et al., “Global burden of bacterial antimicrobial resistance in 2019: a systematic analysis,” The Lancet, vol. 399, no. 10325, pp. 629–655, 2022. - PMC - PubMed
    1. World Health Organization et al., “2021 antibacterial agents in clinical and preclinical development: an overview and analysis,” World Health Organization, 2022.
    1. Pallavali R. R., Degati V. L., Lomada D., Reddy M. C., and Durbaka V. R. P., “Isolation and in vitro evaluation of bacteriophages against mdr-bacterial isolates from septic wound infections,” PloS one, vol. 12, no. 7, p. e0179245, 2017. - PMC - PubMed
    1. Chibani-Chennoufi S., Sidoti J., Bruttin A., Kutter E., Sarker S., and Brussow H., “In vitro and in vivo bacteriolytic activities of escherichia coli phages: implications for phage therapy,” Antimicrobial agents and chemotherapy, vol. 48, no. 7, pp. 2558–2569, 2004. - PMC - PubMed
    1. El-Atrees D. M., El-Kased R. F., Abbas A. M., and Yassien M. A., “Characterization and anti-biofilm activity of bacteriophages against urinary tract enterococcus faecalis isolates,” Scientific Reports, vol. 12, no. 1, p. 13048, 2022. - PMC - PubMed

Publication types