

This is a preprint.
Selection of artemisinin partial resistance Kelch13 mutations in Uganda in 2016-22 was at a rate comparable to that seen previously in South-East Asia
- PMID: 38352505
- PMCID: PMC10862983
- DOI: 10.1101/2024.02.03.24302209
Selection of artemisinin partial resistance Kelch13 mutations in Uganda in 2016-22 was at a rate comparable to that seen previously in South-East Asia
Update in
-
Selection of Plasmodium falciparum kelch13 mutations in Uganda in comparison with southeast Asia: a modelling study.Lancet Microbe. 2025 May;6(5):101027. doi: 10.1016/j.lanmic.2024.101027. Epub 2025 Mar 17. Lancet Microbe. 2025. PMID: 40112841 Free PMC article.
Abstract
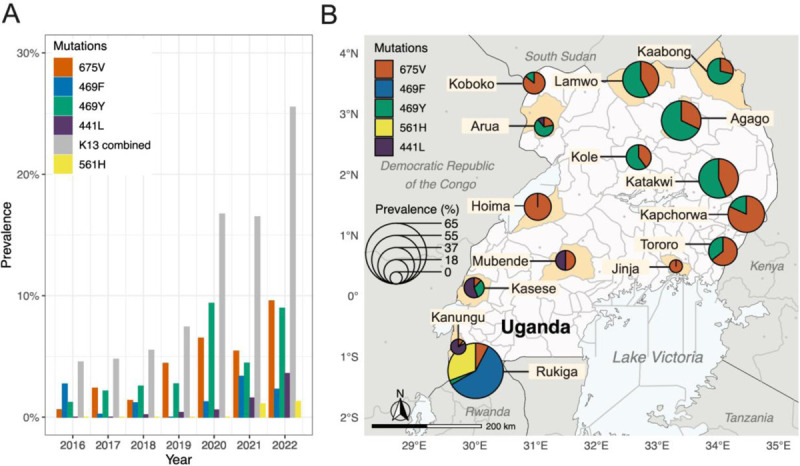
Background: Artemisinin partial resistance, mediated by mutations in the Plasmodium falciparum Kelch13 protein (K13), rapidly spread in South-East Asia (SEA), undermining antimalarial efficacies of artemisinin-based combination therapies (ACT). Validated K13 mutations have recently arisen in Africa, but rates of increase are not well characterized.
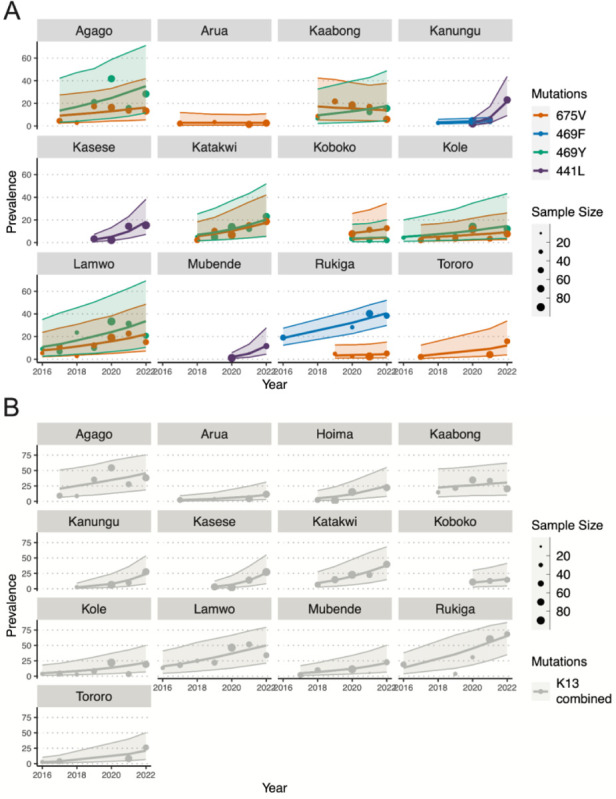
Methods: We investigated K13 mutation prevalence at 16 sites in Uganda (2016-2022, 6586 samples), and five sites in SEA (2003-2018, 5465 samples) by calculating selection coefficients using Bayesian mixed-effect linear models. We then tested whether SEA K13 mutation prevalence could have been forecast accurately using up to the first five years of available data and forecast future K13 mutation prevalence in Uganda.
Findings: The selection coefficient for the prevalence of relevant K13 mutations (441L, 469F/Y, 561H, 675V) was estimated at s=0·383 (95% CrI: 0·247 - 0·528) per year, a 38% relative prevalence increase. Selection coefficients across Uganda were s=0·968 (0·463 - 1·569) for 441L, s=0·153 (-0·445 - 0·727) for 469F, s=0·222 (-0·011 - 0·398) for 469Y, and s=0·152 (-0·023 - 0·312) for 675V. In SEA, the selection coefficient was s=-0·005 (-0·852 - 0·814) for 539T, s=0·574 (-0·092 - 1·201) for 580Y, and s=0·308 (0·089 - 0·536) for all validated K13 mutations. Forecast prevalences for Uganda assuming constant selection neared fixation (>95% prevalence) within a decade (2028-2033) for combined K13 mutations.
Interpretation: The selection of K13 mutations in Uganda was at a comparable rate to that observed in SEA, suggesting K13 mutations may continue to increase quickly in Uganda.
Funding: NIH R01AI156267, R01AI075045, and R01AI089674.
Conflict of interest statement
Declaration of interests The authors declare they have no competing interests.
Figures


References
-
- Phillips MA, Burrows JN, Manyando C, van Huijsduijnen RH, Van Voorhis WC, Wells TNC. Malaria. Nat Rev Dis Primer 2017; 3: 17050. - PubMed
-
- World Health Organization. Antimalarial drug combination therapy. Report of a WHO technical consultation. Geneva World Health Organ; 2001; 33.
-
- World Health Organization. Guidelines for the treatment of malaria. World Health Organization, 2015.
Publication types
LinkOut - more resources
Full Text Sources
Research Materials