[Preprint]. 2024 Jan 31:2024.01.31.578241.
doi: 10.1101/2024.01.31.578241.

Bacterium secretes chemical inhibitor that sensitizes competitor to bacteriophage infection

Affiliations

Bacterium secretes chemical inhibitor that sensitizes competitor to bacteriophage infection

Zhiyu Zang et al. bioRxiv. .

Update in

Abstract

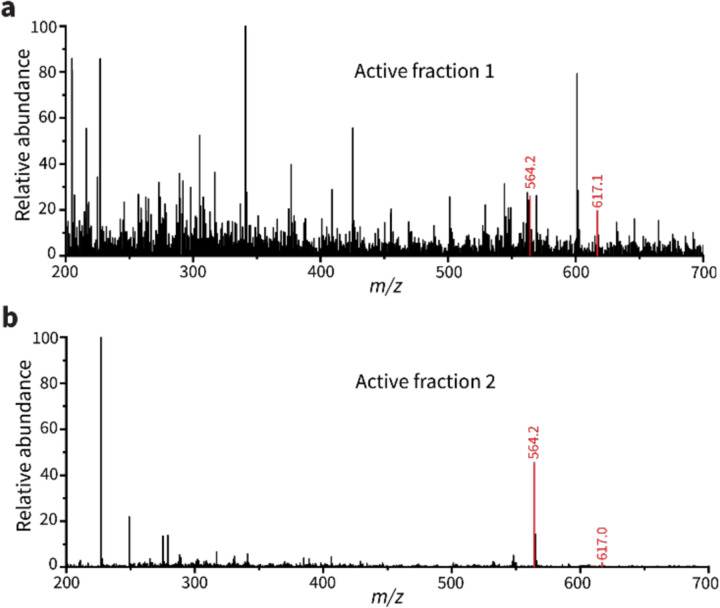
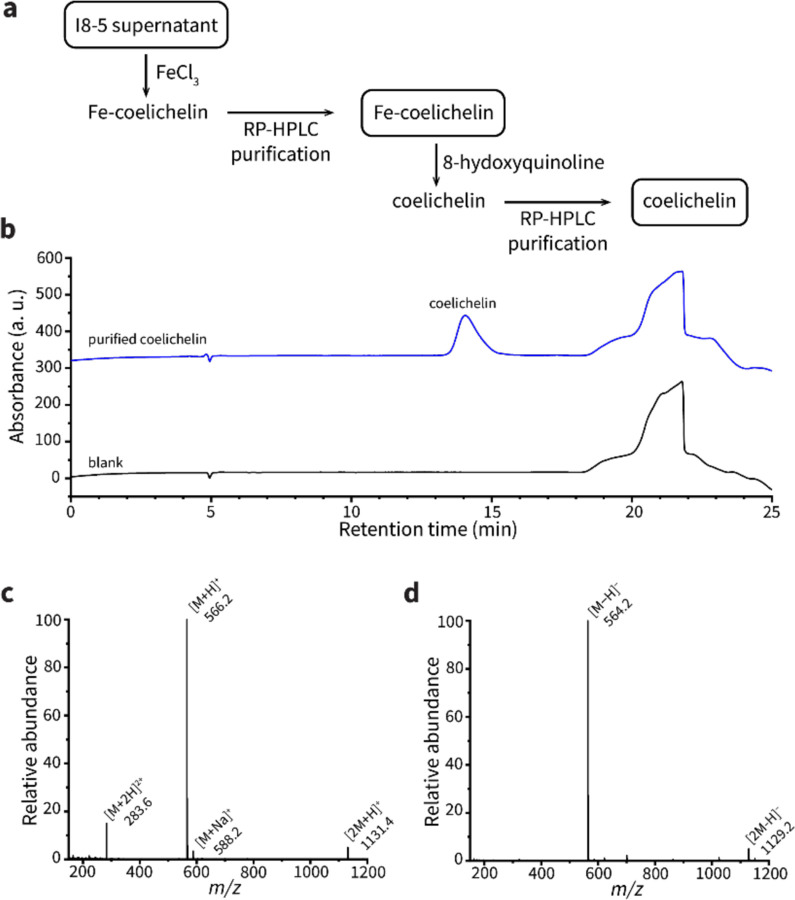
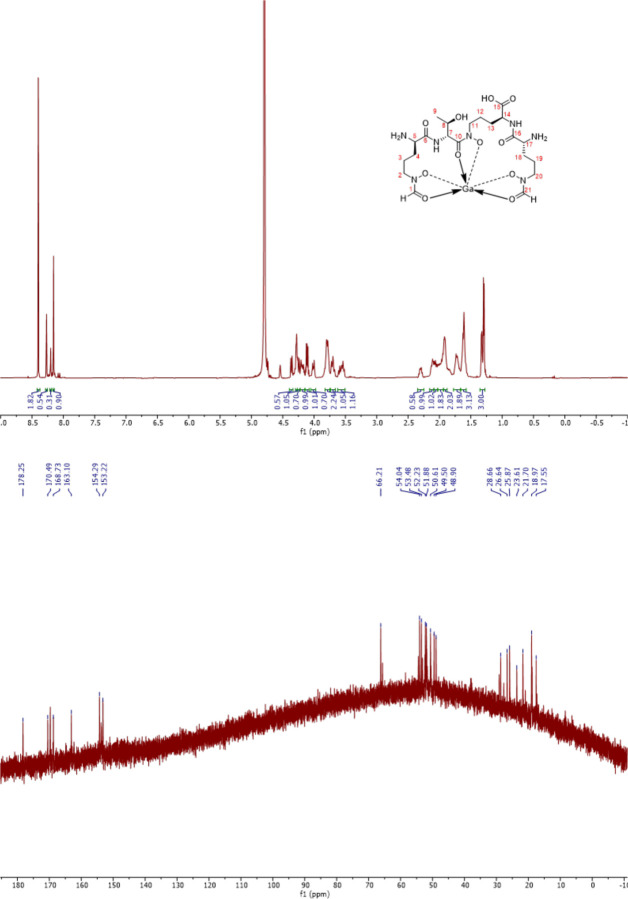
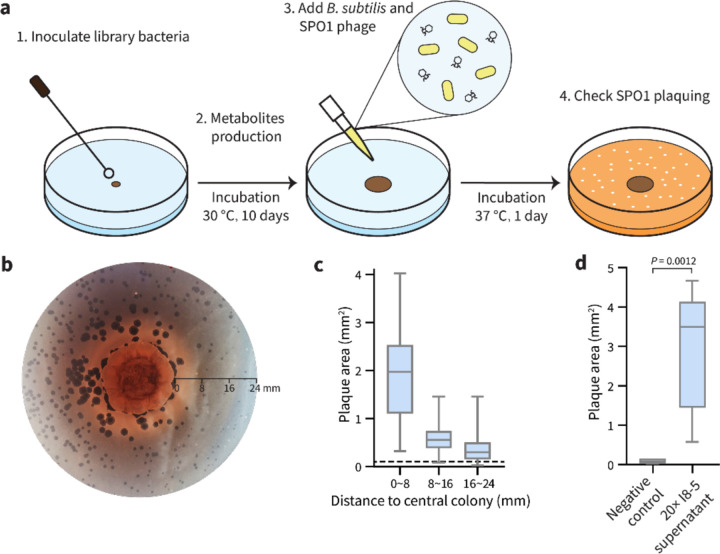
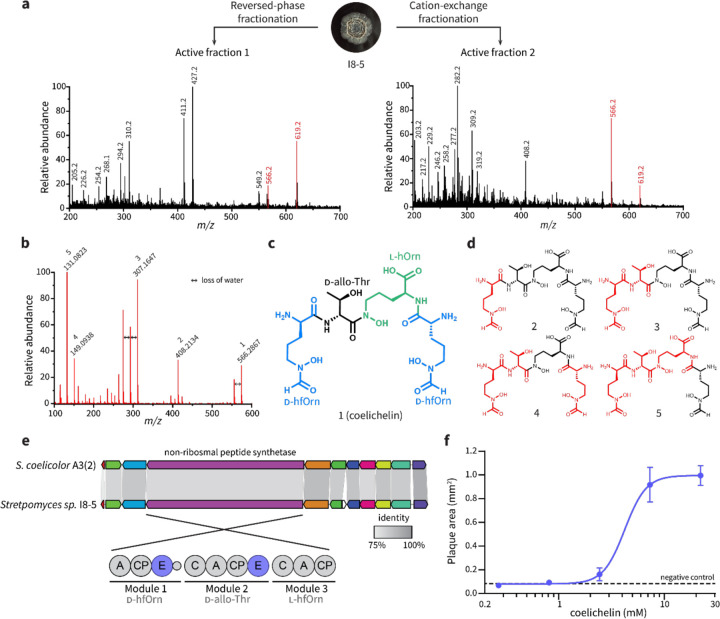
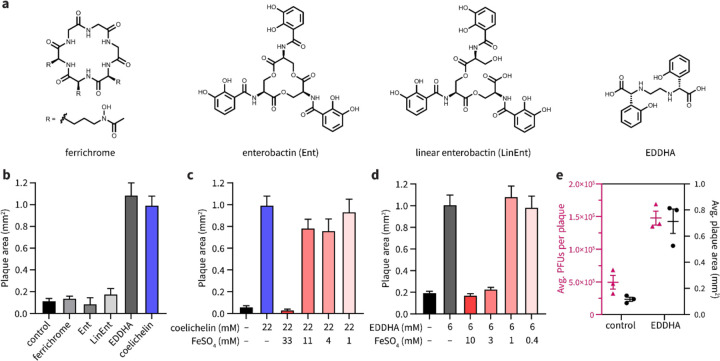
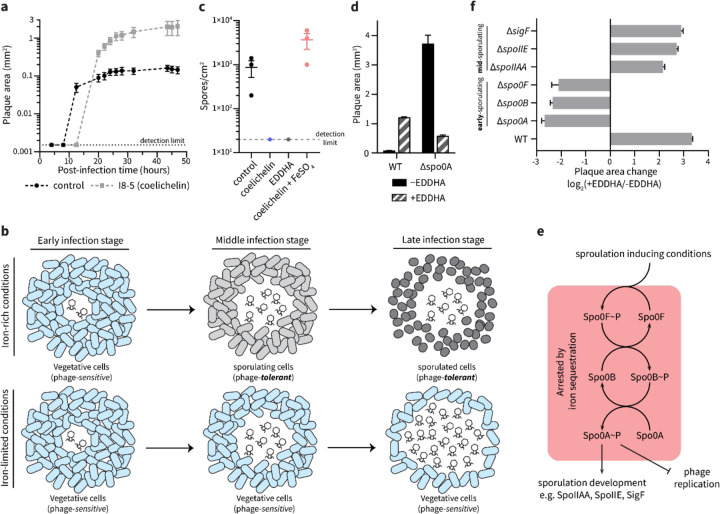
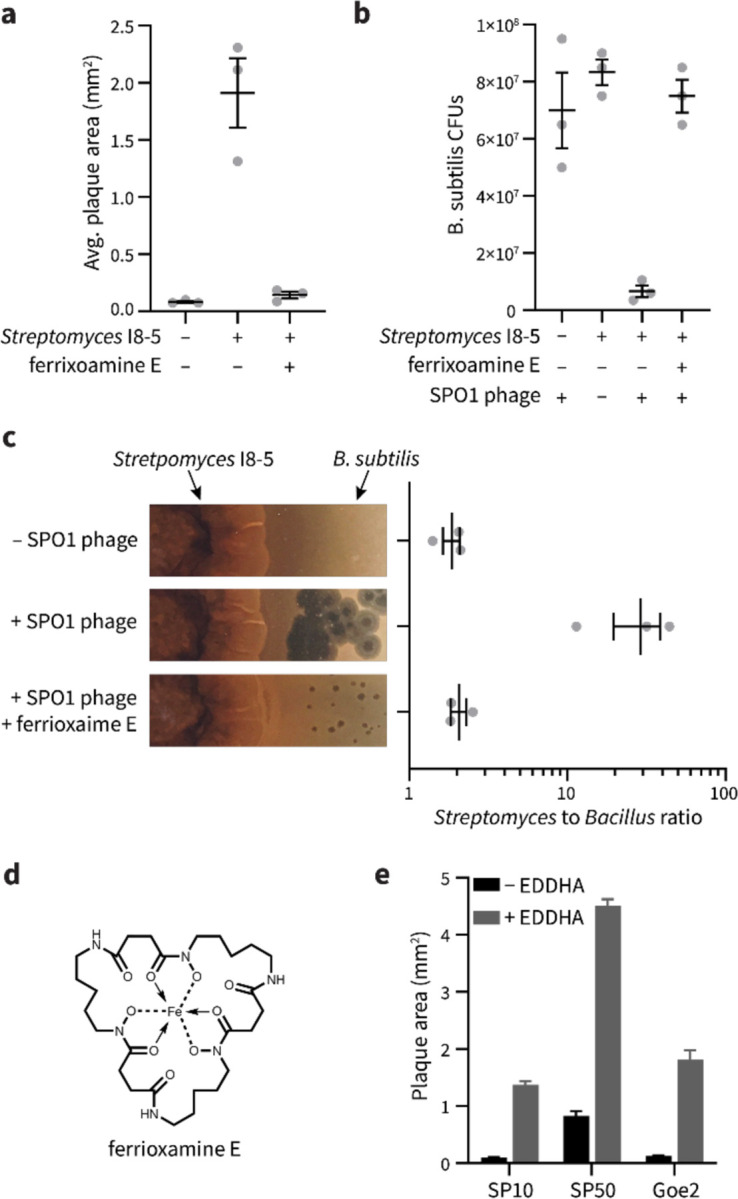
To overtake competitors, microbes produce and secrete secondary metabolites that kill neighboring cells and sequester nutrients. This natural product-mediated competition likely evolved in complex microbial communities that included viral pathogens. From this ecological context, we hypothesized that microbes secrete metabolites that "weaponize" natural pathogens (i.e., bacteriophages) to lyse their competitors. Indeed, we discovered a bacterial secondary metabolite that sensitizes other bacteria to phage infection. We found that this metabolite provides the producer (a Streptomyces sp.) with a fitness advantage over its competitor (Bacillus subtilis) by promoting phage infection. The phage-promoting metabolite, coelichelin, sensitized B. subtilis to a wide panel of lytic phages, and it did so by preventing the early stages of sporulation through iron sequestration. Beyond coelichelin, other natural products may provide phage-mediated competitive advantages to their producers-either by inhibiting sporulation or through yet-unknown mechanisms.


Figures

Extended data Fig. 1 |
Extended data Fig. 1 |. The negative mode electrospray ionization MS spectra of active fraction 1 (a) and active fraction 2 (b).
The shared peaks are highlighted red.
Extended Data Fig. 2 |
Extended Data Fig. 2 |. Coelichelin isolation from I8-5 supernatant.
(a) Isolation scheme. (b) UV chromatogram at 210 nm. Water was used as the blank. (c) The averaged MS spectrum at positive mode between retention time 13.5~14.8 min. (d) The averaged MS spectrum at negative mode between retention time 13.5~14.8 min. M represents coelichelin.
Extended Data Fig. 3 |
1H NMR spectrum (600 MHz, top) and 13C NMR spectrum (125 MHz, bottom) of Ga-coelichelin in D2O.
Figure 1.
Figure 1.. Binary-interaction screen identifies a Streptomyces sp. that promotes SPO1 phage predation of B. subtilis.
(a) Scheme of the binary-interaction screen. (b) A mature colony of Streptomyces sp. I8-5 (center) promoted SPO1 phage proliferation nearby (dark circles are plaques), especially within a radius of 8 mm. (c) Quantification of plaque areas with increasing distance from the Streptomyces sp. I8-5 colony. Data are represented as boxplots, showing the median, interquartile ranges and minimum (bottom bar) and maximum (top bar). The dashed line represents the average plaque area of SPO1 phages in the absence of the Streptomyces colony. At least 72 plaques were measured for each condition. (d) The I8-5 supernatant was concentrated 20 times and tested for the ability to enlarge SPO1 plaques. Water was used as a negative control. Data are represented as boxplots, showing the median, interquartile ranges and minimum (bottom bar) and maximum (top bar). At least nine plaques were measured for each condition.
Figure 2.
Figure 2.. Coelichelin is the active metabolite that promotes phage predation.
(a) Bioactivity-guided fractionation and MS analysis identified only two putative metabolites present in both active fractions purified from orthogonal separation techniques. Positive mode electrospray ionization results are shown here, and matching negative mode peaks (m/z 564.2 and 617.2) are shown in Extended Data Fig. 1. (b) MS/MS spectrum of the m/z 566.2867 peak, matching that of the [M+H]+ adduct of coelichelin. (c) Chemical structure of coelichelin, highlighting each amino acid residue. (d) Key fragment losses of coelichelin in the MS/MS analysis, annotated with their associated peak number from panel (b). Black atoms indicate the observed fragment ions, and the neutral lost fragments are highlighted in red. (e) Comparison of the Streptomyces sp. I8-5 coelichelin biosynthetic gene cluster with the reported one from S. coelicolor A3(2). The percent identity between each pair of genes is shown with shading (all were >75%). The modules of the coelichelin non-ribosomal peptide synthetase are shown in detail below. The three modules are responsible for installation of D-δ-N-formyl-δ-N-hydroxyornithine (D-hfOrn), D-allo-threonine (D-allo-Thr), and L-δ-N-hydroxyornithine (l-hOrn), respectively. The adenylation domains (A), thiolation and peptide carrier proteins (CP), condensation domains (C), and epimerization domains (E) are shown. (f) Pure coelichelin enlarged phage plaques in a dose-dependent manner (EC50=4.2 mM). Water was used as a negative control. Data are represented as the average ± SEM from at least seven individual plaques of each condition.
Figure 3.
Figure 3.. Coelichelin promotes phage predation by sequestering iron.
(a) Chemical structures of ferrichrome, enterobactin (Ent), linear enterobactin (LinEnt), and ethylenediamine-N,N′-bis(2-hydroxyphenyl-acetic acid) (EDDHA). (b) Ferrichrome (20 mM), Ent (10 mM), LinEnt (20 mM), and EDDHA (6 mM) were tested for the ability to increase SPO1 plaque areas. Water was used as a negative control. Data are represented as the average ± SEM from at least four individual plaques of each condition. (c) Iron complementation antagonized the plaquing promotion effect of coelichelin and (d) EDDHA. Water was used as a negative control. Data are represented as the average ± SEM from at least six individual plaques of each condition. (e) The average plaque forming units (PFUs) per plaque and plaque area were measured with EDDHA (6 mM) or water (control) treatment. At least 13 plaques were selected for each condition. Data are represented as the average ± SEM from three independent biological replicates. Symbols show the values of each biological replicate.
Figure 4.
Figure 4.. Iron sequestration inhibits sporulation initiation in B. subtilis.
(a) The plaque size development of SPO1 phage on B. subtilis grown ~8 mm from to an I8-5 colony (coelichelin produced) or B. subtilis alone (control). Data are represented as the average ± SEM from at least eight individual plaques of each condition. (b) Schematic model for iron sequestration-induced promotion of phage infection: under iron-rich conditions, B. subtilis cells sporulate when nutrients are limited. Once the sporulation process initiates in B. subtilis cells, phage proliferation is arrested (top). However, when iron is limited, B. subtilis cells are unable to sporulate, allowing phages to continue infecting vegetative B. subtilis cells (bottom). (c) The influence of iron starvation on B. subtilis sporulation. The number of spores formed under treatment of water (control), coelichelin (22 mM), EDDHA (6 mM), and coelichelin (22 mM) + FeSO4 (33 mM). Iron starvation inhibited sporulation. Data are represented as the average ± SEM from three independent biological replicates. Circles show the values of each biological replicate. (d) The plaque-enlarging effect of EDDHA (6 mM) was tested against B. subtilis WT and Δspo0A. Water was used as the −EDDHA control. The Δspo0A mutant naturally formed larger plaques that were not further increased by iron sequestration. Data are represented as the average ± SEM from at least six individual plaques of each condition. (e) Schematic representation of sporulation steps in B. subtilis. (f) The plaque size ratio between EDDHA-treated and untreated samples of different mutants. Mutations in spo0A and earlier genes eliminated the phage-promoting effects of iron sequestration. Data are represented as the average ratio ± SEM calculated from at least four individual plaques of each condition.
Figure 5.
Figure 5.. Coelichelin helps Streptomyces to outcompete B. subtilis.
(a) The average plaque areas of SPO1 on B. subtilis alone, and B. subtilis neighboring Streptomyces I8-5 colony with or without ferrioxamine E as excess iron source. At least eight plaques were selected for each replicate. Data are represented as the average ± SEM from three independent biological replicates. Circles show the values of each biological replicate. (b) The colony forming units of B. subtilis measured in the presence of phages, neighboring Streptomyces I8-5 colony with and without phages, and neighboring Streptomyces I8-5 colony with ferrioxamine E as excess iron source in the presence of phages. Data are represented as the average ± SEM from three independent biological replicates. Circles show the values of each biological replicate. (c) Streptomyces to B. subtilis ratio calculated from colony forming units measured after 2 days of co-culture. Data are represented as the average ± SEM from three independent biological replicates. Circles show the values of each biological replicate. (d) The chemical structure of ferrioxamine E. (e) The plaquing promotion effect of EDDHA (6 mM) for phages SP10, SP50, and Goe2 on B. subtilis. Water was used as the −EDDHA control. Data are represented as the average ratio ± SEM calculated from at least four individual plaques of each condition.

Similar articles

References

    1. Hibbing M. E.; Fuqua C.; Parsek M. R.; Peterson S. B. Bacterial Competition: Surviving and Thriving in the Microbial Jungle. Nature Reviews Microbiology 2010, 8 (1), 15–25. - PMC - PubMed
    1. Friedrich M. W., Microbial Communities, Structure, and Function. In Encyclopedia of Geobiology, Reitner J.; Thiel V., Eds. Springer Netherlands: Dordrecht, 2011; p 592–595.
    1. Ghoul M.; Mitri S. The Ecology and Evolution of Microbial Competition. Trends in Microbiology 2016, 24 (10), 833–845. - PubMed
    1. Westhoff S.; Kloosterman A. M.; Hoesel S. F. A. v.; Wezel G. P. v.; Rozen D. E. Competition Sensing Changes Antibiotic Production in Streptomyces. mBio 2021, 12 (1), 10.1128/mbio.02729-20. - DOI - PMC - PubMed
    1. Valle J.; Da Re S.; Henry N.; Fontaine T.; Balestrino D.; Latour-Lambert P.; Ghigo J.-M. Broad-Spectrum Biofilm Inhibition by a Secreted Bacterial Polysaccharide. Proceedings of the National Academy of Sciences 2006, 103 (33), 12558–12563. - PMC - PubMed

Publication types