

This is a preprint.
Mapping Stress-Responsive Signaling Pathways Induced by Mitochondrial Proteostasis Perturbations
- PMID: 38352575
- PMCID: PMC10862789
- DOI: 10.1101/2024.01.30.577830
Mapping Stress-Responsive Signaling Pathways Induced by Mitochondrial Proteostasis Perturbations
Update in
-
Mapping stress-responsive signaling pathways induced by mitochondrial proteostasis perturbations.Mol Biol Cell. 2024 May 1;35(5):ar74. doi: 10.1091/mbc.E24-01-0041. Epub 2024 Mar 27. Mol Biol Cell. 2024. PMID: 38536439 Free PMC article.
Abstract
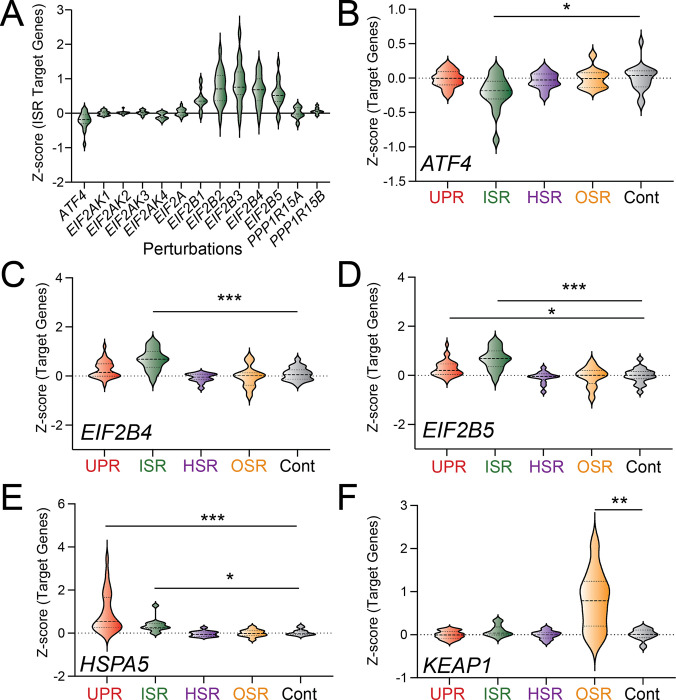
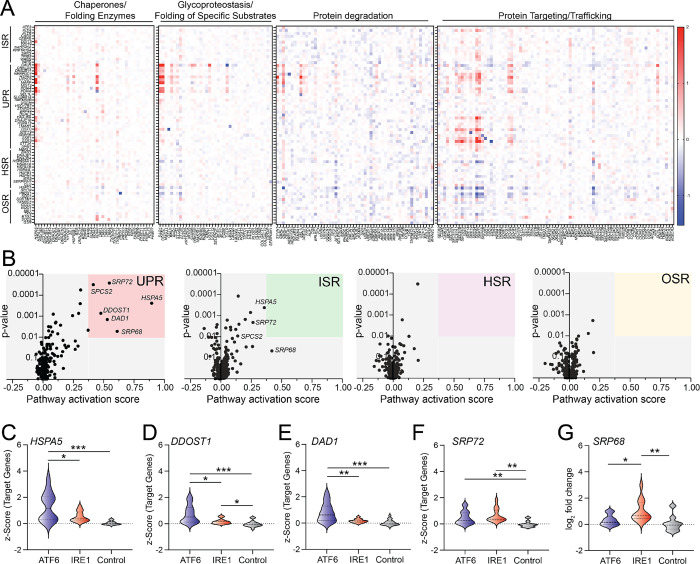
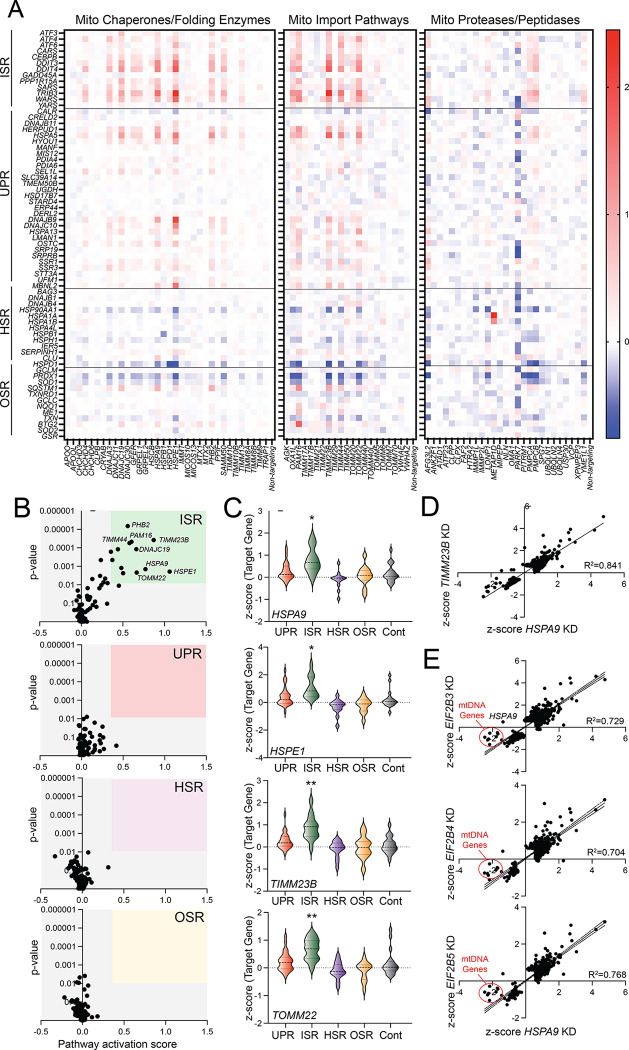
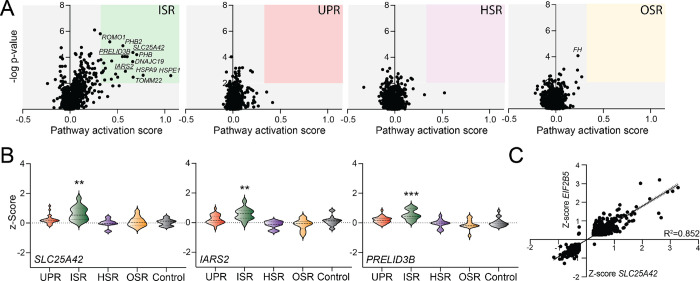
Imbalances in mitochondrial proteostasis are associated with pathologic mitochondrial dysfunction implicated in etiologically-diverse diseases. This has led to considerable interest in defining the biological mechanisms responsible for regulating mitochondria in response to mitochondrial stress. Numerous stress responsive signaling pathways have been suggested to regulate mitochondria in response to proteotoxic stress, including the integrated stress response (ISR), the heat shock response (HSR), and the oxidative stress response (OSR). Here, we define the specific stress signaling pathways activated in response to mitochondrial proteostasis stress by monitoring the expression of sets of genes regulated downstream of each of these signaling pathways in published Perturb-seq datasets from K562 cells CRISPRi-depleted of individual mitochondrial proteostasis factors. Interestingly, we find that the ISR is preferentially activated in response to mitochondrial proteostasis stress, with no other pathway showing significant activation. Further expanding this study, we show that broad depletion of mitochondria-localized proteins similarly shows preferential activation of the ISR relative to other stress-responsive signaling pathways. These results both establish our gene set profiling approach as a viable strategy to probe stress responsive signaling pathways induced by perturbations to specific organelles and identify the ISR as the predominant stress-responsive signaling pathway activated in response to mitochondrial proteostasis disruption.
Conflict of interest statement
CONFLICT OF INTEREST STATEMENT The authors declare no conflicts related to this work. The opinions and assertions expressed herein are those of the author(s) and do not reflect the official policy or position of the Uniformed Services University of the Health Sciences or the Department of Defense.
Figures
Similar articles
-
Mapping stress-responsive signaling pathways induced by mitochondrial proteostasis perturbations.Mol Biol Cell. 2024 May 1;35(5):ar74. doi: 10.1091/mbc.E24-01-0041. Epub 2024 Mar 27. Mol Biol Cell. 2024. PMID: 38536439 Free PMC article.
-
Deconvoluting Stress-Responsive Proteostasis Signaling Pathways for Pharmacologic Activation Using Targeted RNA Sequencing.ACS Chem Biol. 2019 Apr 19;14(4):784-795. doi: 10.1021/acschembio.9b00134. Epub 2019 Mar 13. ACS Chem Biol. 2019. PMID: 30821953 Free PMC article.
-
Regulating Secretory Proteostasis through the Unfolded Protein Response: From Function to Therapy.Trends Cell Biol. 2017 Oct;27(10):722-737. doi: 10.1016/j.tcb.2017.05.006. Epub 2017 Jun 21. Trends Cell Biol. 2017. PMID: 28647092 Free PMC article. Review.
-
Stress response mechanisms in protein misfolding diseases: Profiling a cellular model of Huntington's disease.Arch Biochem Biophys. 2023 Sep 1;745:109711. doi: 10.1016/j.abb.2023.109711. Epub 2023 Aug 2. Arch Biochem Biophys. 2023. PMID: 37541563
-
The eIF2α kinase HRI in innate immunity, proteostasis, and mitochondrial stress.FEBS J. 2021 May;288(10):3094-3107. doi: 10.1111/febs.15553. Epub 2020 Oct 3. FEBS J. 2021. PMID: 32892501 Review.
References
-
- Consortium T. P., coordination O., Elsasser S., Elia L. P., Morimoto R. I., Powers E. T., group H. M. S., Finley D., University of California S. F., I G. I. g., Mockler E., Lima L., Finkbeiner S., University of California, S. F. g. I., Gestwicki J. E., group, N. U., Stoeger T., Cao K., group, T. S. R. I., Garza D., Kelly J. W., group, S. U., Collier M., Rainbolt T. K., Taguwa S., Chou C.-C., Aviner R., Barbosa N., Morales-Polanco F., Masto V. B. & Frydman J. A Comprehensive Enumeration of the Human Proteostasis Network. 1. Components of Translation, Protein Folding, and Organelle-Specific Systems. bioRxiv, 2022.2008.2030.505920, doi:10.1101/2022.08.30.505920 (2022). - DOI
Publication types
Grants and funding
LinkOut - more resources
Full Text Sources