[Preprint]. 2024 Feb 1:2024.01.30.574142.
doi: 10.1101/2024.01.30.574142.

Age-Related RPE changes in Wildtype C57BL/6J Mice between 2 and 32 Months

Affiliations

Age-Related RPE changes in Wildtype C57BL/6J Mice between 2 and 32 Months

Debresha A Shelton et al. bioRxiv. .

Abstract

Purpose: This study provides a systematic evaluation of age-related changes in RPE cell structure and function using a morphometric approach. We aim to better capture nuanced predictive changes in cell heterogeneity that reflect loss of RPE integrity during normal aging. Using C57BL6/J mice ranging from P60-P730, we sought to evaluate how regional changes in RPE shape reflect incremental losses in RPE cell function with advancing age. We hypothesize that tracking global morphological changes in RPE is predictive of functional defects over time.

Methods: We tested three groups of C57BL/6J mice (young: P60-180; Middle-aged: P365-729; aged: 730+) for function and structural defects using electroretinograms, immunofluorescence, and phagocytosis assays.

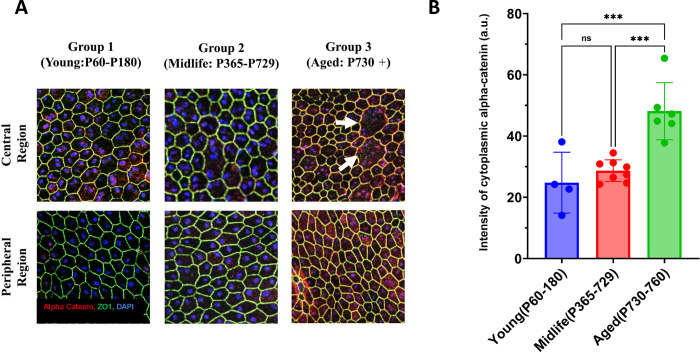
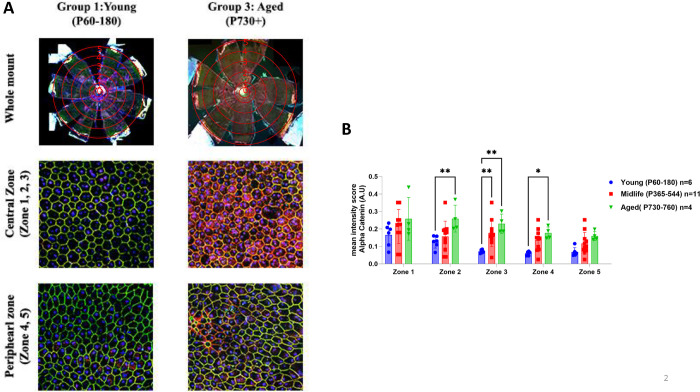
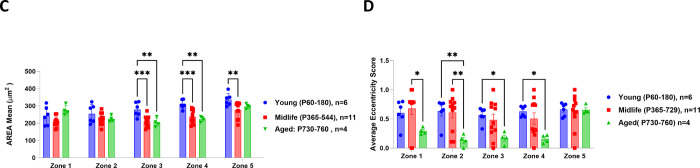
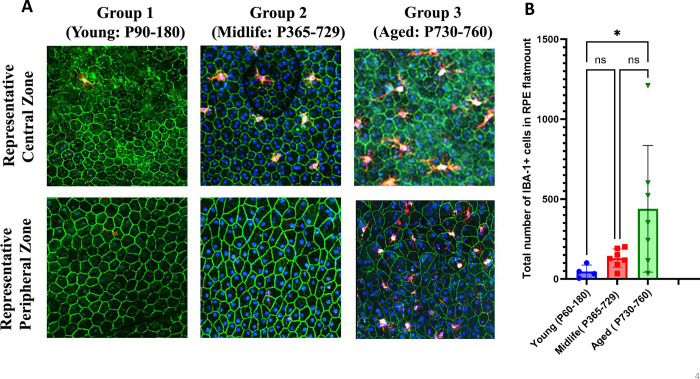
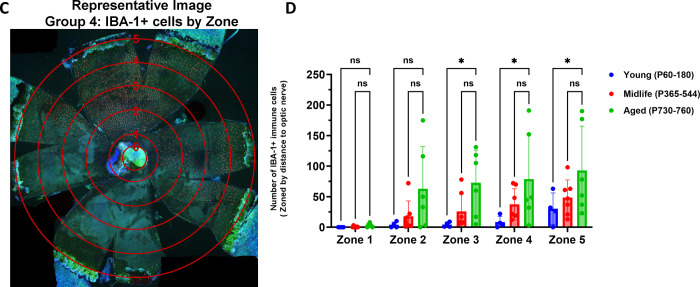
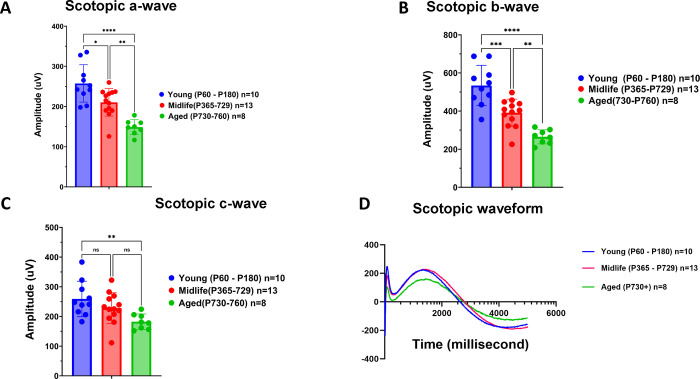
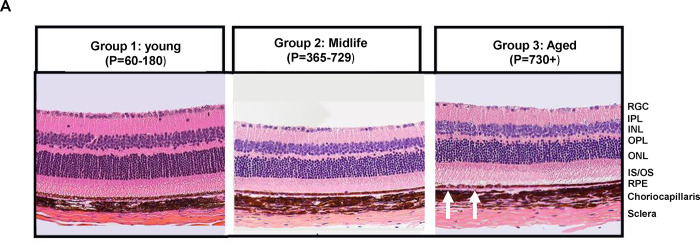
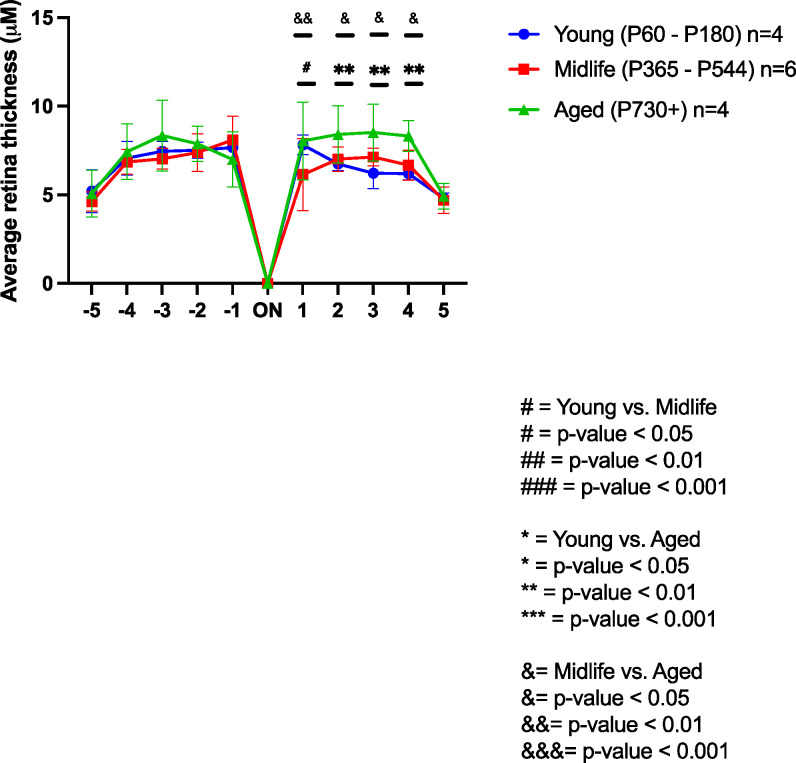
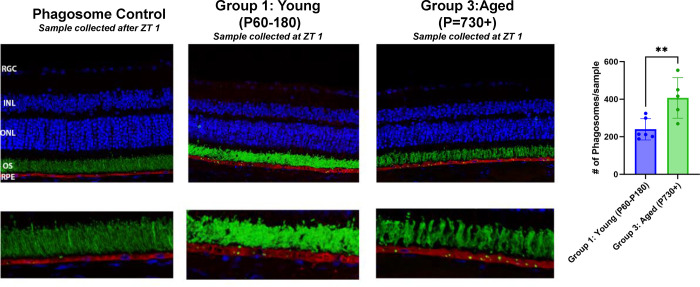
Results: The largest changes in RPE morphology were evident between the young and aged groups, while the middle-aged group exhibited smaller but notable region-specific differences. We observed a 1.9-fold increase in cytoplasmic alpha-catenin expression specifically in the central-medial region of the eye between the young and aged group. There was an 8-fold increase in subretinal, IBA-1-positive immune cell recruitment and a significant decrease in visual function in aged mice compared to young mice. Functional defects in the RPE corroborated by changes in RPE phagocytotic capacity.

Conclusions: The marked increase of cytoplasmic alpha-catenin expression and subretinal immune cell deposition, and decreased visual output coincide with regional changes in RPE cell morphometrics when stratified by age. These cumulative changes in the RPE morphology showed predictive regional patterns of stress associated with loss of RPE integrity.


Figures

Figure 1:
Figure 1:. Natural aging of the retinal pigment epithelium resulted in ectopic localization of the structural protein, alpha-catenin.
RPE flat mounts from animals in Young (P60–180), Middle-aged (P365–729), and Aged (P730+) were collected and stained for anti-alpha catenin [1:500; red], anti-ZO-1[1:200; green], and DAPI [blue]. The figure shows a representative image of cytoplasmic localization of alpha-catenin into the cytoplasm of cells that exhibit atypical morphology [Figure 1A]. White arrows show examples of enlarged RPE cells with cytoplasmic expression of alpha-catenin. The prevalence of these cells increased in the aged group and is quantified in Fig 1B. n=4–8 animals/group. One-way ANOVA was used for analysis. Error bars: SD * Represents p value <0.05; ** represents p value <0.01; *** represents p value <0.001; **** represents p value <0.0001. Sample size: 4–8 animals/group.
Figure 2:
Figure 2:. Cytoplasmic Alpha-catenin localization displays regional distribution patterns and was highly expressed centrally in aging animals.
RPE flat mounts were segmented into concentric zones around the optic nerve and cropped for segmentation using CellProfiler. Zone locations are shown in representative image in Figure 2A. Multiple parameters were analyzed including the mean intensity of alpha catenin within the cytoplasm of the RPE cells (See figure 2B),, average area of cells(Figure 2C) and RPE cell shape (eccentricity) (Figure 2D). N=4–11/group. Analysis: Two-way ANOVA withTukey’s comparision (2B,2C and 2D); error bars: SD, *=p<0.05, **= p<0.01, ***= p<0.001.
Figure 3:
Figure 3:. Inflammatory cell deposition within the RPE sheet increased with increasing age.
RPE flat mounts were stained with an inflammatory cell marker, IBA-1[1:1000; red], ZO1(1:200; green], and Hoechst 33258 [blue]. Representative images show increased deposition of IBA-1 positive cells both centrally and peripherally in the aged group compared to the youngest in Figure 3A (group 1). The total IBA-1 positive cells were counted using Imaris [Figure 3B]. The flat mounts were then segmented into zones as previously mentioned and quantified with CellProfiler pipeline per zone. Quantification of these results are shown in Figure 3C and 3D. N=3–7 animals/group. Analysis: and Kruskal-Wallis with Dunn’s Correction test (3B) and Two-way ANOVA with Tukey’s comparison test(3D); error bars: SD *=p<0.05, **= p<0.01, ***= p<0.001
Figure 4:
Figure 4:. Significant loss of visual function with natural aging with moderate loss of function within the RPE.
Raw electroretinogram waveforms from the young, middle-aged, and aged groups under scotopic conditions and after a 10-cd s/m2 light flash are shown (Panel D). At multiple flash intensities, there were significant differences between all groups and group 1 for scotopic a-wave, and scotopic b-wave, while the scotopic c-wave was only modestly significant between the young and aged groups. The significant reductions in ERG response, suggests that there were dysfunctional photoreceptors and bipolar cells. Additionally, the reduction in RPE c-wave response at 10Hz in aged group compared to young group suggests that the age-related changes in the RPE were affecting visual function, as well. One– Way ANOVA with Tukey’s comparison test*** represents p value <0.001; **** represents p value <0.0001 Samples sizes: 8–13 animals/group.
Figure 5:
Figure 5:. Aging animals showed modest signs of irregular morphology and retinal swelling in Hematoxylin & Eosin (H&E) staining compared to young animals.
High magnification retina images (Figure 5A: panel 1–3) were shown for all 3 groups. The quantification of total retinal thickness is shown in figure 5B and shows regional changes in retinal thickness of aged mice compared to the youngest group. Two – Way ANOVA with Dunnett’s correction multiple comparisons test for retinal thickness analysis*, # = p value <0.05; **, ## = p value <0.01; ***, ### = p value < 0.001; ****, #### = p value < 0.0001 (* symbols indicate significance between young group vs . aged group: # symbols indicate significant between the young and aged group. Samples sizes: 4–6 animals/ group)
Figure 6:
Figure 6:. Natural aging resulted in retention of phagosomes within the RPE compared to young animals.
Whole eyes were extracted from animals at Zeitgeber 1 [ZT1] within 1 hour of environmental light cue onset [ZT1] in each group. The sections were stained with Rhodopsin [green], Best1 [red], and DAPI [blue]. Representative images of a phagosome accumulation in the healthy control animal group [note: sample collected outside of ZT1] (far left panel), young group (middle panel) and aged group (far right panel) from a that was collected outside of the maximal phagosome production time (note: young and aged group samples were collected after ZT1 or 1 hour after lights on (7AM)). Rhodopsin containing phagosomes within the RPE were counted manually by three blinded observers and quantified. Results showed increased phagosomes within the RPE of the oldest group compared to the youngest animals or the ZT control suggesting that there may be aberrant turnover or maturation of the RPE phagosomes in aging mice. N=5–6/group. Analysis: Unpaired t-test ; error bars: Standard deviation *=p<0.05, **= p<0.01,***= p<0.001.

Similar articles

References

    1. Pauleikhoff D, Harper CA, Marshall J, Bird AC. Aging Changes in Bruch’s Membrane: A Histochemical and Morphologic Study. Ophthalmology [Internet]. 1990. Feb 1 [cited 2023 Jul 16];97(2):171–8. Available from: http://www.aaojournal.org/article/S0161642090326192/fulltext - PubMed
    1. Gullapalli VK, Sugino IK, Van Patten Y, Shah S, Zarbin MA. Impaired RPE survival on aged submacular human Bruch’s membrane. Exp Eye Res. 2005. Feb;80(2):235–48. - PubMed
    1. Feeney-Burns L, Ellersieck MR. Age-Related Changes in the Ultrastructure of Bruch’s Membrane. Am J Ophthalmol. 1985. Nov 1;100(5):686–97. - PubMed
    1. Rashid A, Bhatia SK, Mazzitello KI, Chrenek MA, Zhang Q, Boatright JH, et al. RPE cell and sheet properties in normal and diseased eyes. In: Advances in Experimental Medicine and Biology. Springer New York LLC; 2016. p. 757–63. - PMC - PubMed
    1. Bhatia SK, Rashid A, Chrenek MA, Zhang Q, Bruce BB, Klein M, et al. Analysis of RPE morphometry in human eyes. Mol Vis. 2016;22:898–916. - PMC - PubMed

Publication types