. 2024 Jan 29:15:1323409.
doi: 10.3389/fimmu.2024.1323409. eCollection 2024.

Inflammasome signaling is dispensable for ß-amyloid-induced neuropathology in preclinical models of Alzheimer's disease

Affiliations

Inflammasome signaling is dispensable for ß-amyloid-induced neuropathology in preclinical models of Alzheimer's disease

Sahana Srinivasan et al. Front Immunol. .

Abstract

Background: Alzheimer's disease (AD) is the most common neurodegenerative disorder affecting memory and cognition. The disease is accompanied by an abnormal deposition of ß-amyloid plaques in the brain that contributes to neurodegeneration and is known to induce glial inflammation. Studies in the APP/PS1 mouse model of ß-amyloid-induced neuropathology have suggested a role for inflammasome activation in ß-amyloid-induced neuroinflammation and neuropathology.

Methods: Here, we evaluated the in vivo role of microglia-selective and full body inflammasome signalling in several mouse models of ß-amyloid-induced AD neuropathology.

Results: Microglia-specific deletion of the inflammasome regulator A20 and inflammasome effector protease caspase-1 in the AppNL-G-F and APP/PS1 models failed to identify a prominent role for microglial inflammasome signalling in ß-amyloid-induced neuropathology. Moreover, global inflammasome inactivation through respectively full body deletion of caspases 1 and 11 in AppNL-G-F mice and Nlrp3 deletion in APP/PS1 mice also failed to modulate amyloid pathology and disease progression. In agreement, single-cell RNA sequencing did not reveal an important role for Nlrp3 signalling in driving microglial activation and the transition into disease-associated states, both during homeostasis and upon amyloid pathology.

Conclusion: Collectively, these results question a generalizable role for inflammasome activation in preclinical amyloid-only models of neuroinflammation.

Keywords: Alzheimer’s disease; inflammasome; microglia; neuroinflammation; ß-amyloid.


Conflict of interest statement

SD, IP, HM, and AB are employed by Janssen Pharmaceutica NV. ML serves as a consultant for Ventyx Biosciences and Novo Nordisk outside of the submitted work. The remaining authors declare that the research was conducted in the absence of any commercial or financial relationships that could be construed as a potential conflict of interest.

Figures

Figure 1
Figure 1
Microglial A20 deficiency does not exacerbate AD pathology in AppNL-G-F mice. (A) Quantification of the area covered by 6E10+ amyloid plaque deposits in whole brains of 20 week-old A20FL (black) and A20Cx3Cr1-KO AppNL-G-F mice (red). Each symbol represents one mouse, n=5-6 per group (males, dark color; females, pale color). Data are represented as mean ± SEM. (B) Immunohistochemistry for 6E10+ amyloid plaque load in the hippocampus (HC) and frontal cortex (FC) of 20 week-old A20FL and A20Cx3Cr1-KO AppNL-G-F mice. Scale bars: 100 µm (inset: 50 µm). Representative images are displayed. (C) Quantification of the number of 6E10+ amyloid plaque deposits in whole brains of 56 week-old A20FL (black) and A20Cx3Cr1-KO AppNL-G-F mice (red). Each symbol represents one mouse, n=6 per group (males, dark color; females, pale color). Data are represented as mean ± SEM. (D) Immunohistochemistry for 6E10+ amyloid plaque load in the hippocampus (HC) and frontal cortex (FC) of 56 week-old A20FL and A20Cx3Cr1-KO AppNL-G-F mice. Scale bars: 100 µm (inset: 50 µm). Representative images are displayed. (E) Quantification of the number of Iba1+ microglia in the hippocampus of 20 week-old A20FL and A20Cx3Cr1-KO AppWT and AppNL-G-F mice. Each symbol represents one mouse, n=4-5 per group (AppWT ); n=9 per group (AppNL-G-F ). Data are represented as mean ± SEM. Significant differences are determined using two-way ANOVA (**, p<0.001). (F) Immunohistochemistry for Iba1+ microglia in the hippocampus of 20 week-old A20FL and A20Cx3Cr1-KO AppWT and AppNL-G-F mice. Scale bars: 100µm (inset: 50 µm). Representative images are displayed. (G) Quantification of the number of Iba1+ microglia in the hippocampus of 56 week-old A20FL and A20Cx3Cr1-KO AppWT and AppNL-G-F mice. Each symbol represents one mouse, n=4 per group (AppWT ); n=13 per group (AppNL-G-F ). Data are represented as mean ± SEM. Significant differences are determined using two-way ANOVA (**p<0.001; ****p<0.0001). (H) Immunohistochemistry for Iba1+ microglia in the hippocampus of 56 week-old A20FL and A20Cx3Cr1-KO AppWT and AppNL-G-F mice. Scale bars: 100µm (inset: 50 µm). Representative images are displayed. (I) Quantification of the number of GFAP+ astrocytes in the hippocampus of 20 week-old A20FL and A20Cx3Cr1-KO AppWT and AppNL-G-F mice. Each symbol represents one mouse, n=4-5 per group (AppWT ); n=9 per group (AppNL-G-F ). Data are represented as mean ± SEM. Significant differences are determined using two-way ANOVA (***p<0.001). (J) Immunohistochemistry for GFAP+ astrocytes in the hippocampus of 20 week-old A20FL and A20Cx3Cr1-KO AppWT and AppNL-G-F mice. Scale bars: 100µm (inset: 50 µm). Representative images are displayed. (K) Quantification of the number of GFAP+ astrocytes in the hippocampus of 56 week-old A20FL and A20Cx3Cr1-KO AppWT and AppNL-G-F mice. Each symbol represents one mouse, n=4 per group (AppWT ); n=6 per group (AppNL-G-F ). Data are represented as mean ± SEM. (L) Immunohistochemistry for GFAP+ astrocytes in the hippocampus of 56 week-old A20FL and A20Cx3Cr1-KO AppWT and AppNL-G-F mice. Scale bars: 100µm (inset: 50 µm). Representative images are displayed. (M) Quantification of the number of plaque-associated dystrophic neurites (N25+ sAPP+) in whole brains of 20 week-old A20FL and A20Cx3Cr1-KO AppNL-G-F mice. Each symbol represents one mouse, n=8-10 per group. Data are represented as mean ± SEM. (N) Immunohistochemistry for N25+ sAPP+ plaque-associated dystrophic neurites in whole brains of 20-week-old A20FL and A20Cx3Cr1-KO AppNL-G-F mice. Scale bars: 50 µm. Representative images are displayed. (O) Quantification of the number of plaque-associated dystrophic neurites (N25+ sAPP+) in whole brains of 56 week-old A20FL and A20Cx3Cr1-KO AppNL-G-F mice. Each symbol represents one mouse, n=10-14 per group. Data are represented as mean ± SEM. (P) Immunohistochemistry for N25+ sAPP+ plaque-associated dystrophic neurites in whole brains of 56 week-old A20FL and A20Cx3Cr1-KO AppNL-G-F mice. Scale bars: 50 µm. Representative images are displayed. ns, not significant.
Figure 2
Figure 2
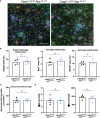
Microglial casp1 deficiency does not suppress AD pathology in AppNL-G-F mice. (A) Quantification of 6E10+ amyloid plaque pathology over whole brains of 20 week-old casp1FL (black) and casp1Cx3Cr1-KO (blue) AppWT and AppNL-G-F mice. Each symbol represents one mouse, n=7-10 (males, dark color; females, pale color). Data are represented as mean ± SEM. Significant differences are determined using two-way ANOVA (*, p < 0.05). (B) Immunohistochemistry for 6E10+ amyloid plaques in hippocampus of 20 week-old casp1FL and casp1Cx3Cr1-KO AppWT and AppNL-G-F mice. Scale bars: 100 µm (inset: 50 µm). Representative images are displayed. (C) Quantification of the number of hippocampal Iba1+ microglia in 20 week-old casp1FL and casp1Cx3Cr1-KO AppWT and AppNL-G-F mice. Each symbol represents one mouse, n=7-13 (AppWT ), n=7-10 (AppNL-G-F ). Data are represented as mean ± SEM. (D) Immunohistochemistry for Iba-1+ microglia in the hippocampus of 20 week-old casp1FL and casp1Cx3Cr1-KO AppWT and AppNL-G-F mice. Scale bars: 100 µm (inset: 50 µm). Representative images are displayed. (E) Quantification of the number of hippocampal GFAP+ astrocytes in 20 week-old casp1FL and casp1Cx3Cr1-KO AppWT and AppNL-G-F mice. Each symbol represents one mouse, n=3-5 per group. Data are represented as mean ± SEM. (F) Immunohistochemistry for GFAP+ astrocytes in the hippocampus of 20 week-old casp1FL and casp1Cx3Cr1-KO AppWT and AppNL-G-F mice. Scale bars: 100 µm (inset: 50 µm). Representative images are displayed. (G) Quantification of the number of plaque-associated dystrophic neurites (N25+ sAPP+) in 20 week-old casp1FL and casp1Cx3Cr1-KO AppNL-G-F mice. Each symbol represents one mouse, n=6-10 per group. Data are represented as mean ± SEM. (H) Immunohistochemistry for N25+ sAPP+ plaque-associated dystrophic neurites in the brain parenchyma of 20 week-old casp1FL and casp1Cx3Cr1-KO AppNL-G-F mice. Scale bars: 50 µm. Representative images are displayed. (I) Quantification of the number of plaque-associated microglia, measured as percentage Iba+ PFTAA colocalization area, in 20 week-old casp1FL and casp1Cx3Cr1-KO AppNL-G-F mice. Each symbol represents one mouse, n=4-6 per group. Data are represented as mean ± SEM. (J) Quantification of 6E10+ amyloid plaque pathology over whole brains of 40 week-old casp1FL (black) and casp1Cx3Cr1-KO AppNL-G-F (blue) mice. Each symbol represents one mouse, n=13-15 per group (males, dark color; females, pale color). Data are represented as mean ± SEM. (K) Immunohistochemistry for 6E10+ amyloid plaque load in hippocampus of 40 week-old casp1FL and casp1Cx3Cr1-KO AppNL-G-F mice. Scale bars: 100 µm (inset: 50µm). Representative images are displayed. (L) Quantification of the number of hippocampal Iba1+ microglia in 40 week-old casp1FL and casp1Cx3Cr1-KO AppNL-G-F mice. Each symbol represents one mouse, n=13-15. Data are represented as mean ± SEM. (M) Immunohistochemistry for Iba-1+ microglia in the hippocampus of 40 week-old casp1FL and casp1Cx3Cr1-KO AppNL-G-F mice. Scale bars: 100 µm (inset: 50µm). Representative images are displayed. (N) Quantification of the number of hippocampal GFAP+ astrocytes in 40 week-old casp1FL and casp1Cx3Cr1-KO AppNL-G-F mice. Each symbol represents one mouse, n=10. Data are represented as mean ± SEM. (O) Immunohistochemistry for GFAP+ astrocytes in hippocampus of 40 week-old casp1FL and casp1Cx3Cr1-KO AppNL-G-F mice. Scale bars: 100 µm (insets 50µm). Representative images are displayed. (P) Quantification of the number of plaque-associated dystrophic neurites (N25+ sAPP+) in 40 week-old casp1FL and casp1Cx3Cr1-KO AppNL-G-F . Each symbol represents one mouse. Data are represented as mean ± SEM. (Q) Immunohistochemistry for N25+ sAPP+ dystrophic neurites in brain parenchyma of 40 week-old casp1FL and casp1Cx3Cr1-KO AppNL-G-F mice. Scale bars: 50 µm. Representative images are displayed. (R) Quantification of 6E10+ amyloid plaque pathology over whole brains of 70 week-old casp1FL (black) and casp1Cx3Cr1-KO (blue) AppNL-G-F mice. Each symbol represents one mouse, n=5-6 (males, dark color; females, pale color). Data are represented as mean ± SEM. ns, not significant.
Figure 3
Figure 3
Full-body casp1/11 deficiency does not suppress AD pathology in 12 month-old AppNL-G-F mice. (A) Amyloid deposition and neuroinflammation was detected by triple staining of 12-month-old casp1/11WT and casp1/11KO AppNL-G-F mice using 82E1 (blue), anti-Iba1 antibody (red) and anti-GFAP antibody (green) as markers of Aβ plaque, astrocytosis and microgliosis, respectively. Scale bars represent 100 µm. (B) Quantification of 82E1+ amyloid plaque load, Iba1+ microgliosis, and GFAP+ astrocytosis over whole brains of casp1/11WT and casp1/11KO AppNL-G-F mice (all females). Data are represented as mean ± SEM. (C) Quantification of the number of plaque-associated microglia in casp1/11WT and casp1/11KO AppNL-G-F mice. Each symbol represents one mouse. Data are represented as mean ± SEM. (D) Biochemical quantification of Aβ40 and Aβ42 in the GuHCl fractions of cortical tissue from 12-month-old mouse brains from casp1/11WT and casp1/11KO AppNL-G-F mice, quantified by sandwich ELISA. Each symbol is one mouse (all females), n=4 per group. Data represent mean ± SEM. ns, not significant.
Figure 4
Figure 4
Microglial casp1 deficiency does not suppress AD pathology in APP/PS1 mice. (A) Quantification of 6E10+ amyloid plaque pathology over whole brains of 20 week-old casp1FL (black) and casp1Cx3Cr1-KO (blue) AppWT and APP/PS1. Each symbol represents one mouse, n=7-10 (AppWT ), n=10-12 (APP/PS1) (males, dark color; females, pale color). Data are represented as mean ± SEM. Significant differences are determined using two-way ANOVA (****p < 0.0001). (B) Immunohistochemistry for 6E10+ amyloid plaques in hippocampus of 20 week-old casp1FL and casp1Cx3Cr1-KO AppWT and APP/PS1 mice. Scale bars: 100 µm (inset: 50 µm). Representative images are displayed. (C) Quantification of the number of hippocampal Iba1+ microglia in of 20 week-old casp1FL and casp1Cx3Cr1-KO AppWT and APP/PS1. Each symbol represents one mouse, n=7-13 (AppWT ), n=11-14 (APP/PS1). Data are represented as mean ± SEM. Significant differences are determined through two-way ANOVA (*p < 0.05; ***p < 0.001). (D) Immunohistochemistry for Iba-1+ microglia in the hippocampus of 20 week-old casp1FL and casp1Cx3Cr1-KO AppWT and APP/PS1. Scale bars: 100 µm (inset: 50 µm). Representative images are displayed. (E) Quantification of the number of hippocampal GFAP+ astrocytes in of 20 week-old casp1FL and casp1Cx3Cr1-KO AppWT and APP/PS1. Each symbol represents one mouse, n=3-5 per group (AppWT ), n=7-11 (APP/PS1). Data are represented as mean ± SEM. (F) Immunohistochemistry for GFAP+ astrocytes in the hippocampus of 20 week-old casp1FL and casp1Cx3Cr1-KO AppWT and APP/PS1 mice. Scale bars: 100 µm (inset: 50 µm). Representative images are displayed. (G) Mean GuHCl-extractable Aβ42 levels in cortical brain tissue of 20 week-old casp1FL and casp1Cx3Cr1-KO APP/PS1 mice. Each symbol represents one mouse, n=9-10 per group. Data are represented as mean ± SEM. (H) Quantification of the number of plaque-associated dystrophic neurites (N25+ sAPP+) in of 20 week-old casp1FL and casp1Cx3Cr1-KO APP/PS1 mice. Each symbol represents one mouse, n=7-10 per group. Data are represented as mean ± SEM. (I) Immunohistochemistry for N25+ sAPP+ plaque-associated dystrophic neurites in the brain parenchyma of 20 week-old casp1FL and casp1Cx3Cr1-KO APP/PS1 mice. Scale bars: 50 µm. Representative images are displayed. (J) Quantification of the number of plaque-associated microglia, measured as percentage Iba+ PFTAA colocalization area, in 20 week-old casp1FL and casp1Cx3Cr1-KO APP/PS1 mice. Each symbol represents one mouse, n=6 per group. Data are represented as mean ± SEM. (K) Quantification of 6E10+ amyloid plaque pathology over whole brains of 70 week-old casp1FL (black) and casp1Cx3Cr1-KO (blue) APP/PS1 mice. Each symbol represents one mouse, n=6-9 (APP/PS1) (males, dark color; females, pale color). Data are represented as mean ± SEM. ns, not significant.
Figure 5
Figure 5
Full-body Nlrp3 deficiency does not suppress AD pathology in APP/PS1 mice. (A) Quantification of 4G8+ amyloid plaque load in the hippocampus of 4-months old Nlrp3WT and Nlrp3KO APP/PS1 mice. Each symbol represents one mouse. Data are represented as mean ± SEM. (B) Immunohistochemistry for 4G8+ amyloid plaque load in hippocampus of 4 month-old Nlrp3WT and Nlrp3KO APP/PS1 mice. Scale bars: 500 µm (inset: 50µm). Representative images are displayed. (C) Quantification of 4G8+ amyloid plaque load in the hippocampus of 6-months old Nlrp3WT and Nlrp3KO APP/PS1 mice. Each symbol represents one mouse. Data are represented as mean ± SEM. (D) Immunohistochemistry for 4G8+ amyloid plaque load in hippocampus of 6 month-old Nlrp3WT and Nlrp3KO APP/PS1 mice. Scale bars: 500 µm (inset: 50µm). Representative images are displayed. (E) Quantification of 4G8+ amyloid plaque load in the hippocampus of 10-months old Nlrp3WT and Nlrp3KO APP/PS1 mice. Each symbol represents one mouse. Data are represented as mean ± SEM. (F) Immunohistochemistry for 4G8+ amyloid plaque load in hippocampus of 10 month-old Nlrp3WT and Nlrp3KO APP/PS1 mice. Scale bars: 500 µm (inset: 50µm). Representative images are displayed. (G) Quantification of the number of hippocampal Iba1+ microglia in 4 month-old Nlrp3WT and Nlrp3KO APP/PS1 mice. Each symbol represents one mouse, n=14-23 per group. Data are represented as mean ± SEM. Significant differences are determined with One-way-ANOVA using Sidak’s multiple comparisons test (*p < 0.05; **p < 0.01). (H) Immunohistochemistry for Iba-1+ microglia in the hippocampus of 4 month-old Nlrp3WT and Nlrp3KO APP/PS1 mice. Scale bars: 500 µm (inset: 50µm). Representative images are displayed. (I) Quantification of the number of hippocampal Iba1+ microglia in 6 month-old Nlrp3WT and Nlrp3KO APP/PS1 mice. Each symbol represents one mouse, n=14-23 per group. Data are represented as mean ± SEM. Significant differences are determined with One-way-ANOVA using Sidak’s multiple comparisons test (*p < 0.05). (J) Immunohistochemistry for Iba-1+ microglia in the hippocampus of 6 month-old Nlrp3WT and Nlrp3KO APP/PS1 mice. Scale bars: 500 µm (inset: 50µm). Representative images are displayed. (K) Quantification of the number of hippocampal Iba1+ microglia in 10 month-old Nlrp3WT and Nlrp3KO APP/PS1 mice. Each symbol represents one mouse, n=14-23 per group. Data are represented as mean ± SEM. Significant differences are determined with One-way-ANOVA using Sidak’s multiple comparisons test (****p < 0.0001). (L) Immunohistochemistry for Iba-1+ microglia in the hippocampus of 10 month-old Nlrp3WT and Nlrp3KO APP/PS1 mice. Scale bars: 500 µm (inset: 50µm). Representative images are displayed. (M) Quantification of the number of plaque-associated dystrophic neurites (N25+ sAPP+) in the brain of 4-months old Nlrp3WT and Nlrp3KO APP/PS1 mice. Each symbol represents one mouse, n=14-23 per group. Data are represented as mean ± SEM. (N) Immunofluorescence staining for N/25 and sAPP in 4 months-old Nlrp3WT and Nlrp3KO APP/PS1 mice. Scale bars: 50µm. Representative images are displayed. (O) Quantification of the number of plaque-associated dystrophic neurites (N25+ sAPP+) in the brain of 6-months old Nlrp3WT and Nlrp3KO APP/PS1 mice. Each symbol represents one mouse, n=14-23 per group. Data are represented as mean ± SEM. (P) Immunofluorescence staining for N/25 and sAPP in 6 months-old Nlrp3WT and Nlrp3KO APP/PS1 mice. Scale bars: 50µm. Representative images are displayed. (Q) Quantification of the number of plaque-associated dystrophic neurites (N25+ sAPP+) in the brain of 10-months old Nlrp3WT and Nlrp3KO APP/PS1 mice. Each symbol represents one mouse, n=14-23 per group. Data are represented as mean ± SEM. (R) Immunofluorescence staining for N/25 and sAPP in 10 months-old Nlrp3WT and Nlrp3KO APP/PS1 mice. Scale bars: 50µm. Representative images are displayed. ns, not significant.
Figure 6
Figure 6
Nlrp3 signaling does not shape microglial activation during homeostasis or upon amyloid pathology in APP/PS1 mice. (A) UMAP plot of 40547 microglia cells from whole brain tissue of Nlrp3 +/+ mice (3, 6 and 9 months old), Nlrp3 -/- mice (3, 6 and 9 months old), Nlrp3 +/+ APP/PS1 (3 and 9 months old) and Nlrp3 -/- APP/PS1 (3 and 9 months old). (B) Dot plot, showing the expression of key marker genes per cluster in the dataset from (a) The size of the dot represents the percentage of cells within a cluster that express the gene, while the color encodes the mean scaled gene expression level per cluster. (C) UMAP plot of microglia from Nlrp3 +/+ APP/PS1 and Nlrp3 -/- APP/PS1 mice, split by genotype and age. (D) Pie charts visualizing the percentage of cells per cluster in each genotype and age group from (c) E. Violin plot, comparing the expression level of the Nlrp3 gene in the microglia from the four distinct genotypes (all age groups). (F) Volcano plot, showing differentially expressed genes between microglia (all clusters combined) from Nlrp3 -/- APP/PS1 vs Nlrp3 +/+ APP/PS1 mice (9 months old). In red are shown the genes with adj P<0.05 and abs(log2FC)>1. (G) Volcano plot, showing differentially expressed genes between DAMs from Nlrp3 -/- APP/PS1 vs Nlrp3 +/+ APP/PS1 mice (9 months old). In red are shown the genes with adj P<0.05 and abs(log2FC)>1. HM, homeostatic microglia; IRM, Interferon response microglia; TM, transitory microglia; DAM, disease-associated microglia; IEG, immediate early genes response microglia; PM, proliferating microglia.

References

    1. Ramanan VK, Saykin AJ. Pathways to neurodegeneration: mechanistic insights from GWAS in Alzheimer's disease, Parkinson's disease, and related disorders. Am J Neurodegener Dis (2013) 2:145–75. - PMC - PubMed
    1. Scheltens P, Blennow K, Breteler MM, De Strooper B, Frisoni GB, Salloway S, et al. Alzheimer's disease. Lancet (2016) 388:505–17. doi: 10.1016/S0140-6736(15)01124-1 - DOI - PubMed
    1. Ransohoff RM. How neuroinflammation contributes to neurodegeneration. Science (2016) 353:777–83. doi: 10.1126/science.aag2590 - DOI - PubMed
    1. Lawson LJ, Perry VH, Dri P, Gordon S. Heterogeneity in the distribution and morphology of microglia in the normal adult mouse brain. Neuroscience (1990) 39:151–70. doi: 10.1016/0306-4522(90)90229-W - DOI - PubMed
    1. Prinz M, Jung S, Priller J. Microglia biology: one century of evolving concepts. Cell (2019) 179:292–311. doi: 10.1016/j.cell.2019.08.053 - DOI - PubMed

Publication types