. 2024 Jan 26:15:1258475.
doi: 10.3389/fimmu.2024.1258475. eCollection 2024.

Construction of disulfidptosis-based immune response prediction model with artificial intelligence and validation of the pivotal grouping oncogene c-MET in regulating T cell exhaustion

Affiliations

Construction of disulfidptosis-based immune response prediction model with artificial intelligence and validation of the pivotal grouping oncogene c-MET in regulating T cell exhaustion

Pengping Li et al. Front Immunol. .

Abstract

Background: Given the lack of research on disulfidptosis, our study aimed to dissect its role in pan-cancer and explore the crosstalk between disulfidptosis and cancer immunity.

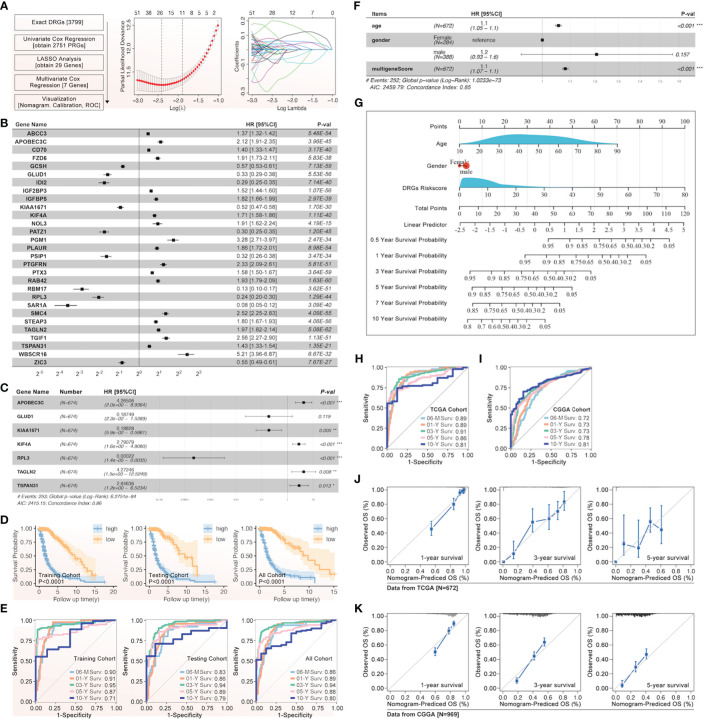
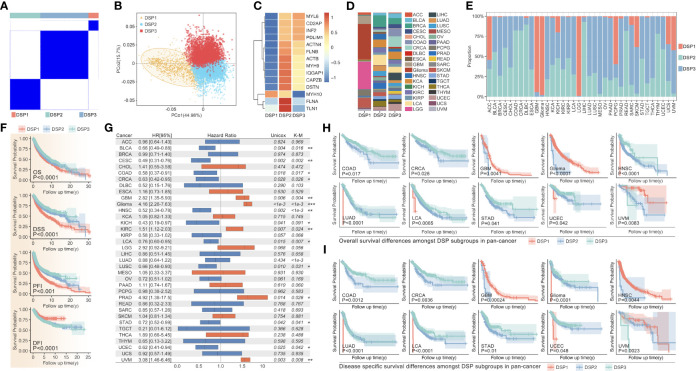
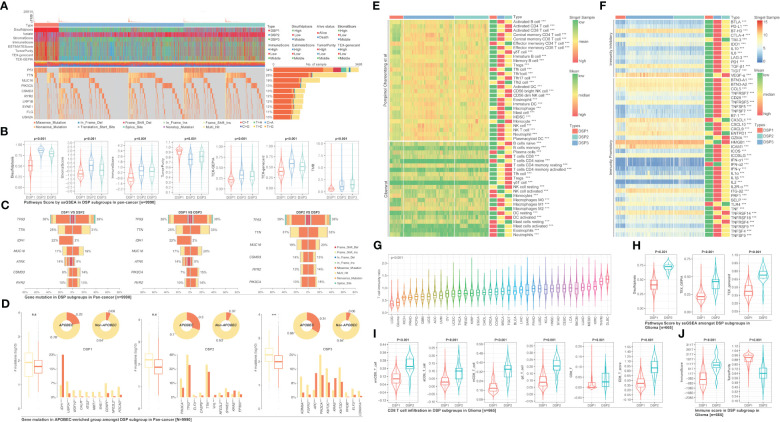
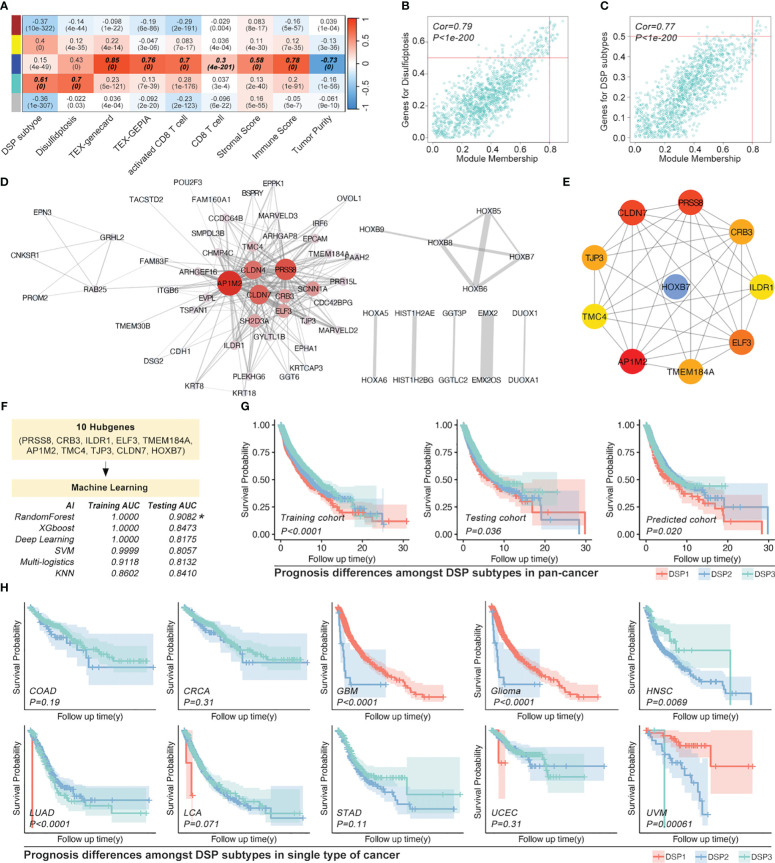
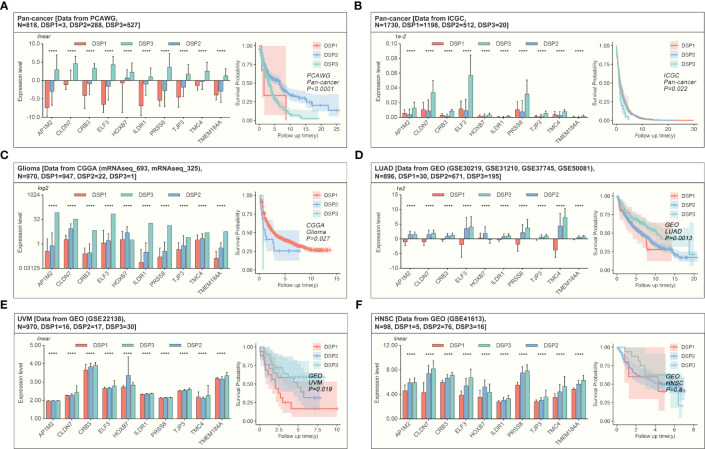
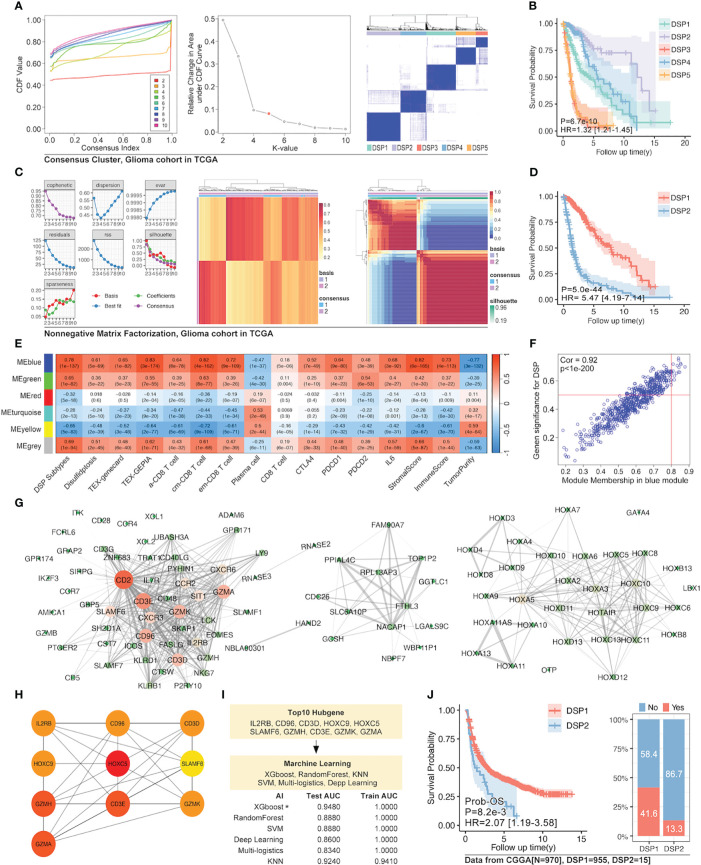
Methods: Based on TCGA, ICGC, CGGA, GSE30219, GSE31210, GSE37745, GSE50081, GSE22138, GSE41613, univariate Cox regression, LASSO regression, and multivariate Cox regression were used to construct the rough gene signature based on disulfidptosis for each type of cancer. SsGSEA and Cibersort, followed by correlation analysis, were harnessed to explore the linkage between disulfidptosis and cancer immunity. Weighted correlation network analysis (WGCNA) and Machine learning were utilized to make a refined prognosis model for pan-cancer. In particular, a customized, enhanced prognosis model was made for glioma. The siRNA transfection, FACS, ELISA, etc., were employed to validate the function of c-MET.

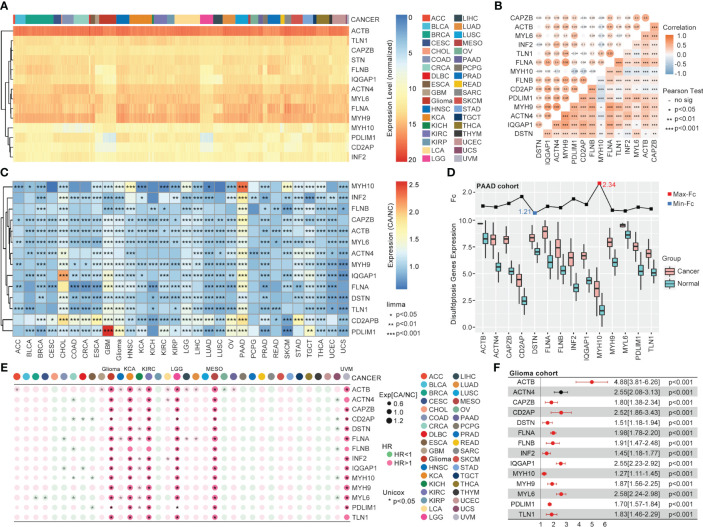
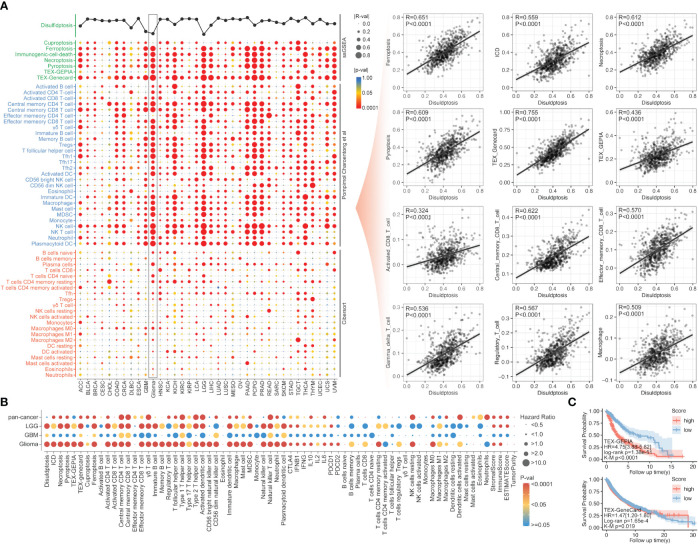
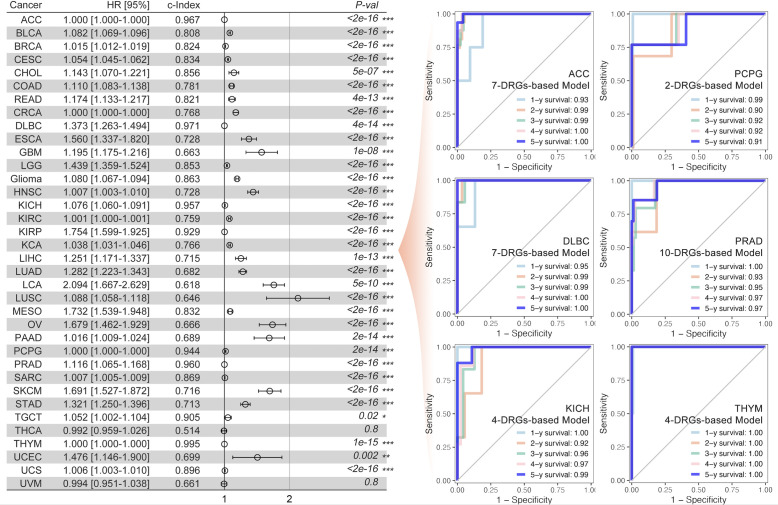
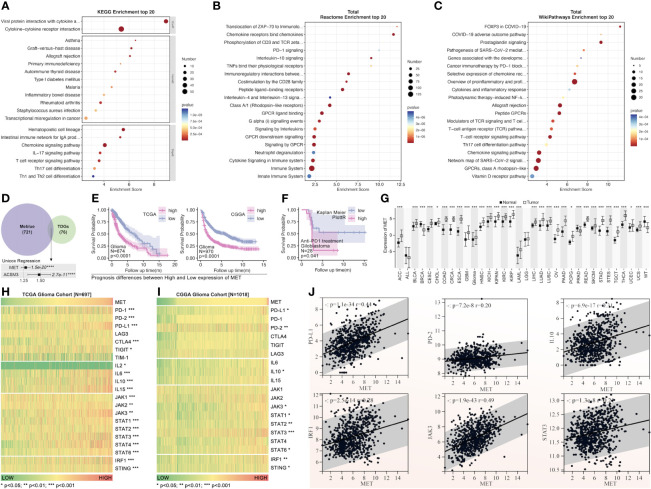
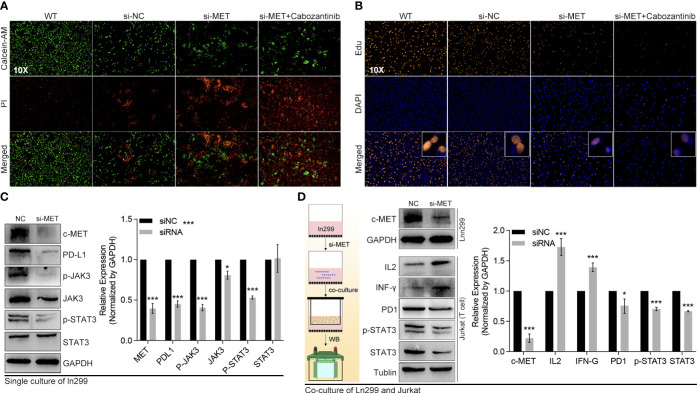
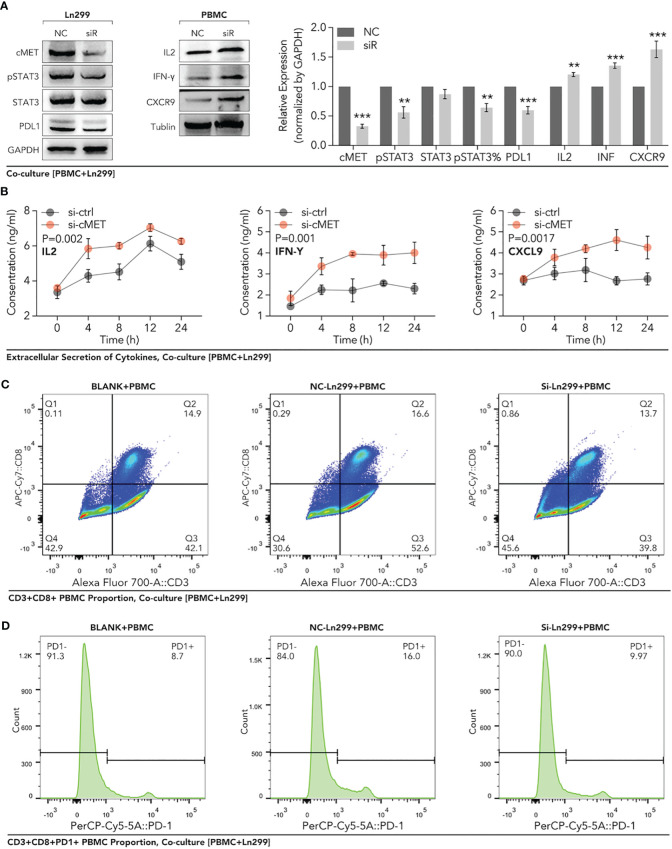
Results: The expression comparison of the disulfidptosis-related genes (DRGs) between tumor and nontumor tissues implied a significant difference in most cancers. The correlation between disulfidptosis and immune cell infiltration, including T cell exhaustion (Tex), was evident, especially in glioma. The 7-gene signature was constructed as the rough model for the glioma prognosis. A pan-cancer suitable DSP clustering was made and validated to predict the prognosis. Furthermore, two DSP groups were defined by machine learning to predict the survival and immune therapy response in glioma, which was validated in CGGA. PD-L1 and other immune pathways were highly enriched in the core blue gene module from WGCNA. Among them, c-MET was validated as a tumor driver gene and JAK3-STAT3-PD-L1/PD1 regulator in glioma and T cells. Specifically, the down-regulation of c-MET decreased the proportion of PD1+ CD8+ T cells.

Conclusion: To summarize, we dissected the roles of DRGs in the prognosis and their relationship with immunity in pan-cancer. A general prognosis model based on machine learning was constructed for pan-cancer and validated by external datasets with a consistent result. In particular, a survival-predicting model was made specifically for patients with glioma to predict its survival and immune response to ICIs. C-MET was screened and validated for its tumor driver gene and immune regulation function (inducing t-cell exhaustion) in glioma.

Keywords: artificial intelligence (AI); disulfidptosis; glioma; prognosis prediction; tumor immunity.


Conflict of interest statement

The authors declare that the research was conducted in the absence of any commercial or financial relationships that could be construed as a potential conflict of interest.

Figures

Figure 1
Figure 1
The pan-cancer landscape of DRGs. (A) The expression of 14 validated DRGs in all types (36) of cancer from TCGA. (B) The expression correlation analysis of DRGs, in which no significance of correlation was observed between MYH9 and MYH10, DSTN and TLN1, CD2AP and MYL6, IQGAP1 and MYL6, DSTN and ACTB. (C) The expression difference of DRGs between tumor samples (TCGA) and non-tumor samples (para tumor from TCGA + normal tissues from GTEx) in each type of cancer, expression difference existed in all DRGs in GBM, PAAD, PRAD, and TGCT. (D) The expression comparison between glioma tissues from TCGA and normal brain tissues from GTEx. (E) Univariate Cox regression analysis of DRGs in each type of cancer. (F) Univariate Cox regression analysis of DRGs in glioma, in which all DRGs were risk factors in glioma (HR>1, P<0.001).
Figure 2
Figure 2
The correlation of immunity and other PCDs with disulfidptosis. (A) The correlation analysis between disulfidptosis and immune cell infiltration/other PCDs, in which disulfidptosis score was positively correlated with PCDs, including ferroptosis, ICD, necroptosis, and pyroptosis, and disulfidptosis was positive correlated with TEX, CD8+ T cells. (B) The univariate Cox regression of disulfidptosis, immune cell infiltration, and other PCDs in glioma, LGG, GBM, and pan-cancer. (C) The Kaplan–Meier survival analysis of Tex_GEPIA and Tex_GeneCard in pan-cancer, a higher score of both parameters was accompanied by worse prognosis in glioma (p<0.0001) evaluated by K-M analysis or unicox regression analysis.
Figure 3
Figure 3
DRGs-based prognosis model and ROC curve. The DRGs-based gene signature for prognosis was constructed for each type of cancer (the left part), and the multi-gene-based model index was greater than 0.9 in ACC, DLBC, KICH, KIRP, PCPG, THYM, and TGCT. Multi-gene-based models for all cancer types were significantly constructed. The 1-year, 2-year, 3-year, 4-year, and 5-year ROC curve of the abovementioned gene signature was made for patients with ACC, PCPG, DLBC, PRAD, KICH, and THYM, respectively (the right part). * p<0.05, **p<0.01, ***p<0.001.
Figure 4
Figure 4
The gene signature of prognosis based on DRGs in glioma. (A) The flow chart and the LASSO regression results were listed, after which 29 genes were screened out, and (B) their effect on the prognosis of glioma was evaluated by univariate Cox, attached with HR and p-value. (C) The gene signature of glioma prognosis was made by multivariate Cox regression, in which APOBEC3C, GLUD1, KIAA1671, KIF4A, RPL3, TAGLN2, and TSPAN31 were input into the model. (D) The Kaplan–Meier curves were made in the training, testing, and all glioma cohorts from TCGA, and all displayed a similar result that a higher risk score was accompanied by a worse prognosis in glioma. (E) The ROC curves of 0.5-year, 1-year, 3-year, 5-year, and 10-year were presented in the training, testing, and all glioma cohorts from TCGA. (F) The gene signature based on DRGs and clinical characteristics for glioma were shown with HR value, in which age, gender, and multi-gene-based risk score were input into the model. (G) The glioma nomogram of gene signature based on DRGs and clinical characteristics. The glioma ROC curve of gene signature based on DRGs and clinical characteristics in TCGA (H) and CGGA (I). The glioma nomogram prediction of gene signature based on DRGs and clinical characteristics in TCGA (J) and CGGA (K). *p<0.05, **p<0.01, ***p<0.001.
Figure 5
Figure 5
DRGs-based clustering and prognosis analysis in pan-cancer. (A) The unsupervised clustering of DRGs in pan-cancer based on the 14 DRGs (MYL6, CD2AP, INF2, PDLIM1, ACTN4, FLNB, ACTB, MYH9, IQGAP1, CAPZB, DSTN, MYH10, FLNA, TLN1). (B) PCA analysis shows the sample distribution amongst subgroups (DSP1, DSP2, DSP3). (C) DRGs expression profile feature in subgroups. (D) Tumor sample distribution amongst subgroups. (E) Subgroup distribution proportion in 36 kinds of cancer. (F) OS, DSS, PFI, and DFI analysis among different DSP groups in pan-cancer were all significant (p<0.001). (G) The univariate Cox regression (OS) of DSP clusters in every type of cancer from TCGA, in which significance was observed in BLCA, CESC, COAD, CRCA, Glioma, HNSC, KICH, KIRC, LCA, LUAD, LUSC, PRAD, STAD, UCEC and UVM. OS analysis (H) and DSS analysis (I) in COAD, CRCA, GBM, glioma, HNSC, LUAD, LCA, STAD, and UCEC. * p<0.05, **p<0.01, ***p<0.001.
Figure 6
Figure 6
Gene mutation comparison among DSP groups in pan-cancer. (A) Gene mutation landscape among DSP groups in pan-cancer. (B) Pathways score in DSP groups in pan-cancer. (C) Mutation comparison between every two DSP groups. (D) Mutation comparison between APOBEC-enriched and non-APOBEC-enriched patients in each DSP group. Immune cell infiltration (E) Immune cell infiltration in DSP group, (F) Immunocheck points expression in DSP groups. (G) Immune score status in 36 types of cancer. (H) Disulfidptosis score, TEX_GEPIA, and TEX_gencard were higher in DSP2 in glioma (p<0.001). (I) Various types of CD8+ T cells infiltration differences in DSP groups in glioma (p<0.001). (J) Immune score and tumor purity differences in DSP groups in glioma (p<0.001). **p<0.01, ***p<0.001; ns, significant.
Figure 7
Figure 7
Refined prognostic model construction in pan-cancer by WGCNA and Machine learning. (A) Gene modules correlated with DSP pathways and immune cell infiltration by WGCNA, in which (B, C) module gene cohorts were most linked with DSP grouping and disulfidptosis (Cor=0.79, p<1e-200), while deep blue module gene cohorts were most correlated with immune cell infiltration (Cor=0.77, p<1e-200). (D) Gene interaction network about top 50 DSP grouping related genes in cyan module gene cohorts (E) Hub genes of the cyan gene module. (F) Refined prognostic model construction based on pan-cancer by supervised machine learning, in which random forest algorithm displayed as the most efficient (Training AUC=0.9082). (G) K-M analysis indicated the prognosis differences amongst DSP groups in the training cohort, testing cohort (original groups), and predicted group (AI-identified group using test cohort data). (H) Refined prognostic model performance in the OS analysis of COAD, CRCA, GBM, glioma, HNSC, LUAD, LCA, STAD, and UCEC.
Figure 8
Figure 8
Validation of the refined prognostic model in external datasets. Expression of DRGs and validation of the refined prognostic model in pan-cancer from (A, B) PCAWG (p<0.0001) or ICGC (p=0.022), both of them showed significant prognosis differences in AI-identified DSP subgroups. (C) The Glioma cohort from CGGA manifested significant prognosis differences amongst AI-identified DSP groups (p=0.027). (D), LUAD from GEO datasets (GSE30219, GSE31210, GSE37745, GSE50081) presented significant prognosis differences amongst AI-identified DSP groups (p=0.0013), (E) UVM from GSE22138 showed significant prognosis difference amongst AI-identified DSP groups (p=0.019) (F) HNSC from GSE41613 (exhibited insignificant prognosis difference amongst AI-identified DSP groups (p=0.8). ****p<0.0001.
Figure 9
Figure 9
Enhanced prognostic model in glioma by WGCNA and machine learning. (A) Unsupervised consensus clustering of 14 validated DRGs (B) and its survival analysis in the glioma cohort, which displayed a significant difference in prognosis (p=6.7e-10). (C) The clustering of 14 validated DRGs by Non-negative Matrix Factorization (NMF) divided the glioma cohort into two groups with (D) significantly different prognoses (p=5e-44). (E) WGCNA for NMF clustering DSP groups, in which blue module gene cohort was the most correlated to DSP grouping, immune cell infiltration, and immunecheckpoint expression (p<0.0001). (F) The correlation analysis of the blue gene module from WGCNA and DSP subtypes. The blue gene module (G) and its hub genes (H) network. (I) Enhanced prognostic model based on hub genes for patients with glioma by machine learning, among which the xgboost algorithm showed the best accuracy (testing AUC=0.9480). (J) The validation of the enhanced prognostic model in glioma patients from CGGA by KM analysis and immune checkpoint inhibitors response prediction (p<0.001).
Figure 10
Figure 10
The pathway enrichment and tumor driver genes analysis from the blue gene module. Pathway enrichment of blue gene module by KEGG (A), Reactome (B), and WikiPathways (C). (D) The tumor driver genes’ extraction from the blue module. (E) The c-MET survival analysis of patients with glioma from TCGA and CGGA (HR>1.25, p=1.5e-20). (F) The c-MET prognosis analysis was validated in the glioblastoma cohort receiving anti-PD1 treatment from “Kaplan-Meier Plotter” (http://kmplot.com/analysis/index). (G) The expression of c-MET in pan-cancer and non-tumor tissues(data from TCGA and GTEx). The immune markers expression was based on the c-MET expression in the glioma cohort from TCGA (H) and CGGA (I). (J) The expression correlation analysis between different immune markers (PDL1, PD2, IL10, IRF1, JAK3, STAT3) and c-MET in the glioma cohort from TCGA. *p<0.05, **p<0.01, ***p<0.001, ****p<0.0001
Figure 11
Figure 11
C-MET was a tumor driver gene and could inhibit the JAK3-STAT3 pathway. (A) The live and dead cell staining by Calcein and PI, in which siRNA-c-MET treatment increases the dead cell proportion induced by cabozantinib treatment. (B) The Edu and DAPI staining of the ln299 cell line. (C) The protein expression alteration after c-MET knockdown in the ln299 cell line, in which PDL1, p-JAK3, JAK3, and pSTAT3 were down-regulated, while (D) the expression of IL2 and IFN-γ were up-regulated in the Jurkat cell line in co-culture system. *p<0.05, ***p<0.001.
Figure 12
Figure 12
Down-regulation of c-MET within glioma enhanced the PBMC-derived CD8+ T cell function and proportion in the co-culture system. Glioma cell line Ln299 cells were treated with c-MET siRNA for 24h and co-cultured with PBMC for another 24h. (A) WB was used to detect the relevant protein expression in Ln299 and PBMC, in which PDL1, STAT3, pSTAT3, and pSTAT3 were down-regulated in Ln299. At the same time, IL2, IFN-γ, and CXCR9 were up-regulated in PBMC. (B) ELISA was applied to detect extracellular protein levels in the co-culture system, in which IL2, IFN-γ, and CXCL9 were higher in the si-c-MET group than those in the NC group. (C) The proportion of PD1+ PBMC was decreased by the down-regulation of c-MET in ln299 a little. (D) PD1+ CD3+CD8+ T cells were reduced evidently in the si-c-MET group than those in the NC group. **p<0.01, ***p<0.001.

Similar articles

References

    1. Tang D, Kang R, Berghe TV, Vandenabeele P, Kroemer G. The molecular machinery of regulated cell death. Cell Res (2019) 29:347–64. doi: 10.1038/s41422-019-0164-5 - DOI - PMC - PubMed
    1. Peng F, Liao M, Qin R, Zhu S, Peng C, Fu L, et al. . Regulated cell death (RCD) in cancer: key pathways and targeted therapies. Signal Transduct Target Ther (2022) 7:286. doi: 10.1038/s41392-022-01110-y - DOI - PMC - PubMed
    1. Kerr JF, Wyllie AH, Currie AR. Apoptosis: a basic biological phenomenon with wide-ranging implications in tissue kinetics. Br J Cancer (1972) 26:239–57. doi: 10.1038/bjc.1972.33 - DOI - PMC - PubMed
    1. Paweletz N. Walther Flemming: pioneer of mitosis research. Nat Rev Mol Cell Biol (2001) 2:72–5. doi: 10.1038/35048077 - DOI - PubMed
    1. Kerr JF. History of the events leading to the formulation of the apoptosis concept. Toxicology (2002) 181-182:471–4. doi: 10.1016/S0300-483X(02)00457-2 - DOI - PubMed

Publication types