. 2024 May;11(17):e2306622.
doi: 10.1002/advs.202306622. Epub 2024 Feb 14.

Modulation of Cerebrospinal Fluid Dysregulation via a SPAK and OSR1 Targeted Framework Nucleic Acid in Hydrocephalus

Affiliations

Modulation of Cerebrospinal Fluid Dysregulation via a SPAK and OSR1 Targeted Framework Nucleic Acid in Hydrocephalus

Qiguang Wang et al. Adv Sci (Weinh). 2024 May.

Abstract

Hydrocephalus is one of the most common brain disorders and a life-long incurable condition. An empirical "one-size-fits-all" approach of cerebrospinal fluid (CSF) shunting remains the mainstay of hydrocephalus treatment and effective pharmacotherapy options are currently lacking. Macrophage-mediated ChP inflammation and CSF hypersecretion have recently been identified as a significant discovery in the pathogenesis of hydrocephalus. In this study, a pioneering DNA nano-drug (TSOs) is developed by modifying S2 ssDNA and S4 ssDNA with SPAK ASO and OSR1 ASO in tetrahedral framework nucleic acids (tFNAs) and synthesis via a one-pot annealing procedure. This construct can significantly knockdown the expression of SPAK and OSR1, along with their downstream ion channel proteins in ChP epithelial cells, thereby leading to a decrease in CSF secretion. Moreover, these findings indicate that TSOs effectively inhibit the M0 to M1 phenotypic switch of ChP macrophages via the MAPK pathways, thus mitigating the cytokine storm. In in vivo post-hemorrhagic hydrocephalus (PHH) models, TSOs significantly reduce CSF secretion rates, alleviate ChP inflammation, and prevent the onset of hydrocephalus. These compelling results highlight the potential of TSOs as a promising therapeutic option for managing hydrocephalus, with significant applications in the future.

Keywords: DNA nanomaterials; cerebrospinal fluid hypersecretion; choroid plexus; cytokines; hydrocephalus; macrophages.


Conflict of interest statement

The authors declare no competing interests.

Figures

Scheme 1
Scheme 1
TSOs inhibit CSF hypersecretion by downregulating SPAK and OSR1 in ChP epithelial cells and inhibiting the phenotypic switch of ChP macrophages from M0 to M1 through MAPK signaling pathways, thus preventing hydrocephalus formation.
Figure 1
Figure 1
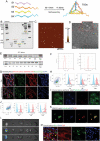
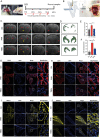
Synthesis, characteristics, and uptake of TSOs. A) Schematic diagram of TSO fabrication. B) 8% PAGE verified the successful synthesis of TSOs. C) AFM images of the molecular structure of TSOs. Scale bars: 400 nm. D) TEM images of the molecular structure of TSOs. Scale bar: 100 nm. E) Serum and storage stability of TSOs. F) The zeta potentials and hydrodynamic sizes of TSO measured by DLS. G) Immunofluorescence showing the increased IBA1+ macrophage accumulation at the surface of choroid plexus epithelial cells in rat PHH models. H) Flow cytometry to see the uptake of TSOs in primary choroid plexus epithelial cells. I) The uptake of TSOs by primary choroid plexus epithelial cells at 6 h. Scale bar: 10 µm. J) Flow cytometry to assess the uptake of TSOs in rat macrophages NR8383 cells. K) The uptake of TSOs in NR8383 cells. Scale bar: 20 µm. L) After intraventricular injection, in vivo imaging showed the majority of TSOs remained within the cerebrospinal fluid distribution region for at least 8 h. M) Cy5 signal intensities, upon intraventricular injection, were observed in IBA1‐positive epiplexus macrophages (red arrow) and choroid plexus epithelial cells (yellow arrow).
Figure 2
Figure 2
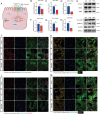
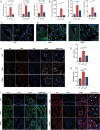
TSOs significantly downregulate the expression of SPAK, OSR1, NKCC1, and pNKCC1 in primary choroid plexus epithelial cells. A) Schematic illustration of the function of TSOs in primary choroid plexus epithelial cells. B–D) The mRNA expression level of B) SPAK, C) OSR1, and D) their downstream NKCC1 in primary ChP epithelial cells after TSOs treatment. E) Western blot results showing changes of SPAK and OSR1, after TSOs treatment. F–H) QPCR showing TSOs downregulate the downstream ion channel related to CSF secretion F) ATP1A1, G) KCNJ13, and H) CLIC6, data are presented as mean ± SD (n = 3). *p < 0.05, **p < 0.01, ***p < 0.001. I) Western blot results showing changes in NKCC1 and pNKCC1 expression levels after TSO treatment. J–M) Immunofluorescence images showed the J) SPAK, K) OSR1, L) NKCC1, and M) pNKCC1 expression reduced after TSO treatment. Scale bar: 20 µm.
Figure 3
Figure 3
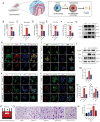
TSOs inhibit the M0 to M1 phenotypic switch of macrophages and suppress the inflammatory cytokines. A) Schematic diagram of TSOs inhibiting M0 to M1 phenotypic switch of macrophages. QPCR showing TSOs downregulated B) CD40, C) CD86, D) iNOS, E) CCL2, and F) TNF‐α, *p < 0.05, **p < 0.01, ***p < 0.001, ****p < 0.0001. G) Western blot detecting the expressions of CD86, CCL2, and CD206. H) Expression of CD86 under IF microscopy. I) IF staining of iNOS in NR8383 after LPS and TSO treatment. J) Western blot detecting the expressions of iNOS, pNF‐κB, TNF‐α, and IL‐10. K,L) Expression of K) CCL2 and L) TNF‐α after LPS and TSO treatment under IF microscopy. M–O) ELISA detecting the content of M) TNF‐α, N) IL‐1β, and O) CCL2 in NR8383 culture, *p < 0.05, **p < 0.01, ***p < 0.001, ****p < 0.0001. P) Schematic diagram of 2D‐transwell experiment. Q) Images of transwell see the vertical migrating ability of NR8383 in the co‐culture system at 24 h. R) The migration of NR8383 was quantitatively analyzed, *p < 0.05, **p < 0.01, ***p < 0.001. Data are presented as mean ± SD (n = 3).
Figure 4
Figure 4
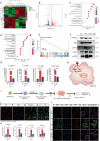
RNA‐sequencing reveals that TSOs inhibit macrophage polarization through the MAPK signaling pathway. A) Heat map showing the differentially expressed genes in the NR8383 cells treated with LPS and TSOs. B) Volcano plots showing DEGs. C) GO biological process analysis of differentially expressed genes. D) The KEGG pathways analysis showing the differentially expressed genes were primarily associated with the cytokine‐cytokine receptor interaction and MAPK signaling pathway. E) GSEA showed a significant decrease of MAPK pathways gene enriched. F) Western blot showing the protein levels of P38, p‐P38, ERK, and p‐ERK. G) QPCR showing that TSOs inhibited various proinflammatory cytokines in NR8383 cells, *p < 0.05, **p < 0.01, ***p < 0.001, ****p < 0.0001. H) Schematic diagram of the mechanism of TSOs in inhibiting macrophage polarization. I) The potential effect of TSOs on BM‐derived macrophage polarization upon LPS stimulation. J) The uptake of TSOs by BM‐derived macrophages at 6 h. Scale bar: 10 µm. K) QPCR showing TSOs downregulated CD86, IL‐1β, CCL2, and TNF‐α in BM‐derived macrophages,**p < 0.01, ***p < 0.001, ****p < 0.0001. F) IF staining of CD86 and F4/80 in BM‐derived macrophages after LPS and TSO treatments. Scale bar: 10 µm. Data are presented as mean ± SD (n = 3).
Figure 5
Figure 5
TSOs inhibit the occurrence of hydrocephalus after IVH. A) Illustration of drug delivery method and Schematic display of time nodes for drug injection in vivo. B) The methods of measuring CSF secretion rate. C) Represent 7‐T magnetic resonance images of Ctrl, PHH, and TSOs groups at 48 h. D) The 3D reconstructed images of lateral ventricles. E) Quantification volumes of the lateral ventricle based on the related T2‐weighted images (n = 3 animals per condition), *p < 0.05. F) Quantification of CSF secretion rates (n = 3 animals per condition), **p < 0.01. G–J) IF staining images of G) SPAK, H) OSR1, I) NKCC1, and J) pNKCC1 at the choroid plexus in Ctrl, PHH, and TSO treatment groups. Scale bar: 100 µm, entire images and scale bar: 10 µm, the magnified images.
Figure 6
Figure 6
TSOs significantly inhibit ChP macrophage infiltration, ChP inflammation, and restore the blood‐CSF barrier function in PHH. A) QPCR showing that TSOs inhibited TNF‐α, IL‐1β, and CCL2 mRNA expression in choroid plexus (n = 3 animals per condition), **p < 0.01, ***p < 0.001. B) ELISA detected the content of CCL2, TNF‐α, and IL‐1β in CSF of Ctrl, PHH, and TSOs treated rats (n = 3 animals per condition), *p < 0.05. C) The number of IBA1+ macrophages in the choroid plexus of normal rats. D) Increased macrophage infiltration at the choroid plexus in PHH rats. E) The macrophage infiltration in PHH rats treated with TSOs. Scale bar: 200 µm, entire images and scale bar: 20 µm, the magnified images. F) The presence of CD68+IBA1+ macrophages in choroid plexus in Ctrl, PHH, and TSOs treated groups. Scale bar (50 µm, entire images and scale bar: 20 µm, the magnified images. G) The number of IBA1+macrophages in choroid plexus was quantitatively analyzed (n = 5 animals per condition), *p < 0.05, **p < 0.01. H) The number of CD68+IBA1+macrophages in the choroid plexus was quantitatively analyzed (n = 5 animals per condition), ***p < 0.001 and ****p < 0.0001. I) Expression of TNF‐α in Ctrl and PHH rats, and PHH rats treated with TSOs. Scale bar: 50 µm, entire images and scale bar: 20 µm, the magnified images. J) The expression of ZO‐1 in different groups. Scale bar: 50 µm, entire images and scale bar: 10 µm, the magnified images.

References

    1. Kahle K. T., Kulkarni A. V., D. D. Limbrick, Jr , Warf B. C., Lancet 2016, 387, 788. - PubMed
    1. Zaksaite T., Loveday C., Edginton T., Spiers H. J., Smith A. D., Cortex 2023, 160, 67. - PubMed
    1. McAllister J. P., Williams M. A., Walker M. L., Kestle J. R. W., Relkin N. R., Anderson A. M., Gross P. H., Browd S. R., J. Neurosurg. 2015, 123, 1427. - PubMed
    1. Kulkarni A. V., Cochrane D. D., McNeely P. D., J. Pediatr. 2008, 153, 689. - PubMed
    1. Kahle K. T., Kulkarni A. V., Limbrick D. D., Warf B. C., Lancet 2016, 387, 788. - PubMed

Publication types

Substances

LinkOut - more resources