. 2024 Feb;7(1):53-67.
doi: 10.1089/crispr.2023.0066.

Generation of Human Isogenic Induced Pluripotent Stem Cell Lines with CRISPR Prime Editing

Affiliations

Generation of Human Isogenic Induced Pluripotent Stem Cell Lines with CRISPR Prime Editing

Lori L Bonnycastle et al. CRISPR J. 2024 Feb.

Abstract

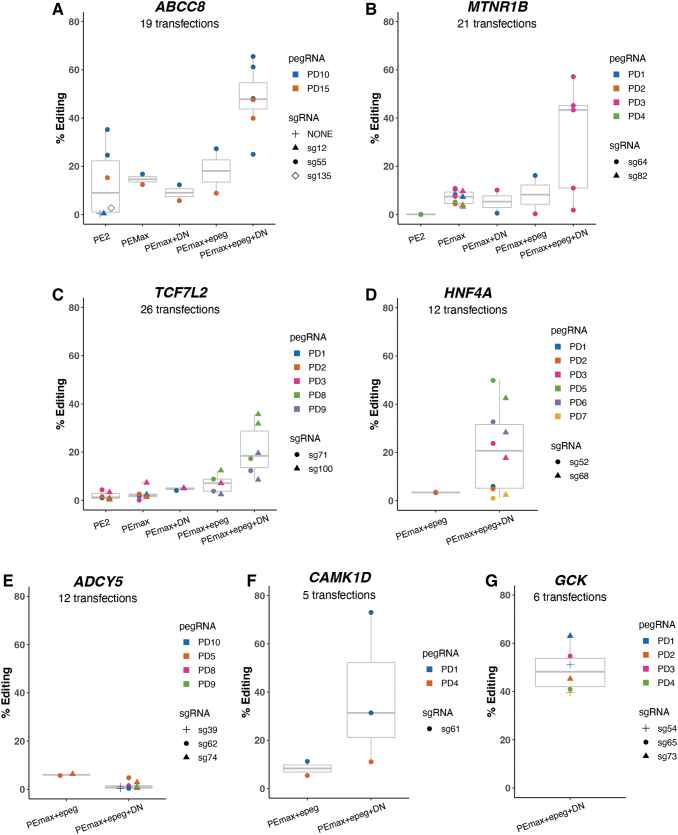
We developed an efficient CRISPR prime editing protocol and generated isogenic-induced pluripotent stem cell (iPSC) lines carrying heterozygous or homozygous alleles for putatively causal single nucleotide variants at six type 2 diabetes loci (ABCC8, MTNR1B, TCF7L2, HNF4A, CAMK1D, and GCK). Our two-step sequence-based approach to first identify transfected cell pools with the highest fraction of edited cells significantly reduced the downstream efforts to isolate single clones of edited cells. We found that prime editing can make targeted genetic changes in iPSC and optimization of system components and guide RNA designs that were critical to achieve acceptable efficiency. Systems utilizing PEmax, epegRNA modifications, and MLH1dn provided significant benefit, producing editing efficiencies of 36-73%. Editing success and pegRNA design optimization required for each variant differed depending on the sequence at the target site. With attention to design, prime editing is a promising approach to generate isogenic iPSC lines, enabling the study of specific genetic changes in a common genetic background.


Conflict of interest statement

No competing financial interests exist.

Figures

FIG. 1.
FIG. 1.
Prime editing (PE3) components and experimental process. (A) The prime editor (nCas9-RT) is directed to the target site by the pegRNA. nCas9-RT nicks the genomic strand containing the PAM sequence, allowing the pegRNA PBS sequence to hybridize with the newly released 3′ end of genomic strand. DNA synthesis occurs (not shown) at this untethered 3′ end of the nicked DNA strand using the RTT as a template. The sgRNA is usually positioned 40–90 bp from the pegRNA-induced nick and will introduce a second nick to promote repair of that strand. (B) The prime editing process includes design of pegRNA and sgRNA oligos to target candidate SNVs, transfection of iPSCs with combinations of prime editing components, expansion of transfected cells, pooled sequencing of the region spanning across the edit (1st Screen), and selection of top performing pools for single cell isolation and expansion to isolation isogenic lines (Single Cell Cloning inset). Clonal lines are sequenced (2nd Screen) to identify those with the correctly installed edit. Selected and expanded clones are sequenced to confirm the edited base and stained with cell surface markers to confirm pluripotency. gRNA, Guide RNA; nCas9, Cas9 nickase; PAM, protospacer adjacent motif; PBS, primer binding site; RT, reverse transcriptase; RTT, reverse transcriptase template; sgRNA, single-guide RNA; SNV, single nucleotide variant.
FIG. 2.
FIG. 2.
Editing efficiencies predicted by pool sequencing are validated by single colony sequencing. Editing efficiencies predicted by pooled sequencing (X-axis) and editing efficiencies observed from subsequent single colony sequencing (Y-axis) across four T2D-associated SNVs near ABCC8, HNF4A, MTNR1B, and TCF7L2. The two sets of values were compared using the Pearson r2 statistic, which quantifies the degree to which single clone editing efficiency is approximated by pooled sequencing. The single colony sequencing efficiencies represent the proportion of edited alleles from all clones selected from one pool (transfection) and sequenced individually. T2D, type 2 diabetes.
FIG. 3.
FIG. 3.
Editing efficiencies for different prime editing systems across seven targeted SNVs. (A–G) Different combinations of gRNA combinations (pegRNA and sgRNA) were transfected together with the prime editor (nCas9-RT). gRNA numbering is specific for each gene target. X-axis: prime editing complex systems represented by PE2 and PEmax in the presence or absence of modifications (epeg and DN). Y-axis: % editing efficiency as determined by read counts from sequencing of transfected cell pools. All SNVs except ADCY5 showed satisfactory efficiency. PD, pegRNAs; sg, sgRNAs, with distance from the pegRNA-induced nick represented by numeric values; epegRNA, modification on pegRNA; DN, MLH1dn; # rxns, number of transfections/data points in each plot.
FIG. 4.
FIG. 4.
pegRNA design parameters affected editing efficiency. (A) Examples of pegRNAs with a constant PBS length but variable RTT length and PAM-to-edit distance. PBS; RTT; PAM-to-edit, distance between PAM sequence and edit site; RTT overhang, nucleotides after the installed edit encoded by in the RTT; red tick mark, nucleotide to be installed. (B–E) Editing efficiency for each target, based on PAM-to-edit distance, PBS length, RTT length, or RTT overhang. Each dot represents the average % editing of all replicate transfections of each pegRNA. Error bars show standard deviation of percent editing across multiple transfections of each pegRNA. Only a single point is shown for pegRNAs where editing efficiency was only measured for a single transfection. p-Values were generated by fitting a simple linear model with average editing efficiency as the outcome variable. See methods for additional details.
FIG. 5.
FIG. 5.
Insertion–deletion rates. (A) Overall insertion–deletion rate within 800 bp for all clones for one target. Numbers at the top of the bars represent the number of clones sequenced for each target. (B) Rate across all transfections for each target with each dot representing one transfection. Dot sizes are on a continuous scale with the size increasing as the number of clones screened increases. The total number of clones screened for each target corresponds to those in panel A (HNF4A = 295, MTNR1B = 470, TCF7L2 = 778).
FIG. 6.
FIG. 6.
Timeline: prime editing to edited clones. A general prime editing timeline illustrating a streamlined process that can be completed within 5 weeks. combo, combination of gRNAs (pegRNA and sgRNA); wp, well plate.

References

    1. Buniello A, MacArthur JAL, Cerezo M, et al. . The NHGRI-EBI GWAS Catalog of published genome-wide association studies, targeted arrays and summary statistics 2019. Nucleic Acids Res 2019;47(D1):D1005–D1012; doi: 10.1093/nar/gky1120 - DOI - PMC - PubMed
    1. Rao S, Yao Y, Bauer DE. Editing GWAS: Experimental approaches to dissect and exploit disease-associated genetic variation. Genome Med 2021;13(1):41; doi: 10.1186/s13073-021-00857-3 - DOI - PMC - PubMed
    1. Soldner F, Laganiere J, Cheng AW, et al. . Generation of isogenic pluripotent stem cells differing exclusively at two early onset Parkinson point mutations. Cell 2011;146(2):318–331; doi: 10.1016/j.cell.2011.06.019 - DOI - PMC - PubMed
    1. Hockemeyer D, Jaenisch R. Induced pluripotent stem cells meet genome editing. Cell Stem Cell 2016;18(5):573–586; doi: 10.1016/j.stem.2016.04.013 - DOI - PMC - PubMed
    1. Nair AK, Traurig M, Sutherland JR, et al. . Generation of isogenic hiPSCs with targeted edits at multiple intronic SNPs to study the effects of the type 2 diabetes associated KCNQ1 locus in American Indians. Cells 2022;11(9); doi: 10.3390/cells11091446 - DOI - PMC - PubMed

Publication types

MeSH terms

Substances

LinkOut - more resources