. 2024 May 1;326(5):E602-E615.
doi: 10.1152/ajpendo.00331.2023. Epub 2024 Feb 14.

Increasing maternal glucose concentrations is insufficient to restore placental glucose transfer in chorionic somatomammotropin RNA interference pregnancies

Affiliations

Increasing maternal glucose concentrations is insufficient to restore placental glucose transfer in chorionic somatomammotropin RNA interference pregnancies

Amelia R Tanner et al. Am J Physiol Endocrinol Metab. .

Abstract

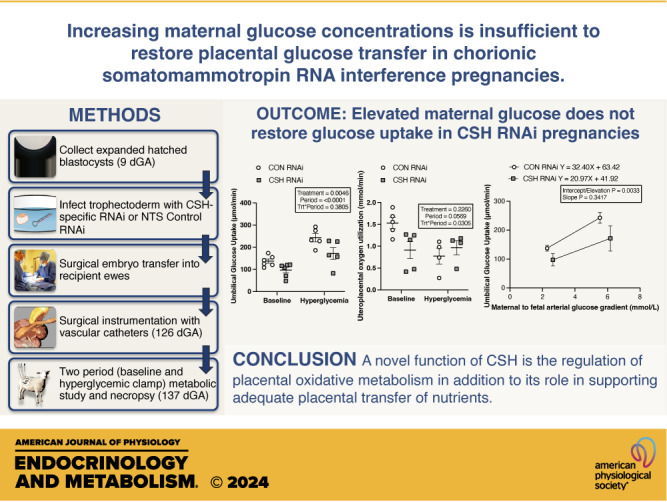
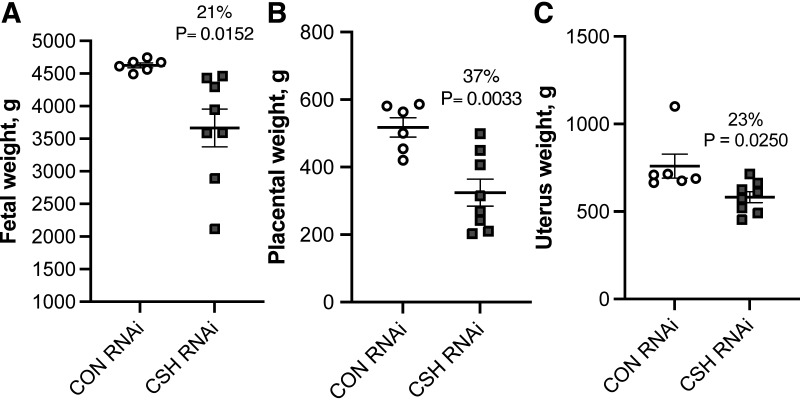
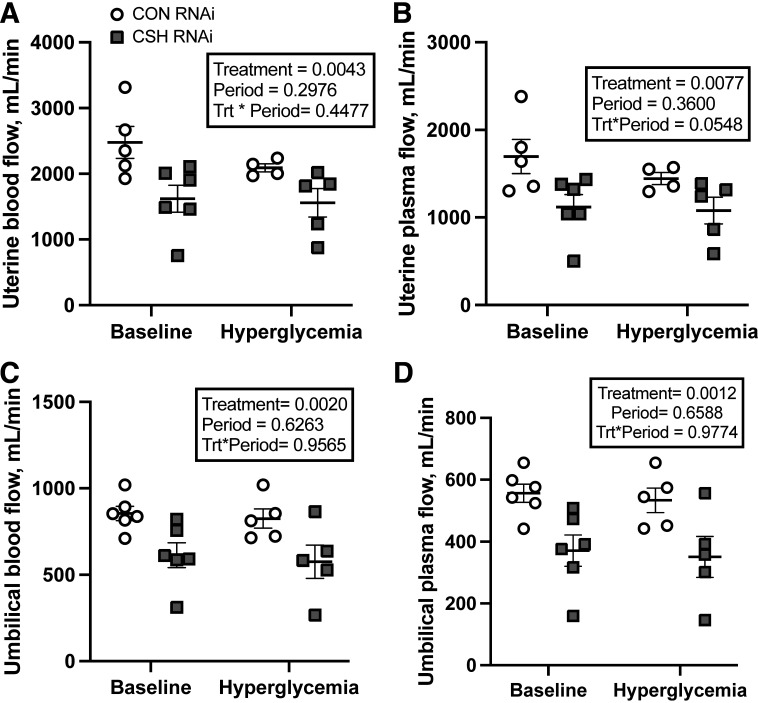
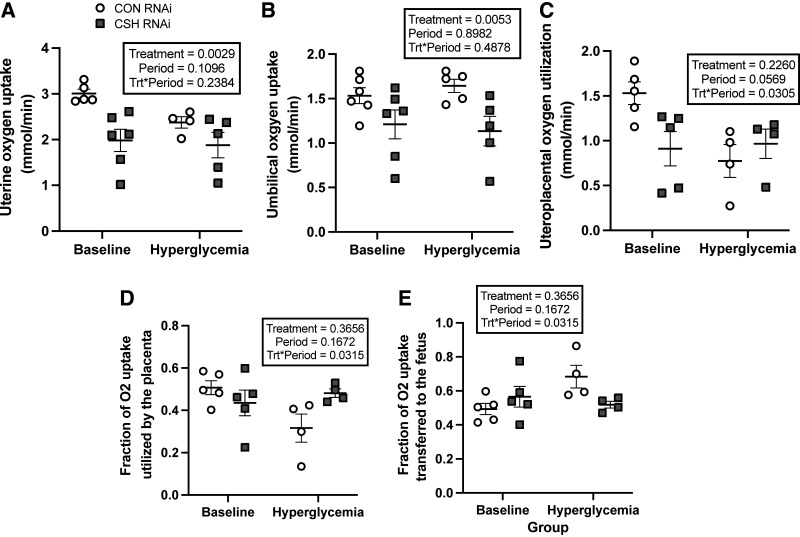
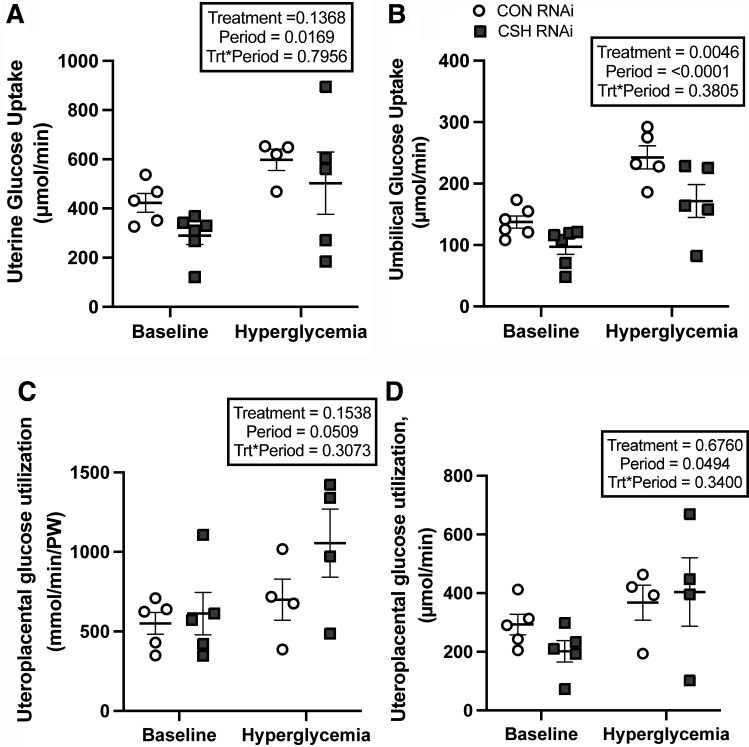
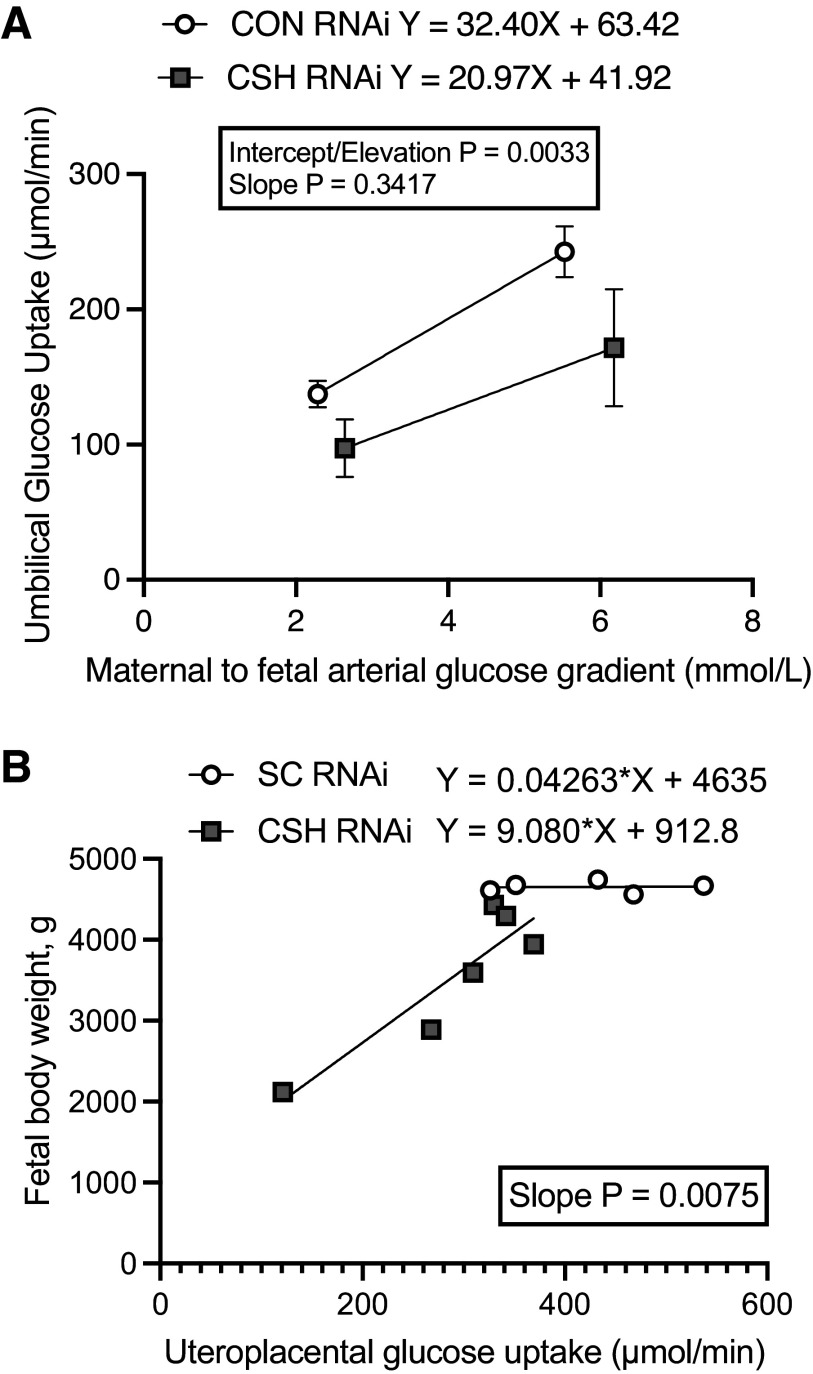
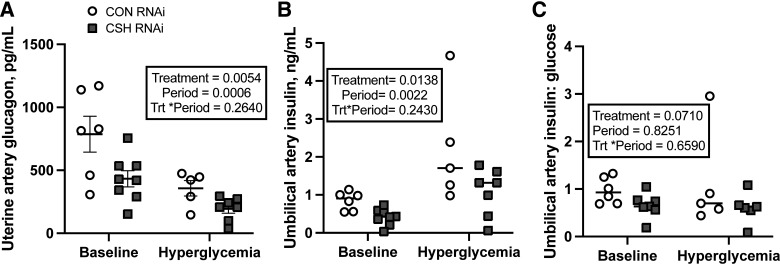
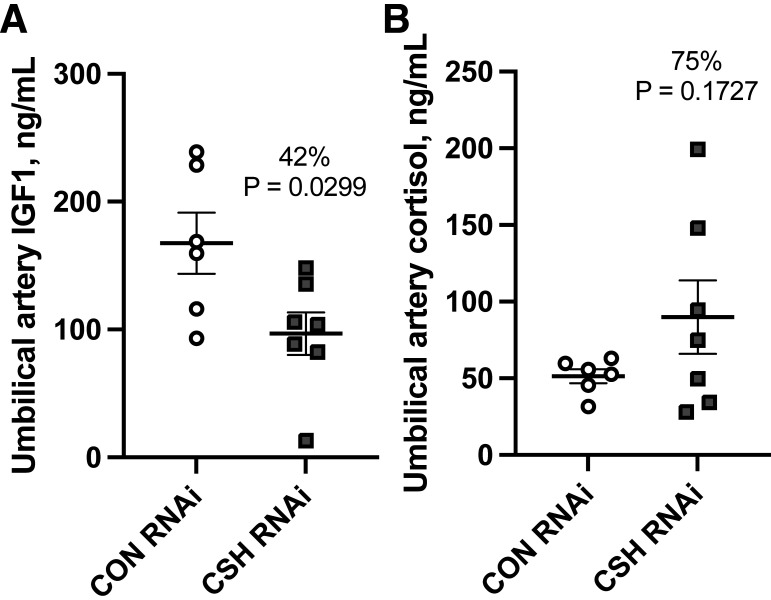
We previously demonstrated impaired placental nutrient transfer in chorionic somatomammotropin (CSH) RNA interference (RNAi) pregnancies, with glucose transfer being the most impacted. Thus, we hypothesized that despite experimentally elevating maternal glucose, diminished umbilical glucose uptake would persist in CSH RNAi pregnancies, demonstrating the necessity of CSH for adequate placental glucose transfer. Trophectoderm of sheep blastocysts (9 days of gestational age; dGA) were infected with a lentivirus expressing either nontargeting control (CON RNAi; n = 5) or CSH-specific shRNA (CSH RNAi; n = 7) before transfer into recipient sheep. At 126 dGA, pregnancies were fitted with vascular catheters and underwent steady-state metabolic studies (3H2O transplacental diffusion) at 137 ± 0 dGA, before and during a maternal hyperglycemic clamp. Umbilical glucose and oxygen uptakes, as well as insulin and IGF1 concentrations, were impaired (P ≤ 0.01) in CSH RNAi fetuses and were not rescued by elevated maternal glucose. This is partially due to impaired uterine and umbilical blood flow (P ≤ 0.01). However, uteroplacental oxygen utilization was greater (P ≤ 0.05) during the maternal hyperglycemic clamp, consistent with greater placental oxidation of substrates. The relationship between umbilical glucose uptake and the maternal-fetal glucose gradient was analyzed, and while the slope (CON RNAi, Y = 29.54X +74.15; CSH RNAi, Y = 19.05X + 52.40) was not different, the y-intercepts and elevation were (P = 0.003), indicating reduced maximal glucose transport during maternal hyperglycemia. Together, these data suggested that CSH plays a key role in modulating placental metabolism that ultimately promotes maximal placental glucose transfer.NEW & NOTEWORTHY The current study demonstrated a novel, critical autocrine role for chorionic somatomammotropin in augmenting placental glucose transfer and maintaining placental oxidative metabolism. In pregnancies with CSH deficiency, excess glucose in maternal circulation is insufficient to overcome fetal hypoglycemia due to impaired placental glucose transfer and elevated placental metabolic demands. This suggests that perturbations in glucose transfer in CSH RNAi pregnancies are due to compromised metabolic efficiency along with reduced placental mass.

Keywords: RNA interference; chorionic somatomammotropin; fetal growth restriction; glucose transfer; placenta.


Conflict of interest statement

No conflicts of interest, financial or otherwise, are declared by the authors.

Figures

None
Graphical abstract
Figure 1.
Figure 1.
Measures of fetal and uteroplacental mass at 137 ± 0 dGA: fetal weight in g (A), placental weight in g (B), and uterus weight in g (C). All data presented were analyzed by Student's t test. Data are shown as means ± SE for all pregnancies in each treatment group. CON (n = 6 pregnancies), control; CSH (n = 8 pregnancies), chorionic somatomammotropin; RNAi, RNA interference.
Figure 2.
Figure 2.
Measures of blood and plasma flow at 137 ± 0 dGA: uterine blood flow as assessed by the transplacental diffusion technique (A), uterine plasma flow as assessed by the transplacental diffusion technique (B), umbilical blood flow as assessed by the transplacental diffusion technique (C), and umbilical plasma flow as assessed by the transplacental diffusion technique (D). All data presented were analyzed by a two-way ANOVA to examine the interactions between period (baseline vs. hyperglycemic clamp) and treatment (CON RNAi vs. CSH RNAi). Uterine baseline measures included CON RNAi n = 5, CSH RNAi n = 6. Umbilical baseline measures include CON RNAi n = 6, CSH RNAi n = 6. Uterine hyperglycemic measures included CON RNAi n = 4, CSH RNAi n = 5. Umbilical hyperglycemic measures include CON RNAi n = 5, CSH RNAi n = 5. Data are shown as means ± SE for all pregnancies in each treatment group. CON, control; CSH, chorionic somatomammotropin; RNAi, RNA interference.
Figure 3.
Figure 3.
Uterine, umbilical, and uteroplacental oxygen uptakes and fractional utilization at 137 ± 0 dGA: uterine oxygen uptakes (mmol/min; A), umbilical oxygen uptakes (mmol/min; B), uteroplacental oxygen utilization (mmol/min; C), fraction of uteroplacental oxygen utilized by the placenta (D), and fraction of uteroplacental oxygen transferred to the fetus (E). All data presented were analyzed by a two-way ANOVA to examine the interactions between period (baseline vs. hyperglycemic clamp) and treatment (CON RNAi vs. CSH RNAi). Uterine baseline measures included CON RNAi n = 5, CSH RNAi n = 6. Umbilical baseline measures include CON RNAi n = 6, CSH RNAi n = 6. Uteroplacental baseline measures include CON RNA n = 5, CSH RNAi n = 5. Uterine hyperglycemic measures included CON RNAi n = 4, CSH RNAi n = 5. Umbilical hyperglycemic measures include CON RNAi n = 5, CSH RNAi n = 5. Uteroplacental hyperglycemic measures and fractional utilization measures include CON RNAi n = 4, CSH RNAi n = 4. Data are shown as means ± SE for all pregnancies in each treatment group. CON, control; CSH, chorionic somatomammotropin; RNAi, RNA interference.
Figure 4.
Figure 4.
Uterine, umbilical, and uteroplacental glucose uptakes (total and relative) at 137 ± 0 dGA: uterine glucose uptakes (μmol/min; A), umbilical glucose uptakes (μmol/min; B), uteroplacental glucose utilization (μmol/min; C), and relative uteroplacental glucose utilization (μmol/min/kg placenta; D). All data presented were analyzed by a two-way ANOVA to examine the interactions between period (baseline vs. hyperglycemic clamp) and treatment (CON RNAi vs. CSH RNAi). Uterine baseline measures included CON RNAi n = 5, CSH RNAi n = 6. Umbilical baseline measures include CON RNAi n = 6, CSH RNAi n = 6. Uteroplacental baseline measures include CON RNA n = 5, CSH RNAi n = 5. Uterine hyperglycemic measures included CON RNAi n = 4, CSH RNAi n = 5. Umbilical hyperglycemic measures include CON RNAi n = 5, CSH RNAi n = 5. Uteroplacental hyperglycemic measures include CON RNAi n = 4, CSH RNAi n = 4. Data are shown as means ± SE for all pregnancies in each treatment group. CON, control; CSH, chorionic somatomammotropin; RNAi, RNA interference.
Figure 5.
Figure 5.
Linear regressions: impact of in vivo CSH RNAi on umbilical glucose uptake in relationship to the maternofetal arterial glucose gradient at 137 ± 0 dGA (A) and the impact of in vivo CSH RNAi on fetal body weight in relationship to uteroplacental glucose uptake (B). CON, control; CSH, chorionic somatomammotropin; RNAi, RNA interference.
Figure 6.
Figure 6.
The effects of maternal hyperglycemia on umbilical artery insulin and insulin:glucose ratios at 137 ± 0 dGA: uterine artery glucagon (pg/mL; A), umbilical artery insulin (ng/mL; B) and umbilical artery insulin:glucose ratios (C). All data presented were analyzed by a two-way ANOVA to examine the interactions between period (baseline vs. hyperglycemic clamp) and treatment (CON RNAi vs. CSH RNAi). Data are shown as means ± SE for all pregnancies in each treatment group. Uterine and umbilical baseline measures included CON RNAi n = 6, CSH RNAi n = 8. Uterine hyperglycemic measures included CON RNAi n = 5, CSH RNAi n = 7. Umbilical artery insulin hyperglycemic measures include CON RNAi n = 5, CSH RNAi n = 7. Umbilical artery insulin:glucose hyperglycemic measures include CON RNAi n = 5, CSH RNAi n = 6. CON, control; CSH, chorionic somatomammotropin; RNAi, RNA interference.
Figure 7.
Figure 7.
Umbilical hormone concentrations under baseline conditions at 137 ± 0 dGA: umbilical artery IGF1 concentrations (ng/mL; A) and umbilical artery cortisol (ng/mL; B). All data presented were analyzed by Student's t test. Data are shown as means ± SE for all pregnancies in each treatment group. CON (n = 6), control; CSH (n = 7), chorionic somatomammotropin; RNAi, RNA interference.

Similar articles

Cited by

References

    1. Brar HS, Rutherford SE. Classification of intrauterine growth retardation. Semin Perinatol 12: 2–10, 1988. - PubMed
    1. Pollack RN, Divon MY. Intrauterine growth retardation: definition, classification, and etiology. Clin Obstet Gynecol 35: 99–107, 1992. doi:10.1097/00003081-199203000-00015. - DOI - PubMed
    1. Regnault TR, Galan HL, Parker TA, Anthony RV. Placental development in normal and compromised pregnancies– a review. Placenta 23 Suppl A: S119–S129, 2002. doi:10.1053/plac.2002.0792. - DOI - PubMed
    1. Gagnon R. Placental insufficiency and its consequences. Eur J Obstet Gynecol Reprod Biol 110 Suppl 1: S99–S107, 2003. doi:10.1016/s0301-2115(03)00179-9. - DOI - PubMed
    1. Anthony RV, Scheaffer AN, Wright CD, Regnault TR. Ruminant models of prenatal growth restriction. Reprod Suppl 61: 183–194, 2003. - PubMed

LinkOut - more resources