Review
. 2024 Feb 14;15(1):45.
doi: 10.1186/s13244-023-01577-5.

O-RADS MRI risk stratification system: pearls and pitfalls

Affiliations
Review

O-RADS MRI risk stratification system: pearls and pitfalls

Stephanie Nougaret et al. Insights Imaging. .

Abstract

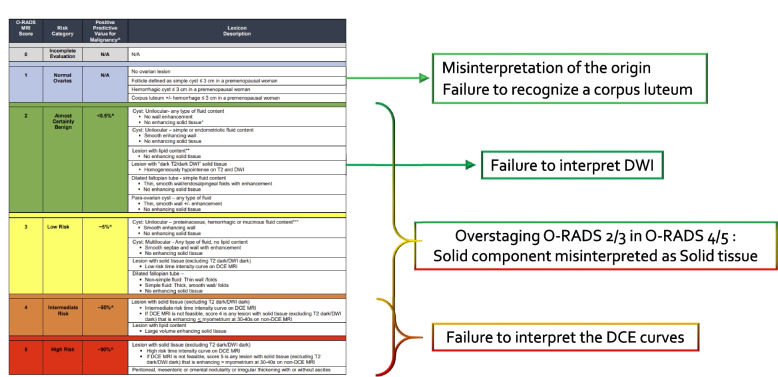
In 2021, the American College of Radiology (ACR) Ovarian-Adnexal Reporting and Data System (O-RADS) MRI Committee developed a risk stratification system and lexicon for assessing adnexal lesions using MRI. Like the BI-RADS classification, O-RADS MRI provides a standardized language for communication between radiologists and clinicians. It is essential for radiologists to be familiar with the O-RADS algorithmic approach to avoid misclassifications. Training, like that offered by International Ovarian Tumor Analysis (IOTA), is essential to ensure accurate and consistent application of the O-RADS MRI system. Tools such as the O-RADS MRI calculator aim to ensure an algorithmic approach. This review highlights the key teaching points, pearls, and pitfalls when using the O-RADS MRI risk stratification system.Critical relevance statement This article highlights the pearls and pitfalls of using the O-RADS MRI scoring system in clinical practice.Key points• Solid tissue is described as displaying post- contrast enhancement.• Endosalpingeal folds, fimbriated end of the tube, smooth wall, or septa are not solid tissue.• Low-risk TIC has no shoulder or plateau. An intermediate-risk TIC has a shoulder and plateau, though the shoulder is less steep compared to outer myometrium.

Keywords: MRI; O-RADS; Ovarian lesion; Stratification.


Conflict of interest statement

YL consults for Calyx Clinical Trial Solutions. The remaining authors declare that they have no competing interests.

Figures

Fig. 1
Fig. 1
Optimal MRI protocol to perform O-RADS MRI Risk scoring. a Sagittal T2-weighted sequence without fat saturation. b Axial T2-weighted lombo-pelvic sequence. c Axial DWI lombo-pelvic scan (b: 1400 s/mm2). d Corresponding axial ADC map. e Axial unenhanced T1-weighted in-phase. f Axial unenhanced T1-weighted opposed-phase. g Axial unenhanced T1-weighted Fat sequence. h Axial unenhanced T1-weighted water sequence. i Axial late-gadolinium T1-weighted sequence. j, k DCE T1-weighted sequence with myometrial curve (yellow curve) and region of interest within the solid ovarian tissue (blue curve) (l). This was classifified as an O-RADS MRI 4, and hypothesized to represent a serous borderline cystadenoma
Fig. 2
Fig. 2
O-RADS classification with most common errors. Please refer to reference 7 for positive predictive values
Fig. 3
Fig. 3
Useful sign to evaluate the relationship between a lesion and adjacent organ: a Axial T2-weighted sequence with a “beak sign” (white arrow head). b Sagittal T2-weighted sequence showing a “claw sign” (white star). c, d Sagittal and Axial T2-weighted sequence with “bridging vessel sign” (arrow)
Fig. 4
Fig. 4
Example of MRI appearance of a corpus luteum cyst. a Axial T2-weighted sequence. b Axial DWI abdominal and pelvic scan (b: 1200 s/mm2). c Axial unenhanced T1-weighted water sequence. d Axial late-gadolinium T1-weighted sequence. Left ovarian corpus luteum cyst (maximal diameter: 35 mm) (white arrow)
Fig. 5
Fig. 5
Example of MRI appearance of a para-ovarian cyst. a Axial T2-weighted sequence. b Axial DWI lombo-pelvic scan (b: 1200 s/mm2). c Axial unenhanced T1-weighted in-phase sequence. d Axial late-gadolinium T1-weighted sequence. Left para-ovarian cyst (maximal diameter: 17 mm) white arrow
Fig. 6
Fig. 6
MRI assessment of non-simple fluid. First column corresponding to T2-weighted signal. Second column corresponding to T1-weighted in-phase sequence. Third column corresponding to T1-weighted water-phase sequence. Fourth column corresponding to diffusion-weighted sequence. Last column corresponding to late gadolinium T1-weighted sequence. a Hemorrhagic fluid. b Endometriotic fluid. c Proteinaceous fluid in this case: pus inside an abscess. d Lipid-containing fluid
Fig. 7
Fig. 7
Illustration of the dark T2/DWI appearance on MRI. a Axial T2-weighted sequence. b Axial DWI abdominal and pelvicscan (b: 1200 s/mm2). c Axial unenhanced T1-weighted in-phase sequence. d Axial late gadolinium T1-weighted sequence. Right ovarian lesion classified O-RADS2 corresponding to a right ovarian fibroma (maximal diameter: 47 mm) (white arrow)
Fig. 8
Fig. 8
Example of MRI appearance of a Rokitansky nodule which does not account for a solid tissue. a Axial T2-weighted sequence. b Axial DWI abdominal and pelvic scan (b: 1200 s/mm2). c Axial unenhanced T1-weighted in-phase sequence. d Axial late-gadolinium T1-weighted sequence. Right ovarian dermoïd cyst with a small Rokitansky nodule (white arrow)
Fig. 9
Fig. 9
Example of solid tissue descriptors: a Axial T2-weighted sequence without fat saturation. b Axial unenhanced T1-weighted Water sequence showing papillary projections in bilateral serous borderline ovarian lesions (arrows). c Axial T2-weighted sequence without fat saturation. d Axial unenhanced T1-weighted Water sequence showing a large mural nodule (arrows) in a high-grade serous ovarian cancer. e Axial T2-weighted sequence without fat saturation. f Axial unenhanced T1-weighted Water sequence showing irregular septations (arrows) in bilateral serous borderline ovarian lesions. g Axial T2-weighted sequence without fat saturation. h Axial unenhanced T1-weighted Water sequence showing irregular wall (arrows) in a serous borderline bilateral ovarian tumor. i Axial T2-weighted sequence without fat saturation. j Axial unenhanced T1-weighted Water sequence showing irregular septations showing large solid component (arrows) high-grade serous ovarian cancer
Fig. 10
Fig. 10
Example of mature cystic teratoma. a Axial T2-weighted sequence without fat saturation. b Axial unenhanced T1-weighted Water sequence. c Axial DWI scan (b: 1200 s/mm2). d Axial late-gadolinium T1-weighted sequence. e, f DCE T1-weighted sequence with corresponding curve of the external myometrium: yellow curve and Rokitansky protuberance: purple curve corresponding to a type I curve
Fig. 11
Fig. 11
Example of MRI appearance endosalpingial folds. a Axial T2-weighted sequence. b Axial DWI lombo-pelvic scan (b: 1200 s/mm2). c Axial unenhanced T1-weighted water sequence. d Axial late-gadolinium T1-weighted sequence. Multiple endosalpingial folds (white arrow) potentially leading to a misinterpretation with ovarian vegetations. Note the hypersignal on the DWI scan corresponding to pus inside the fallopian tube (white star)
Fig. 12
Fig. 12
Fimbrial end of the tube between a dilated hydrosalpynx and the right ovarian structure. a Axial T2-weighted sequence. b Sagittal T2-weighted sequence. Stellar morphology of the fimbrial end of the tube (white arrow)
Fig. 13
Fig. 13
MRI appearance of a thick (first row, white arrow) and a thin septa (second row). a Axial T2-weighted sequence showing a thickened septa with tissular component. b Axial late-gadolinium T1-weighted sequence showing a tissular enhancement. c Axial DWI abdominal and pelvic scan (b: 1200 s/mm2) with hypersignal of the tissular component. d Axial T2-weighted sequence showing a thin septa. e Axial late-gadolinium T1-weighted sequence showing a thin enhancement. f Axial DWI abdominal and pelvic scan (b: 1200 s/mm2) showing no hypersignal
Fig. 14
Fig. 14
Example of left ovarian lesion with a solid component with a type I dynamic enhancement curve. a Axial T2-weighted sequence without fat saturation. b Axial DWI scan (b: 1200 s/mm2). c Axial unenhanced T1-weighted water sequence. d Axial late-gadolinium T1-weighted sequence. ef DCE MRI T1-weighted sequence with corresponding curve of the tissular component showing a type I curve. This was favored to be a benign cystadenofibroma
Fig. 15
Fig. 15
Difference between a type I curve and a type II curve. Same case as illustrated previously: a Axial T2-weighted sequence without fat saturation. b,c DCE MRI T1-weighted sequence with corresponding curve of the tissular component showing a type I curve corresponding to a cystadenofibroma. Other case with (d) Axial T2-weighted sequence without fat saturation. ef DCE MRI T1-weighted sequence with corresponding curve of the tissular component showing a type II curve corresponding to a borderline serous cystadenoma
Fig. 16
Fig. 16
Example of bilateral ovarian lesion with a solid tissue with a type II dynamic enhancement curve (e) and type III dynamic enhancement curve (e). a Axial T2-weighted sequence without fat saturation and (b) Axial unenhanced T1-weighted water sequence show a mixed right cystic and solid lesion with (c) large enhancing solid tissue portion (d) with corresponding curve of the tissular component showing a type III curve (orange curve) (e) consistent with an O-RADS MRI 5 score. c Axial T2-weighted sequence without fat saturation and (f) DCE MRI T1-weighted sequence show a large left cystic lesion with solid tissue represented by papillary projections (arrow), corresponding to a type II curve (pink curve). Note the myometrium is represented by the yellow curve. The hypothesis of a low-grade serous ovarian cancer was made and later proven on histology

Similar articles

Cited by

References

    1. Reinhold C, Rockall A, Sadowski EA, et al. Ovarian-Adnexal Reporting Lexicon for MRI: A White Paper of the ACR Ovarian-Adnexal Reporting and Data Systems MRI Committee. J Am Coll Radiol. 2021;18(5):713–29. doi: 10.1016/j.jacr.2020.12.022. - DOI - PubMed
    1. Nougaret S, Lakhman Y, Bahadir S, Sadowski E, Thomassin-Naggara I, Reinhold C. Ovarian-Adnexal Reporting and Data System for Magnetic Resonance Imaging (O-RADS MRI): Genesis and Future Directions. Can Assoc Radiol J. 2023;74(2):370–81. doi: 10.1177/08465371221121738. - DOI - PMC - PubMed
    1. Rizzo S, Cozzi A, Dolciami M, et al (2023) O-RADS MRI: A Systematic Review and Meta-Analysis of Diagnostic Performance and Category-wise Malignancy Rates. Radiology 307(1):e220795. 10.1148/radiol.220795. - PubMed
    1. Thomassin-Naggara I, Belghitti M, Milon A, et al. O-RADS MRI score: analysis of misclassified cases in a prospective multicentric European cohort. Eur Radiol. 2021;31(12):9588–99. doi: 10.1007/s00330-021-08054-x. - DOI - PubMed
    1. Van Calster B, Van Hoorde K, Froyman W, et al. Practical guidance for applying the ADNEX model from the IOTA group to discriminate between different subtypes of adnexal tumors. Facts Views Vis Obgyn. 2015;7(1):32–41. - PMC - PubMed

LinkOut - more resources