. 2024 Feb 14;16(734):eadj5962.
doi: 10.1126/scitranslmed.adj5962. Epub 2024 Feb 14.

Aberrant ATM signaling and homology-directed DNA repair as a vulnerability of p53-mutant GBM to AZD1390-mediated radiosensitization

Affiliations

Aberrant ATM signaling and homology-directed DNA repair as a vulnerability of p53-mutant GBM to AZD1390-mediated radiosensitization

Jiajia Chen et al. Sci Transl Med. .

Abstract

ATM is a key mediator of radiation response, and pharmacological inhibition of ATM is a rational strategy to radiosensitize tumors. AZD1390 is a brain-penetrant ATM inhibitor and a potent radiosensitizer. This study evaluated the spectrum of radiosensitizing effects and the impact of TP53 mutation status in a panel of IDH1 wild-type (WT) glioblastoma (GBM) patient-derived xenografts (PDXs). AZD1390 suppressed radiation-induced ATM signaling, abrogated G0-G1 arrest, and promoted a proapoptotic response specifically in p53-mutant GBM in vitro. In a preclinical trial using 10 orthotopic GBM models, AZD1390/RT afforded benefit in a cohort of TP53-mutant tumors but not in TP53-WT PDXs. In mechanistic studies, increased endogenous DNA damage and constitutive ATM signaling were observed in TP53-mutant, but not in TP53-WT, PDXs. In plasmid-based reporter assays, GBM43 (TP53-mutant) showed elevated DNA repair capacity compared with that in GBM14 (p53-WT), whereas treatment with AZD1390 specifically suppressed homologous recombination (HR) efficiency, in part, by stalling RAD51 unloading. Furthermore, overexpression of a dominant-negative TP53 (p53DD) construct resulted in enhanced basal ATM signaling, HR activity, and AZD1390-mediated radiosensitization in GBM14. Analyzing RNA-seq data from TCGA showed up-regulation of HR pathway genes in TP53-mutant human GBM. Together, our results imply that increased basal ATM signaling and enhanced dependence on HR represent a unique susceptibility of TP53-mutant cells to ATM inhibitor-mediated radiosensitization.


Figures

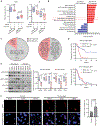
Fig. 1.
Fig. 1.. AZD1390 inhibits ATM-dependent DDR and radiosensitizes GBM cells.
(A) Immunoblots showing dose-dependent inhibition of DDR signaling in U251 cells preincubated with graded AZD1390 ± 5-Gy RT; lysed 6 hours later; and analyzed for phosphorylated and total ATM, KAP1, and Chk2, with vinculin used as loading control. (B) Immunoblots for ATM signaling in U251 cells treated with 0 or 30 nM AZD1390 ± 5-Gy RT and analyzed 2, 6, or 24 hours after RT. (C) Immunoblots showing AZD1390 dose response in GBM12 as described for (A). D) Immunoblots showing time course analysis of ATM signaling in GBM12 as described for (B). (E) Immunofluorescent images showing 53BP1 (red) or γH2AX (green) foci in the nuclei (blue) of U251 cells treated as indicated and processed 1 hour after irradiation; scale bars, 10 μm. Bar graphs (bottom) show mean positivity ± SEM, N = 3, and comparison by two-sample t test, n = 3. (F) Clonogenic survival for U251 cells treated with 0 or 30 nM AZD1390 ± increasing doses of RT, normalized survival (means ± SEM, N = 4) fitted in LQ model, two-sample t test, n = 4. (G) Drug-exposure time-dependent increase in survival (means ± SEM, N = 3) in U251 cells treated with (or without) 30 nM AZD1390 ± 2.5-Gy RT, replacing drug-free medium at indicated time after RT; the effect of prolonged drug exposure was compared with that of 4-hour exposure, two-sample t test, n = 3. (H) Three-dimensional plots showing mapped surface bliss using normalized NS counts (means ± SEM, N = 4) for GBM12 cells treated with graded AZD1390 ± RT. (I) Radiosensitizing effect of 0 versus 30 nM AZD1390 in GBM12; the relative mean NS count (means ± SEM, N = 4) was fitted in LQ model and analyzed by two-sample t test, n = 4.
Fig. 2.
Fig. 2.. Suppression of ATM potentiates efficacy of RT in mouse xenografts.
(A) Effect of AZD1390 on DDR signaling in U251 cells modified by CRISPR-Cas9 empty vectors (EVs) or ATM guide RNAs (clones #4 and #22) pretreated with 0 or 30 nM AZD1390 for 1 hour and subsequently with 0 or 5-Gy RT were lysed 2 hours later. (B) Clonogenic survival (means ± SEM, N = 3) for U251-EV and ATMKD#22 cells treated with 0 or 30 nM AZD1390 ± RT as indicated, and data fitted in LQ model, two sample t test, n = 3. (C) Floating bar plots (line at mean) for SER10, two-sample t test, n = 3. (D) Immunofluorescent images for RAD 51 foci (red) and nuclei (blue) of U251-EV or ATMKD#22 cells treated as indicated and analyzed 24 or 48 hours later; floating bars (line at mean) for % positive cells (±SEM; N = 3) compared by two-sample t test, n = 3. Scale bars, 10 μm. DAPI, 4′,6-diamidino-2-phenylindole. (E) Animal setup for x-ray irradiation and dosimetry map (blue line) in sagittal (right) and coronal (bottom) planes for the prescribed dose of 2 Gy; isocenter shown by intersection of red and green lines. (F) Kaplan-Meier graphs for survival, for mice with orthotopic U251-EV xenografts, after treatment, starting on day 5 after inoculation, with placebo/sham, 2-Gy RT per day for 5 consecutive days, or AZD1390 (20 mg/kg) and RT, analyzed by log-rank test, n = 10 per treatment group; two animals randomized to AZD1390/RT arm suffered procedural complications were excluded. Red font in parentheses and arrows pointed at x axis indicate treatment days. Line graphs for body weight changes over time (bottom), two-sample t test. (G) Survival over time, for mice with orthotopic U251-ATMKD#22 xenografts, after treatment, starting on day 6 after inoculation, with sham RT or 2-Gy RT per day for 5 consecutive days, and analyzed by log-rank test, n = 10 per treatment group; two animals in control arm survived until the end, had no sign of tumor engraftment by postmortem H&E analysis, and were excluded from analysis. Red fonts in parentheses and arrows pointed at x axis indicate treatment days.
Fig. 3.
Fig. 3.. Free drug partitioning and pharmacodynamic effects of AZD1390.
(A) Bar graphs showing unbound fraction of AZD1390 in indicated mouse tissue types, resected patient GBM (GBM pt.), or culture medium. (B) Floating bar plots (line at mean) for estimated unbound AZD1390 in normal brain, tumor core, or rim of orthotopic GBM12 xenografts analyzed 4 or 12 hours after a single dose of AZD1390 (20 mg/kg), two-sample t test, n = 4 or 5 per group. (C) Floating bar plots (line at mean) for unbound partition coefficient (Kpuu) calculated for each tissue type for individual mouse, log-transformed data analyzed by two-sample t test, n = 4 or 5 per group. (D) Immunofluorescent images showing γH2AX foci (green) and nuclei (blue) in orthotopic GBM12 xenografts excised from athymic nude mice treated (10 days after inoculation) with (or without) single dose of AZD1390 (20 mg/kg) and/or 3 or 11 hours later with 5-Gy RT (n = 5 per group) and euthanized 1 hour after RT. Scale bars, 50 μm. (E to G) Long-term effects of RT (6 Gy × 5 fractions) ± AZD1390 on brain morphology and molecular integrity; images from H&E-stained coronal section of the brains (E), representative spectroscopic images constructed from the integrated areas of the spectra between 1050 and 1100 cm−1 for nucleic acids (F), and FTIR spectra (G) obtained from the irradiated region (outlined in red), for individual mouse in each group; each spectrum is an average of measurements from four or five animals per treatment group.
Fig. 4.
Fig. 4.. Genotype-dependent differences in DNA damage signaling and radiosensitizing effects of AZD1390.
(A) Representative immunoblots showing DNA damage signaling in specified PDX lines in vitro. Primary cells for each GBM PDX line were treated with 0 or 30 nM AZD1390 ± 5-Gy RT, lysed 6 hours after RT, and analyzed for the indicated proteins; β-actin was used as a loading control, and p21 was used as an indicator of p53 transcriptional activity. (B and C) Floating bar plots (line at mean) showing signal intensity for p21 normalized to β-actin (B) and the signal intensities for signaling proteins normalized to appropriate loading controls (C); data points represent average signal intensities, for the protein analyzed, from four PDX models analyzed per group analyzed in two independent experiments (N = 2), and two-sample t test was applied to log-transformed data, n = 4. (D) Graphs showing limiting dilution clonogenic survival after treatment with (or without) 10 nM AZD1390 ± 2.5-Gy RT for indicated PDX lines; clonogenic growth scored 15 days after irradiation was plotted and analyzed using ELDA webtool: http://bioinf.wehi.edu.au/software/limdil. (E) Bar graphs showing frequency of clonogenic cells as estimated by ELDA algorithm; data represents means ± SEM from three independent assays for each PDX line, two-sample t test, n = 3.
Fig. 5.
Fig. 5.. Genotype-dependent differences in in vivo radiosensitizing effect of AZD1390.
(A) Animal setup for opposed lateral beam irradiation and dosimetry map for brain irradiation using athymic nude mice 7 days after inoculation of GBM12 PDX cells. Posterior-anterior radiograph showing isocenter targeting (left) and radiation dosimetry in coronal (middle) and sagittal (right) planes through head for prescribed dose of 2 Gy. (B) Kaplan-Meier plots showing survival over time for each cohort of mice with intracranial xenografts of TP53-WT (left column) or TP53-mutant (right column) PDXs (n = 5 per group, except for GBM10, where results from two independent studies were combined). Red fonts in parentheses and arrows pointed at x axis indicate treatment days. P, placebo; A, AZD1390 (20 mg/kg per day) alone; RT, 2 Gy per day for five consecutive days; A/RT, AZD1390 + RT. (C) Table summarizing same results with TP53 status, median survival time (days), and survival ratios for each PDX model. *P < 0.05, log-rank test for P versus A or RT versus A + RT; survival ratio represents fold change in median survival with treatment over placebo. (D) Box and whisker plots (with individual data points representing median survival ratios for each PDX line) show the comparison of efficacy between RT versus A + RT for all models (left) or select TP53-WT (middle) or TP53-mutant (right) models analyzed by Wilcoxon rank sum test.
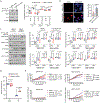
Fig. 6.
Fig. 6.. Aberrant ATM activation associated with elevated DNA damage and HR activity in TP53-mutant GBMs.
(A) Floating bar plots (line at the mean) show relative NHEJ (left) and HR (right) efficiency in GBM43 (TP53-mutant) and GBM14 (TP53-WT) cells treated as indicated, two-sample t test, n = 3 and 5 for NHEJ and HR, respectively. (B) Top-ranked pathways associated with differentially expressed genes between TP53-mutant versus TP53-WT in the TCGA Firehose Legacy GBM dataset. (C) Pie charts for NHEJ (left) or HR (right) genes; highlighted in pink are those significantly up-regulated in TP53-mutant GBM. (D) Kaplan-Meier plots showing progression-free survival among patients with TP53-mutant (n = 40) or TP53-WT (n = 56) GBM, who received RT and expressed low versus high BRCA1 mRNA compared by log-rank test. (E) Immunoblots (left) showing total and phosphorylated ATM, KAP1, and Chk2 proteins in untreated TP53-mutant and TP53-WT GBM lines; β-actin was loading control; floating bar plots (right), with line at mean, are for signal intensities normalized to β-actin; P values calculated by two-sample t test applied to log-transformed data, n = 5. (F) Representative images (scale bars, 10 μm) show basal γH2AX (red) and DAPI (blue) in specified PDX lines in vitro; graphs (right) showing mean (±SD) for γH2AX positivity (≥10 foci per nucleus) in PDX lines stratified into TP53-mutant and TP53-WT groups; P values by two-sample t test, n = 3.
Fig. 7.
Fig. 7.. Loss of p53 transactivation function promotes endogenous ATM and HR activity.
(A) Immunoblots (left) showing effect of constitutively overexpressed dominant-negative p53 (p53DD) on endogenous and RT-induced KAP1 phosphorylation and p21 expression in GBM14 cells in vitro; KAP1 and β-actin served as loading controls; floating bar plots (right), with line at mean, are for signal intensities normalized to β-actin analyzed by two-sample t test applied to log-transformed data, n = 3. (B) Representative images of endogenous γH2AX (red) in the nuclei (blue) of GBM14-GFP and GBM14-p53DD cells in vitro (scale bars,10 μm); bar graphs (right) showing means ± SEM for γH2AX (>10 foci per nucleus) positivity from three independent experiments; P values by two-sample t test, n = 8 or 9 view fields. (C) Immunoblots (left) showing effect of AZD1390 on RT-induced DNA damage signaling in GBM14-GFP and GBM14-p53DD cells in vitro, phosphorylated and total ATM, KAP1, and Chk2 and Chk1 proteins 48 hours after specified treatments; β-actin was loading control; floating bar plots (right), with line at mean, are for signal intensities normalized to β-actin; two-sample t test applied to log-transformed data, n = 3. (D) Floating bar plots (with line at mean) for relative NHEJ and HR efficiency in GBM14-GFP and GBM14-p53DD cells; each data point represents average of three independent measurements, P values by two-sample t test, n = 3. (E) Line graphs of relative confluence and YoYo-3 positivity over time in GBM14-GFP and GBM14-p53DD cells treated with (or without) 10 nM AZD1390 ± 2.5-Gy RT in vitro; arrow indicates data points analyzed by two-sample t test, n = 3.

References

    1. Miller KD, Ostrom QT, Kruchko C, Patil N, Tihan T, Cioffi G, Fuchs HE, Waite KA, Jemal A, Siegel RL, Barnholtz-Sloan JS, Brain and other central nervous system tumor statistics, 2021. CA Cancer J. Clin 71, 381–406 (2021). - PubMed
    1. Majd NK, Yap TA, Koul D, Balasubramaniyan V, Li X, Khan S, Gandy KS, Yung WKA, de Groot JF, The promise of DNA damage response inhibitors for the treatment of glioblastoma. Neurooncol. Adv 3, vdab015 (2021). - PMC - PubMed
    1. Helleday T, Petermann E, Lundin C, Hodgson B, Sharma RA, DNA repair pathways as targets for cancer therapy. Nat. Rev. Cancer 8, 193–204 (2008). - PubMed
    1. Huang RX, Zhou PK, DNA damage response signaling pathways and targets for radiotherapy sensitization in cancer. Signal Transduct. Target. Ther 5, 60 (2020). - PMC - PubMed
    1. Nickoloff JA, Taylor L, Sharma N, Kato TA, Exploiting DNA repair pathways for tumor sensitization, mitigation of resistance, and normal tissue protection in radiotherapy. Cancer Drug Resist. 4, 244–263 (2021). - PMC - PubMed

Publication types

LinkOut - more resources