. 2024 Feb 13;57(2):287-302.e12.
doi: 10.1016/j.immuni.2024.01.011.

Signaling via a CD27-TRAF2-SHP-1 axis during naive T cell activation promotes memory-associated gene regulatory networks

Affiliations

Signaling via a CD27-TRAF2-SHP-1 axis during naive T cell activation promotes memory-associated gene regulatory networks

Carla A Jaeger-Ruckstuhl et al. Immunity. .

Abstract

The interaction of the tumor necrosis factor receptor (TNFR) family member CD27 on naive CD8+ T (Tn) cells with homotrimeric CD70 on antigen-presenting cells (APCs) is necessary for T cell memory fate determination. Here, we examined CD27 signaling during Tn cell activation and differentiation. In conjunction with T cell receptor (TCR) stimulation, ligation of CD27 by a synthetic trimeric CD70 ligand triggered CD27 internalization and degradation, suggesting active regulation of this signaling axis. Internalized CD27 recruited the signaling adaptor TRAF2 and the phosphatase SHP-1, thereby modulating TCR and CD28 signals. CD27-mediated modulation of TCR signals promoted transcription factor circuits that induced memory rather than effector associated gene programs, which are induced by CD28 costimulation. CD27-costimulated chimeric antigen receptor (CAR)-engineered T cells exhibited improved tumor control compared with CD28-costimulated CAR-T cells. Thus, CD27 signaling during Tn cell activation promotes memory properties with relevance to T cell immunotherapy.

Keywords: CAR-T cell therapy; CD27; CD8(+) T cell; SHP-1 phosphatase; chimeric antigen receptor; costimulation; memory and effector fate determination; naive T cell activation.


Conflict of interest statement

Declaration of interests C.A.J.-R., C.E.C., and S.R.R. are inventors on a patent (“engineered trimeric CD70 proteins and uses thereof”; WO2021072127A3) filed by Fred Hutchinson Cancer Center and licensed by Lyell Immunopharma. S.R.R. was a founder, has served as an advisor, and has patents licensed to Juno Therapeutics; S.R.R is a founder of and holds equity in Lyell Immunopharma and has served on the advisory boards for Adaptive Biotechnologies and Nohla.

Figures
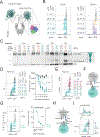
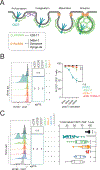
Figure 1 |
Figure 1 |. CD70 ligand binding induces rapid surface CD27 receptor down-modulation.
(A) Model of the Fc-fused dimer of assembled CD70 single chain trimers. (B) Representative histograms of a CFSE-dilution assay of non-activated (n.a.) or 72 h activated cells following stimulation with (left) αCD3 and CD70DT or (right) combinations of αCD3, αCD28 and CD70DT [αCD3|αCD28|CD70DT; μg/mL]. (C) Western blot of lysates from CD8+ Tn that were n.a. or activated with the indicated concentrations of αCD3+αCD28+CD70DT for 5 min, 15 min, 24 h and 72 h. Blots for CD27 (full-length 55kDa and cleaved 28–32 kDa) and beta 2 microglobulin (B2M) loading control are shown for each stimulation condition. (D) (Left) Representative histogram and (right) quantification of CD27 surface expression on n.a. and activated CD8+ Tn (n=4 donors). (E) Representative histogram showing down-modulation of CD27 surface expression induced by CD70DT requires αCD3 stimulation. (F) Illustration of K32 APC and T cell activation. (G) (Left) Representative histogram and (right) quantification of CD27 surface expression on CD8+ Tn co-cultured [1:1] with αCD3-coated (5 μg/mL) K32 or CD70-transgene expressing K32 cells (n=3 donors). (H) Illustration of BM derived Ova-presenting DC and OT1 T cell activation. (I) Representative histogram showing CD27 surface expression on murine OT-1 CD8+ Tn co-cultured [2:1] with activated murine BM derived OVA-presenting DCs in the presence of IgG or αCD70-blocking antibody (FR70). Representative experiment is shown. Data are shown as mean ± s.e.m. and analyzed by one-way ANOVA (D,G). Illustrations (C,F,H) created using BioRender. See also Figure S1.
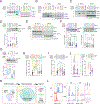
Figure 2 |
Figure 2 |. CD27 surface expression is regulated by clathrin-mediated endocytosis.
(A) Illustration of clathrin-mediated CD27 receptor endocytosis (CME). (B) (Left) Representative histogram and (right) quantification of CD27 surface expression of non-activated (n.a.) and activated (2–15 min) CD8+ Tn treated ±CME inhibitors (CMEi) ES9–17 (100 μM), Mdivi-1 (50 μM) or a combination of both (right: n=5 donors). (C) (Left) Representative histogram of fixed and permeabilized T cells and (right) quantification of total cellular CD27 in n.a. or 10 min activated CD8+ Tn treated ±CMEi, autophagy inhibitor (ULK-101; 5 μM) or proteasome inhibitor (Lactacystin; 20 μM) (n=5–28 donors). Data are shown as mean ± s.e.m. and analyzed by one-way ANOVA (B) or paired two-tailed Student’s t-test (C). Illustration (A) created using BioRender. See also Figure S2.
Figure 3 |
Figure 3 |. CD27-TRAF2-SHP-1 modulates Lck and downstream signaling induced by αCD3+αCD28.
(A) TRAF2 immunoprecipitation of lysates from non-activated (n.a.) and 10 min activated CD8+ Tn at indicated doses of αCD3, αCD28 and CD70DT [αCD3|αCD28|CD70DT; μg/mL]. Immunoblots for TRAF2, CD27, B2M are shown. (B) TRAF2 immunoprecipitation of lysates from n.a. and CD8+ Tn activated for 10 min under the indicated conditions and treated with Latrunculin A (LatA, 0.05 μM) or DMSO. Immunoblots for TRAF2, CD27, GAPDH are shown (1 representative donor of n=3). (C) TRAF2 immunoprecipitation of lysates from n.a. and CD8+ Tn activated for 10 min under the indicated conditions. Immunoblots for TRAF2, CD27, SHP-1, B2M are shown (n=1). (D) Representative immunoblots of lysates from n.a. and CD8+ Tn activated for 10 min under the indicated conditions for phospho-SHP-1(Y564) and B2M. Fold-change of band intensity over B2M loading control was calculated (n=4 donors). (E) SHP-1 immunoprecipitation of lysates from n.a. and 10 min activated CD8+ Tn. Immunoblots for SHP-1, phospho-SHP-1(Y564), Lck, GAPDH are shown (1 representative donor of n=2). (F) Representative immunoblots of lysates from n.a. and 10 min activated CD8+ Tn for Lck, phospho-Lck (Y394, Y505) and B2M. Fold-change of band intensity over B2M loading control was calculated (n=8–12 donors for Y394 and n=4–6 donors for Y505). (G) Immunoblots of lysates from n.a. and 10 min activated CD8+ Tn treated with SHP-1 inhibitor (TPI-1, 0.4 μM) or DMSO for total Lck, phospho-Lck(Y394), and B2M. Fold-change of band intensity over B2M loading control was calculated (n=5 donors). (H,I) Frequency of phosphor-ERK1/2 (T202, Y204) positive T cells in n.a. and 15 min activated CD8+ Tn assessed by phosphor-flow (H: n=14 donors, I: n=13 donors). (J) (Left) Representative histogram and (right) quantification of phospho-ERK1/2 (T202, Y204) in n.a. and 15 min CD8+ Tn treated with DMSO or TPI-1 (0.4 μM) by phospho-flow (n=8 donors). (K) Illustration of CRISPR-Cas9-based SHP-1 knock-out in human CD8+ Tn cells and culture conditions. (L) Flow cytometry-based assessment of (left) SHP-1 expression in wildtype (WT, blue) or SHP-1 deficient (KO, red) CD8+ Tn cells and (right) frequency of phospho-ERK1/2 (T202, Y204) positive T cells in n.a. and WT and KO CD8+ Tn activated for 15 min under the indicated conditions (1 representative donor of n=2). All data are shown as mean ± s.e.m. and were analyzed by paired two-tailed Student’s t-test (D,F-J). Illustrations in (K) created using BioRender. See also Figure S3.
Figure 4 |
Figure 4 |. CD27 costimulation promotes memory characteristics.
CD8+ Tn are activated under various conditions of plate-bound [αCD3|αCD28|CD70DT; μg/mL] or αCD3+αCD28 beads [at 3:1 bead:cell ratio] for 72 h and expanded for 9 days. (A) Cell cycle analysis was performed at 48 h and 96 h using 7-AAD nucleic acid stain to determine the fraction of cells in G0+G1, S, G2+M (n=3–10 donors). (B) Fold-expansion over input of activated CD8+ Tn at respective timepoints (n=3–10 donors). (C) (Left) Representative contour plots showing CD27 and TCF1 expression in CD8+ T cells 9 days after stimulation and (right) quantified fraction of CD27+TCF1+ cells (n=5–10 donors, 2 independent experiments). (D) MFI of CD127 and CCR7 surface expression 9 days after stimulation (n=5 donors). (E) Percent expression of CD45RA and CD45RO on T cells expanded for 9 days is shown (n=4–11 donor of 3 independent experiments). (F) [13C] glucose uptake from media by CD8+ Tn at various timepoints after stimulation (n=3 donors). Ion counts normalized to timepoint 0 h. (G) Seahorse-based glucose stress test (left) assessing changes in extracellular acidification (ECAR) and (right) measuring glycolytic capacity of CD8+ T cells 5 days after stimulation (1 representative donor à 10 replicate wells). Glucose, oligomycin (oligo) and 2-Deoxy-D-glucose (2-DG) were added as indicated. (H) Seahorse-based mitochondrial stress test (left) assessing changes in oxygen consumption rate (OCR) and (right) measuring spare respiratory capacity of CD8+ T 10 days after stimulation (1 representative donor à 10 replicate wells). Oligomycin (oligo), phenylhydrazone (FCCP) and rotenone and antimycine A (Rot+AA) were added as indicated. All data are shown as mean ± s.e.m. and were analyzed by two-way ANOVA (A,B,F), paired (C,D,E) and unpaired (G,H) two-tailed Student’s t-test. Illustration in (A) created using BioRender. See also Figure S4.
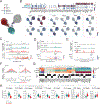
Figure 5 |
Figure 5 |. CD27 costimulation induces distinct gene regulatory circuits early after T cell activation.
Single cell multiome-seq of CD8+ Tn that are non-activated (n.a.) and activated for 24 h with αCD3+αCD28 beads [at 3:1 bead:cell ratio] or plate-coated αCD3+αCD28+CD70DT ([5|0|5]; μg/mL) (n=1 donor). (A) Subclustered UMAP and (B) top differentially expressed genes in respective subclusters of single cell RNA-seq data. (C-F) ATAC-seq of the 3 main clusters showing (C-E) coverage plots of FOXP1, STAT1 and IFNG gene loci and linked (red=repressive, blue=activating) promoter regulatory gene peaks. (F) ATAC-footprints of TBX21 and NFATC2 transcription factor motifs. (G,H) Combined RNA-seq and ATAC-seq showing (G) heatmap-based correlation of RNA expression to DNA accessibility of indicated top-regulated transcription factors and (H) inferred target gene regulation of selected transcription factors. See also Figures S5 and S6.
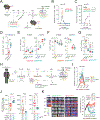
Figure 6 |
Figure 6 |. CD27 costimulation of CAR-T cells during manufacturing improves in vivo function.
(A) Murine B cell aplasia model. Murine CD45.1+CD8+ T cells were isolated from spleen, activated with plate-coated αCD3 [1 μg/mL] and αCD28 or CD70DT [each at 1 μg/mL], transduced with a retrovirus encoding a mCD19_4-1BB_CD3ζ CAR and EGFRt (transduction marker), and transferred at a cell dose of 1×10⁶ into lymphodepleted (Cytoxan) CD45.2+ C57BL/6 mice. (B) Quantification of EGFRt+CD8+ CAR-T cells in peripheral blood of mice (n=12–13, 2 pooled experiments). (C) Monitoring of CD19+ B cells in the peripheral blood of CAR-T cell infused or control mice (B cell reconstitution cut-off >= 1%). (D) Quantification of EGFRt+CD8+ CAR-T cells in peripheral blood of mice 71 days post infusion (n=5 mice). (E-G) (E) TCF1 and (F,G) Ki67 expression in EGFRt+CD45.1+ or non-transduced (nTd) EGFRtCD45.1+ T cells in BM and spleen harvested at day 4 (E,F) and BM harvested at day 21 (G) after adoptive transfer (AdTf) (n=4–5 mice per timepoint and group). (H) Raji-lymphoma xenograft model. Human bulk CD8+ T cells were isolated from peripheral blood of healthy donors, activated with plate-coated αCD3+αCD28+CD70DT ([5|0|5]; μg/mL) or αCD3+αCD28 beads [at a 3:1 bead:cell ratio] prior to transduction with a lentivirus encoding a hCD19_4–1BB_CD3ζ CAR and EGFRt. T cells were transferred at a dose of 0.7×10⁵ to tumor bearing mice. (I) Frequency of EGFRt+CD8+ CAR-T cells per total human CD45+ T cells in peripheral blood of mice. (J) Cell surface phenotype of peripheral blood EGFRt+CD8+ CAR-T cells 7 days post infusion. (K) Bioluminescence imaging of ffluc+ Raji cells in control (untreated) or CAR-T cell treated mice. (I-K) n=9 mice per group. All data are shown as mean ± s.e.m. and were analyzed by Log-Rank (Mantle-Cox) test (C), Turkey’s multiple comparison test (B,I), unpaired two-tailed Student’s t-test (D-G,J) and two-way ANOVA (K). Illustrations in (A,H) created using BioRender. See also Figure S7 & Figure S8.

References

    1. Wiesmann A, Phillips RL, Mojica M, Pierce LJ, Searles AE, Spangrude GJ, and Lemischka I (2000). Expression of CD27 on murine hematopoietic stem and progenitor cells. Immunity 12, 193–199. 10.1016/s1074-7613(00)80172-7. - DOI - PubMed
    1. Hintzen RQ, de Jong R, Lens SM, Brouwer M, Baars P, and van Lier RA (1993). Regulation of CD27 expression on subsets of mature T-lymphocytes. J Immunol 151, 2426–2435. - PubMed
    1. van Lier RA, Borst J, Vroom TM, Klein H, Van Mourik P, Zeijlemaker WP, and Melief CJ (1987). Tissue distribution and biochemical and functional properties of Tp55 (CD27), a novel T cell differentiation antigen. J Immunol 139, 1589–1596. - PubMed
    1. Hamann D, Baars PA, Rep MH, Hooibrink B, Kerkhof-Garde SR, Klein MR, and van Lier RA (1997). Phenotypic and functional separation of memory and effector human CD8+ T cells. J Exp Med 186, 1407–1418. 10.1084/jem.186.9.1407. - DOI - PMC - PubMed
    1. Gattinoni L, Speiser DE, Lichterfeld M, and Bonini C (2017). T memory stem cells in health and disease. Nat Med 23, 18–27. 10.1038/nm.4241. - DOI - PMC - PubMed

Publication types

MeSH terms

Substances