. 2024 Apr 2;36(4):808-821.e6.
doi: 10.1016/j.cmet.2024.01.013. Epub 2024 Feb 14.

SLC25A51 decouples the mitochondrial NAD+/NADH ratio to control proliferation of AML cells

Affiliations

SLC25A51 decouples the mitochondrial NAD+/NADH ratio to control proliferation of AML cells

Mu-Jie Lu et al. Cell Metab. .

Abstract

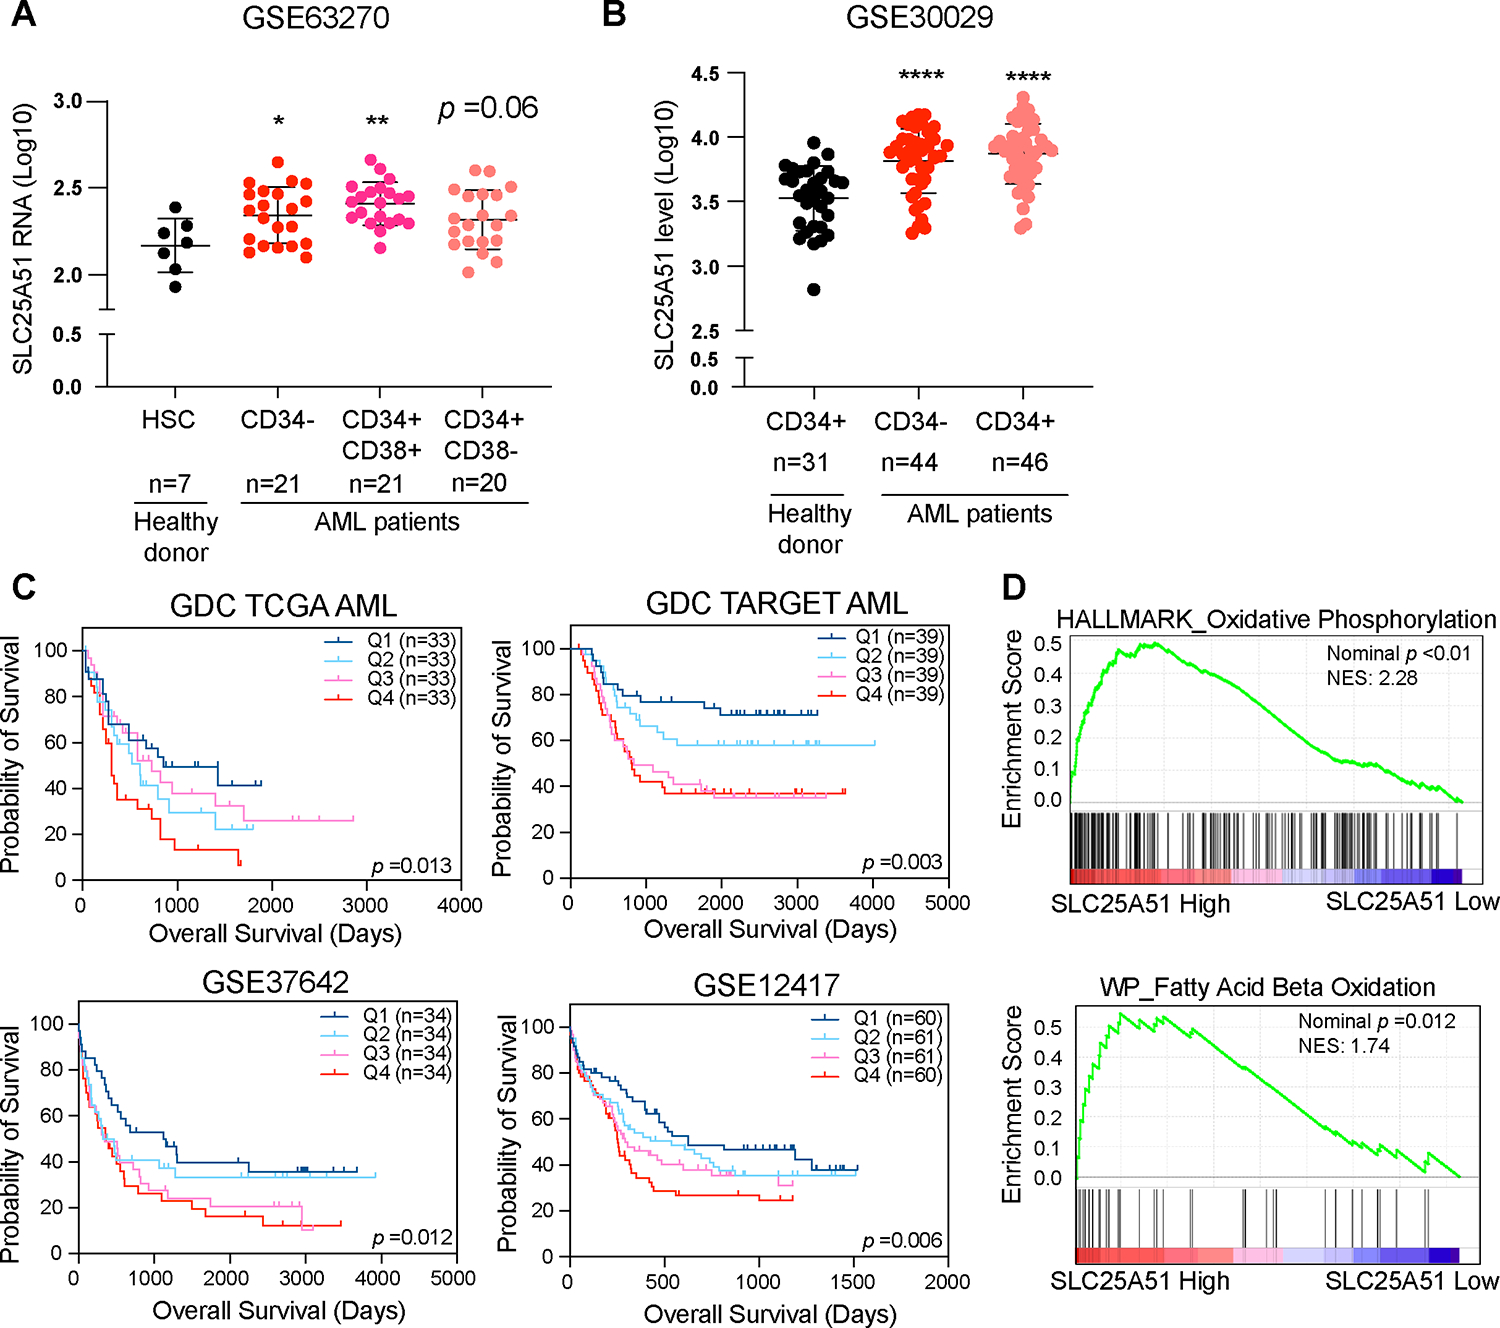
SLC25A51 selectively imports oxidized NAD+ into the mitochondrial matrix and is required for sustaining cell respiration. We observed elevated expression of SLC25A51 that correlated with poorer outcomes in patients with acute myeloid leukemia (AML), and we sought to determine the role SLC25A51 may serve in this disease. We found that lowering SLC25A51 levels led to increased apoptosis and prolonged survival in orthotopic xenograft models. Metabolic flux analyses indicated that depletion of SLC25A51 shunted flux away from mitochondrial oxidative pathways, notably without increased glycolytic flux. Depletion of SLC25A51 combined with 5-azacytidine treatment limits expansion of AML cells in vivo. Together, the data indicate that AML cells upregulate SLC25A51 to decouple mitochondrial NAD+/NADH for a proliferative advantage by supporting oxidative reactions from a variety of fuels. Thus, SLC25A51 represents a critical regulator that can be exploited by cancer cells and may be a vulnerability for refractory AML.

Keywords: AML; MCART1; SLC25A51; glutamine utilization; oxidative mitochondria; tumor metabolism.


Conflict of interest statement

Declaration of interests The authors declare no competing interests.

Figures

Figure 1.
Figure 1.. Elevated expression of SLC25A51 in patients with AML.
(A) SLC25A51 mRNA expression in hematopoietic stem cell (HSC) from healthy donors and leukemic blasts (Lin− CD34−), progenitors (CD34+ CD38+), and multipotent cells (CD34+ CD38−) from patients with AML; data from GSE63270. Mean ± SD; ANOVA p =0.006, Dunnett’s post-hoc test, *p <0.05; **p <0.01. (B) SLC25A51 gene expression in normal CD34+ cells compared with leukemic CD34− and CD34+ cells; data from GSE30029. Mean ± SD; ANOVA p <0.0001, Dunnett’s post-hoc test, ****p <0.0001. (C) Kaplan-Meier curves for survival outcomes striated by AML transcriptome datasets (TCGA, TARGET, GSE37642, and GSE12417). Patients were divided into four quadrants according to SLC25A51 mRNA expression. Q1 represents the lowest 25% (shown as dark blue) and Q4 represents the highest 25% (shown as red). Indicated p values were determined by log-rank test. (D) GSEA of mitochondrial metabolic signatures including oxidative phosphorylation and fatty acid oxidation identified by Broad Institute database was performed using TCGA AML transcriptome of cells expressing high (top 25%) vs low (bottom 25 %) levels of SLC25A51 gene. See also Figure S1.
Figure 2.
Figure 2.. SLC25A51 is required for AML cell proliferation and survival in vitro.
(A) Growth curves in leukemic cells expressing shSLC25A51 or shGFP (control). Cell counts were measured at indicated times by flow cytometry, mean ± SD (n = 2–3). (B) Western blotting results for SLC25A51 in shSLC25A51 and shGFP expressing AML cells. (C) Clonogenic assays of shSLC25A51 or shGFP expressing AML cells performed in methylcellulose medium. Colony numbers were assessed on day 14 after plating, mean ± SD (n = 2–4). (D) Apoptotic rates in MOLM-13 cells expressing shSLC25A51 or shGFP were measured by flow cytometry using Annexin V-FITC and Propidium Iodide (PI) double staining and depicted as relative percentages of viable (Annexin V−/PI−), early-stage apoptotic (Annexin V+/PI−), late-stage apoptotic (Annexin V+/PI+), and dead cells (Annexin V−/PI+); mean ± SD (n = 3). (E) Mitochondrial free NAD+ levels in MOLM-13 cells expressing shSLC25A51 or shControl scrambled control were measured by mitochondrially-targeted NAD+ biosensors (n = 12). The fluorescence ratios (488 nm/405 nm) measured by flow cytometry were normalized to cpVenus whose fluorescence is unaffected by NAD+ levels. (F) Growth curves of MOLM-13 cells expressing shSLC25A51 or shGFP control in the presence or absence of yeast mitochondrial NAD+ transporter, Ndt1; mean ± SD (n = 3). (G) Colony forming cell assay and western blot of human bone marrow mononuclear cells transduced with shScramble or shSLC25A51. Colony numbers were assessed on day 14 after seeding in methylcellulose medium, mean ± SD (n = 3). p values in this figure were determined by unpaired, two-tailed Student’s t-test (for two groups) or ANOVA with multiple comparisons analysis using Dunnett’s post-hoc analyses (for groups of three). *p <0.05, **p <0.01, ***p <0.001, and ****p <0.0001 versus control. See also Figure S2 and Table S2.
Figure 3.
Figure 3.. SLC25A51 depletion limits AML cell expansion in vivo.
(A) Tumor growth was monitored every 3 to 4 days by bioluminescence imaging in U937-engrafted female mice with early dox treatment. (B) Luminescent intensity of photons emitted from each female mouse in the images was quantified during the period of experiment. (C) Spleen weight of U937-engrafted female mice with early dox treatment, mean ± SD (n = 4–10). (D) Leukemia burden was measured using mCD45/hCD45+ markers by flow cytometry in spleen dissected from U937-engrafted female mice with early dox treatment, mean ± SD (n = 4–10). (E) Kaplan-Meier analysis of survival of U937-engrafted male mice with early dox treatment, p <0.0001, log-rank test. (F) Spleen weight of U937-engrafted female mice with late dox treatment, mean ± SD (n = 3–5). (G) Leukemia burden was measured using mCD45/hCD45+ markers by flow cytometry in spleen dissected from U937-engrafted female mice with late dox treatment, mean ± SD (n = 3–5). (H) Kaplan-Meier analysis of survival of U937-engrafted male mice with late dox treatment, p <0.0001, log-rank test. p values in this figure were determined by ANOVA with postdoc Dunnett’s multiple comparisons analysis (for groups of more than three). *p <0.05, **p <0.01, ***p <0.001, and ****p <0.0001 versus control. See also Figure S3.
Figure 4.
Figure 4.. Depletion of SLC25A51 targets oxidative mitochondrial processes.
(A) Mitochondrial NAD+/NADH ratio was determined in shSLC25A51 or shGFP expressing U937 cells using NAD/NADH-Glo assay. mean ± SD (n = 3). (B) CoQ10H2/CoQ10 ratio and total levels were measured in shSLC25A51 or shGFP expressing U937 cells using UHPLC-MS/MS; mean ± SD (n = 4). (C) Schematic depiction of the oxidative (blue) and reductive (red) TCA metabolites derived from [13C5,15N2]-glutamine tracing experiments. (D) Stable isotope-resolved metabolomics analysis performed in U937 cells expressing either shSLC25A51 and shGFP and equilibrated with media-containing [13C5,15N2]-glutamine for 24h. Fractional labeling of M+0 succinate, fumarate, malate, and citrate; mean ± SD (n = 4). (E) Fractional labeling of 2-oxoglutarate (M+5) and oxidative TCA metabolites including succinate (M+4), fumarate (M+4), malate (M+4), citrate (M+4), and 2-oxoglutarate (M+3); mean ± SD (n = 4). (F) Fractional labeling of reductive TCA metabolites including citrate (M+5) and aspartate (M+3) derived from [13C5,15N2]-glutamine; mean ± SD (n = 4). (G) The total levels of L-aspartate in shSLC25A51 and shGFP expressing U937 cells was measured by UHPLC-MS/MS; mean ± SD (n = 4). (H) The percentage of aspartate derived from [13C5,15N2]-glutamine in shSLC25A51 and shGFP control U937 cells were measured by UHPLC-MS/MS; mean ± SD (n = 4). (I) The ratio of oxidative to reductive TCA metabolites including fumarate, malate, aspartate, and citrate derived from [13C5,15N2]-glutamine in Hap1 SLC25A51 WT, KO, and KO + sc. Ndt1 cells; mean ± SD (n = 3–4). (J) Growth curves of shSLC25A51 or shGFP expressing MOLM-13 cells in the presence or absence of mitoLbNOX. Data shown as mean ± SD (n = 3–6). p values in this figure were determined by unpaired, two-tailed Student’s t-test (for two groups) or ANOVA with post hoc Dunnett’s multiple comparisons analysis (for groups of three). *p <0.05, **p <0.01, ***p <0.001, and ****p <0.0001 versus control. See also Figure S4.
Figure 5.
Figure 5.. Depletion of SLC25A51 has minimal effect on glycolysis in AML cells.
(A) Total intracellular levels of glucose, glucose-6-phosphate (G6P), glyceraldehyde-3-phosphate (G3P), pyruvate and lactate in shSLC25A51 and shGFP expressing U937 cells were measured by UHPLC-MS/MS. Data shown as mean ± SD (n = 4). (B) Total cellular levels of AMP and GMP in shSLC25A51 and shGFP expressing U937 cells, measured by UHPLC-MS/MS. Data shown as mean ± SD (n = 4). (C) Schematic mapping for [U-13C]-glucose tracing into glycolysis and the TCA cycle via PC (green carbons) and PDH (blue carbons). (D) Fractional labeling of glycolytic intermediates including glucose-6-phosphate (G6P, M+6) and fructose 1,6-bisphosphate (FBP, M+6) derived from [U-13C]-glucose; mean ± SD (n = 4). (E) The ratio of citrate M+3/pyruvate M+3 (PC-dependent) and citrate M+2/pyruvate M+3 (PDH-dependent) in shSLC25A51 and shGFP expressing U937 cells; mean ± SD (n = 4). (F) Fractional labeling of glycolytic intermediates including phosphoenolpyruvic acid (PEP, M+3), Pyruvate (Pyr, M+3), and Lacate (Lac, M+3) derived from [U-13C]-glucose; mean ± SD (n = 4). p values in this figure were determined by unpaired, two-tailed Student’s t-test. ***p <0.001, and ****p <0.0001 versus control.
Figure 6.
Figure 6.. Combination of shSLC25A51 with current therapies.
(A) Growth curves of shSLC25A51 or shGFP expressing U937 cells grown with 2 mM or without glutamine. Cell counts were measured at indicated times by flow cytometry; mean ± SD (n = 3). (B) Growth curves of shSLC25A51 or shGFP expressing U937 cells treated with 1 μM CB-839. Cell counts were measured as above; mean ± SD (n = 3). (C) Growth curve of shSLC25A51 or shGFP expressing U937 cells treated with 0.1 μM 5-Azacytidine. Cell counts were measured as above; mean ± SD (n = 3). (D) Tumor growth was monitored weekly by bioluminescence imaging in U937-engrafted female mice treated with doxycycline to induce shSLC25A51 or shScramble combined with 3 mg/kg 5-Azacytidine or vehicle. (E) Luminescent intensity of photons emitted from each female mouse in the images was quantified during the period of experiment. (F) Leukemia burden was measured using mCD45/hCD45+ markers by flow cytometry in bone marrow dissected from U937-engrafted female mice, mean ± SD (n = 3–5). (G) Leukemia burden was measured using mCD45/hCD45+ markers by flow cytometry in spleen dissected from U937-engrafted female mice, mean ± SD (n = 3–5). (H) Kaplan-Meier analysis of survival of U937-engrafted male mice treated with 5-Azacytidine or vehicle, p <0.0001, log-rank test. p values in this figure were determined by unpaired, two-tailed Student’s t-test at end point. *p <0.05, **p <0.01, ***p <0.001, and ****p <0.0001 versus control. See also Figure S5, Table S3, and Table S4.

References

    1. Pachnis P, Wu Z, Faubert B, Tasdogan A, Gu W, Shelton S, Solmonson A, Rao AD, Kaushik AK, Rogers TJ, et al. (2022). In vivo isotope tracing reveals a requirement for the electron transport chain in glucose and glutamine metabolism by tumors. Sci. Adv. 8, eabn9550. 10.1126/sciadv.abn9550. - DOI - PMC - PubMed
    1. Martínez-Reyes I, Cardona LR, Kong H, Vasan K, McElroy GS, Werner M, Kihshen H, Reczek CR, Weinberg SE, Gao P, et al. (2020). Mitochondrial ubiquinol oxidation is necessary for tumour growth. Nature 585, 288–292. 10.1038/s41586-020-2475-6. - DOI - PMC - PubMed
    1. Molina JR, Sun Y, Protopopova M, Gera S, Bandi M, Bristow C, McAfoos T, Morlacchi P, Ackroyd J, Agip A-NA, et al. (2018). An inhibitor of oxidative phosphorylation exploits cancer vulnerability. Nat. Med. 24, 1036–1046. 10.1038/s41591-018-0052-4. - DOI - PubMed
    1. Panina SB, Pei J, Baran N, Konopleva M, and Kirienko NV (2020). Utilizing Synergistic Potential of Mitochondria-Targeting Drugs for Leukemia Therapy. Front Oncol 10. 10.3389/fonc.2020.00435. - DOI - PMC - PubMed
    1. Garcia-Bermudez J, Baudrier L, La K, Zhu XG, Fidelin J, Sviderskiy VO, Papagiannakopoulos T, Molina H, Snuderl M, Lewis CA, et al. (2018). Aspartate is a limiting metabolite for cancer cell proliferation under hypoxia and in tumours. Nat Cell Biol 20, 775–781. 10.1038/s41556-018-0118-z. - DOI - PMC - PubMed

LinkOut - more resources