

Targeting oxidative phosphorylation to increase the efficacy of immune-combination therapy in renal cell carcinoma
- PMID: 38355278
- PMCID: PMC10868282
- DOI: 10.1136/jitc-2023-008226
Targeting oxidative phosphorylation to increase the efficacy of immune-combination therapy in renal cell carcinoma
Erratum in
-
Correction: Targeting oxidative phosphorylation to increase the efficacy of immune-combination therapy in renal cell carcinoma.J Immunother Cancer. 2024 Mar 5;12(3):e008226corr1. doi: 10.1136/jitc-2023-008226corr1. J Immunother Cancer. 2024. PMID: 38448039 Free PMC article. No abstract available.
Abstract
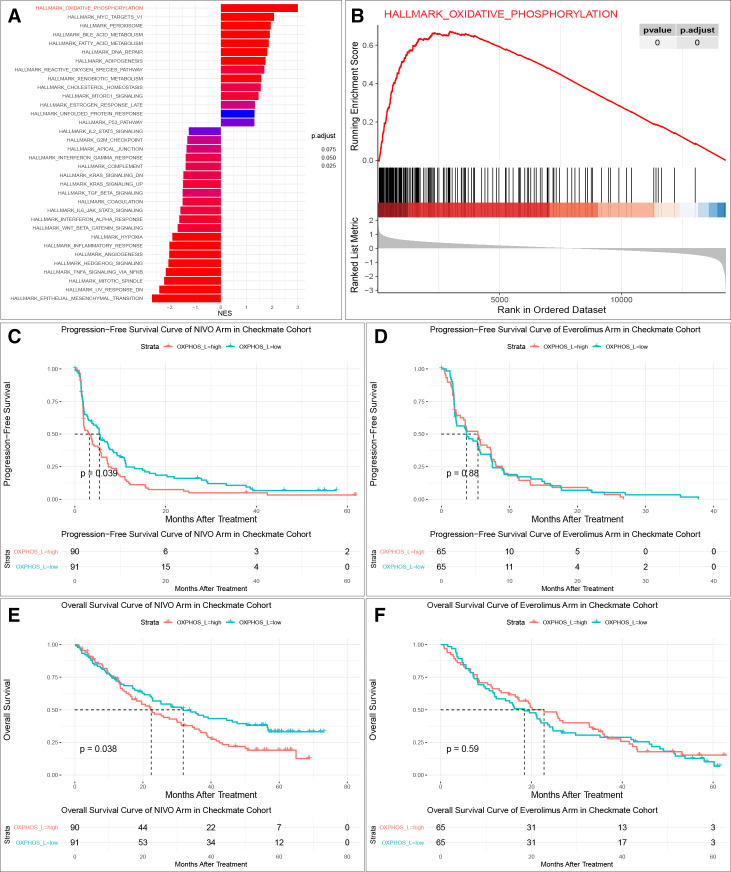
Background: Immune checkpoint inhibitors (ICIs) are the standard of care for metastatic renal cell carcinoma (RCC); however, most patients develop de novo or acquired resistance to ICIs. Oxidative phosphorylation (OXPHOS) has been rarely explored as a potential target for correcting ICI resistance.
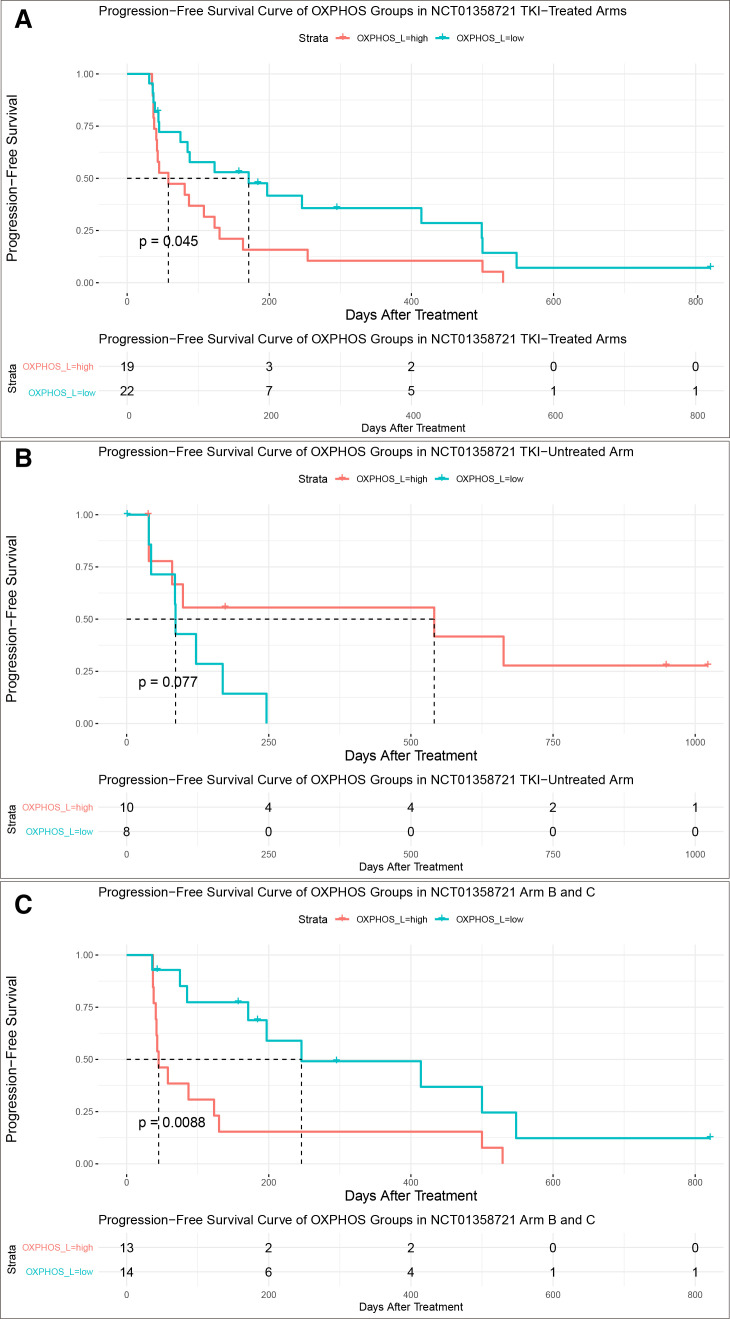
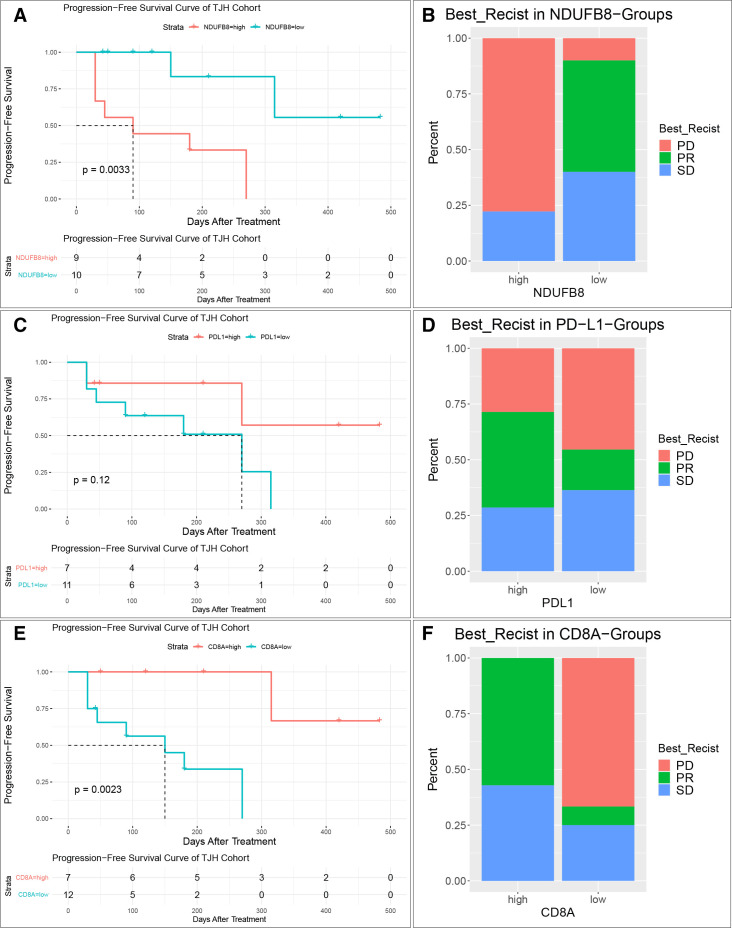
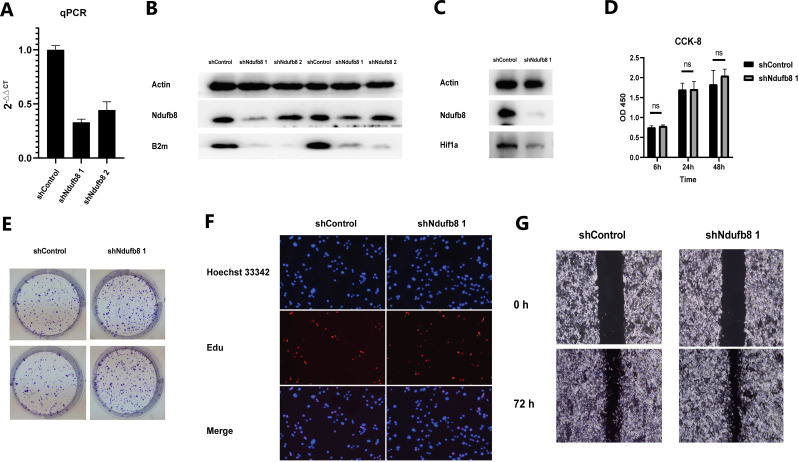
Methods: We systematically analyzed RNA sequencing and clinical data from CheckMate, JAVELIN Renal 101, and NCT01358721 clinical trials, and clinicopathological data of 25 patients from Tongji Hospital to investigate the relationship between OXPHOS and ICI resistance. The Ndufb8-knockdown Renca cell line was derived to determine the effect of OXPHOS on RCC immunotherapy in vivo.
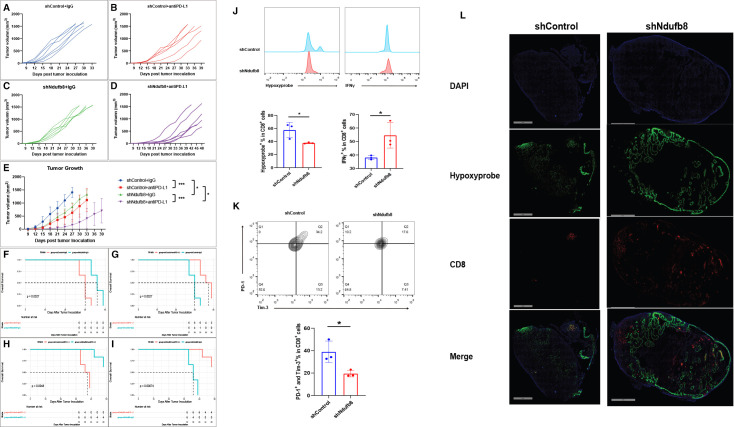
Results: An analysis of the CheckMate series data revealed that high OXPHOS levels are risk factors for ICI in patients with RCC, but are affected by thevon Hippel-Lindau protein (VHL) and hypoxia-inducible factor-1α status. This result is consistent with correlation between clinicopathological characteristics and prognostic observations at our institute. Knockdown of the mitochondrial complex I subunit Ndufb8 of the Renca cell line had no effect on cell growth and migration in vitro, but slowed down cell growth in vivo. Among anti-programmed death ligand 1 (PD-L1)-treated BALB/c mice, shNdufb8 Renca tumors grew slower than shControl Renca tumors and the corresponding mice survived longer. Flow cytometry revealed that CD8+ T cells in shNdufb8 Renca tumors, which were exposed to a lower degree of hypoxia and expressed less programmed death-1 (PD-1) and T-cell immunoglobulin domain and mucin domain 3 (TIM-3), secreted more interferon-γ after stimulation. Immunofluorescence demonstrated that the shNdufb8 Renca tumors had a higher proportion of CD8+ T cells and the proportion of these cells was lower in the hypoxic area.
Conclusions: OXPHOS is a reliable predictor of immunotherapy response in RCC and is more pronounced in metastatic lesions. RCC cells generate a hypoxic tumor microenvironment and inhibit T-cell function through oxidative metabolism, thereby leading to immunotherapy resistance.
Keywords: Immunotherapy; Metabolic Networks and Pathways; Renal Cell Carcinoma.
© Author(s) (or their employer(s)) 2024. Re-use permitted under CC BY-NC. No commercial re-use. See rights and permissions. Published by BMJ.
Conflict of interest statement
Competing interests: No, there are no competing interests.
Figures

Similar articles
-
T-cell responses and combined immunotherapy against human carbonic anhydrase 9-expressing mouse renal cell carcinoma.Cancer Immunol Immunother. 2022 Feb;71(2):339-352. doi: 10.1007/s00262-021-02992-7. Epub 2021 Jun 23. Cancer Immunol Immunother. 2022. PMID: 34160685 Free PMC article.
-
Inhibition of Tumor Growth and Sensitization to Sunitinib by RNA Interference Targeting Programmed Death-ligand 1 in Mouse Renal Cell Carcinoma RenCa Model.Anticancer Res. 2019 Sep;39(9):4737-4742. doi: 10.21873/anticanres.13656. Anticancer Res. 2019. PMID: 31519573
-
Transcutaneous Imiquimod Combined With Anti-Programmed Cell Death-1 Monoclonal Antibody Extends the Survival of Mice Bearing Renal Cell Carcinoma.Cancer Med. 2025 May;14(10):e70966. doi: 10.1002/cam4.70966. Cancer Med. 2025. PMID: 40371846 Free PMC article.
-
Next Wave of Targets in the Treatment of Advanced Renal Cell Carcinoma.Curr Oncol. 2022 Jul 30;29(8):5426-5441. doi: 10.3390/curroncol29080429. Curr Oncol. 2022. PMID: 36005167 Free PMC article. Review.
-
Hyper-interleukin-11 novel designer molecular adjuvant targeting gp130 for whole cell cancer vaccines.Expert Opin Biol Ther. 2011 Dec;11(12):1555-67. doi: 10.1517/14712598.2011.627852. Epub 2011 Oct 14. Expert Opin Biol Ther. 2011. PMID: 21995459 Review.
Cited by
-
Integrative multi-omics reveal NSUN2 facilitates glycolysis and histone lactylation-driven immune evasion in renal carcinoma.Genes Immun. 2025 Aug;26(4):312-323. doi: 10.1038/s41435-025-00336-4. Epub 2025 May 24. Genes Immun. 2025. PMID: 40413354
-
The pathogenesis and therapeutic implications of metabolic reprogramming in renal cell carcinoma.Cell Death Discov. 2025 Apr 19;11(1):186. doi: 10.1038/s41420-025-02479-9. Cell Death Discov. 2025. PMID: 40253354 Free PMC article. Review.
-
Multiomics Analysis of Exportin Family Reveals XPO1 as a Novel Target for Clear Cell Renal Cell Carcinoma.Int J Genomics. 2025 Jan 21;2025:3645641. doi: 10.1155/ijog/3645641. eCollection 2025. Int J Genomics. 2025. PMID: 39882192 Free PMC article.
-
Integrated Multi-Level Investigation of Friend Leukemia Integration 1 Transcription Factor as a Novel Immune-Inflammatory Biomarker in Rheumatoid Arthritis: Bridging Bioinformatics, Clinical Cohorts, and Mechanistic Validation.J Inflamm Res. 2025 Mar 3;18:3105-3123. doi: 10.2147/JIR.S507941. eCollection 2025. J Inflamm Res. 2025. PMID: 40059948 Free PMC article.
-
Targeting tumor metabolism to augment CD8+ T cell anti-tumor immunity.J Pharm Anal. 2025 May;15(5):101150. doi: 10.1016/j.jpha.2024.101150. Epub 2024 Nov 20. J Pharm Anal. 2025. PMID: 40502640 Free PMC article. Review.
References
-
- Powles T, Plimack ER, Soulières D, et al. . Pembrolizumab plus axitinib versus sunitinib monotherapy as first-line treatment of advanced renal cell carcinoma (KEYNOTE-426): extended follow-up from a randomised, open-label, phase 3 trial. The Lancet Oncology 2020;21:1563–73. 10.1016/S1470-2045(20)30436-8 - DOI - PubMed
Publication types
MeSH terms
LinkOut - more resources
Full Text Sources
Medical
Research Materials