

Twenty-five year occupational homicide mortality trends in North Carolina: 1992-2017
- PMID: 38355295
- PMCID: PMC11322415
- DOI: 10.1136/ip-2023-044991
Twenty-five year occupational homicide mortality trends in North Carolina: 1992-2017
Abstract
Introduction: Determining industry of decedents and victim-perpetrator relationships is crucial to inform and evaluate occupational homicide prevention strategies. In this study, we examine occupational homicide rates in North Carolina (NC) by victim characteristics, industry and victim-perpetrator relationship from 1992 to 2017.
Methods: Occupational homicides were identified from records of the NC Office of the Chief Medical Examiner system and the NC death certificates. Sex, age, race, ethnicity, class of worker, manner of death, victim-perpetrator relationship and industry were abstracted. Crude and age-standardised homicide rates were calculated as the number of homicides that occurred at work divided by an estimate of worker-years (w-y). Rate ratios and 95% CIs were calculated, and trends over calendar time in occupational homicide rates were examined overall and by industry.
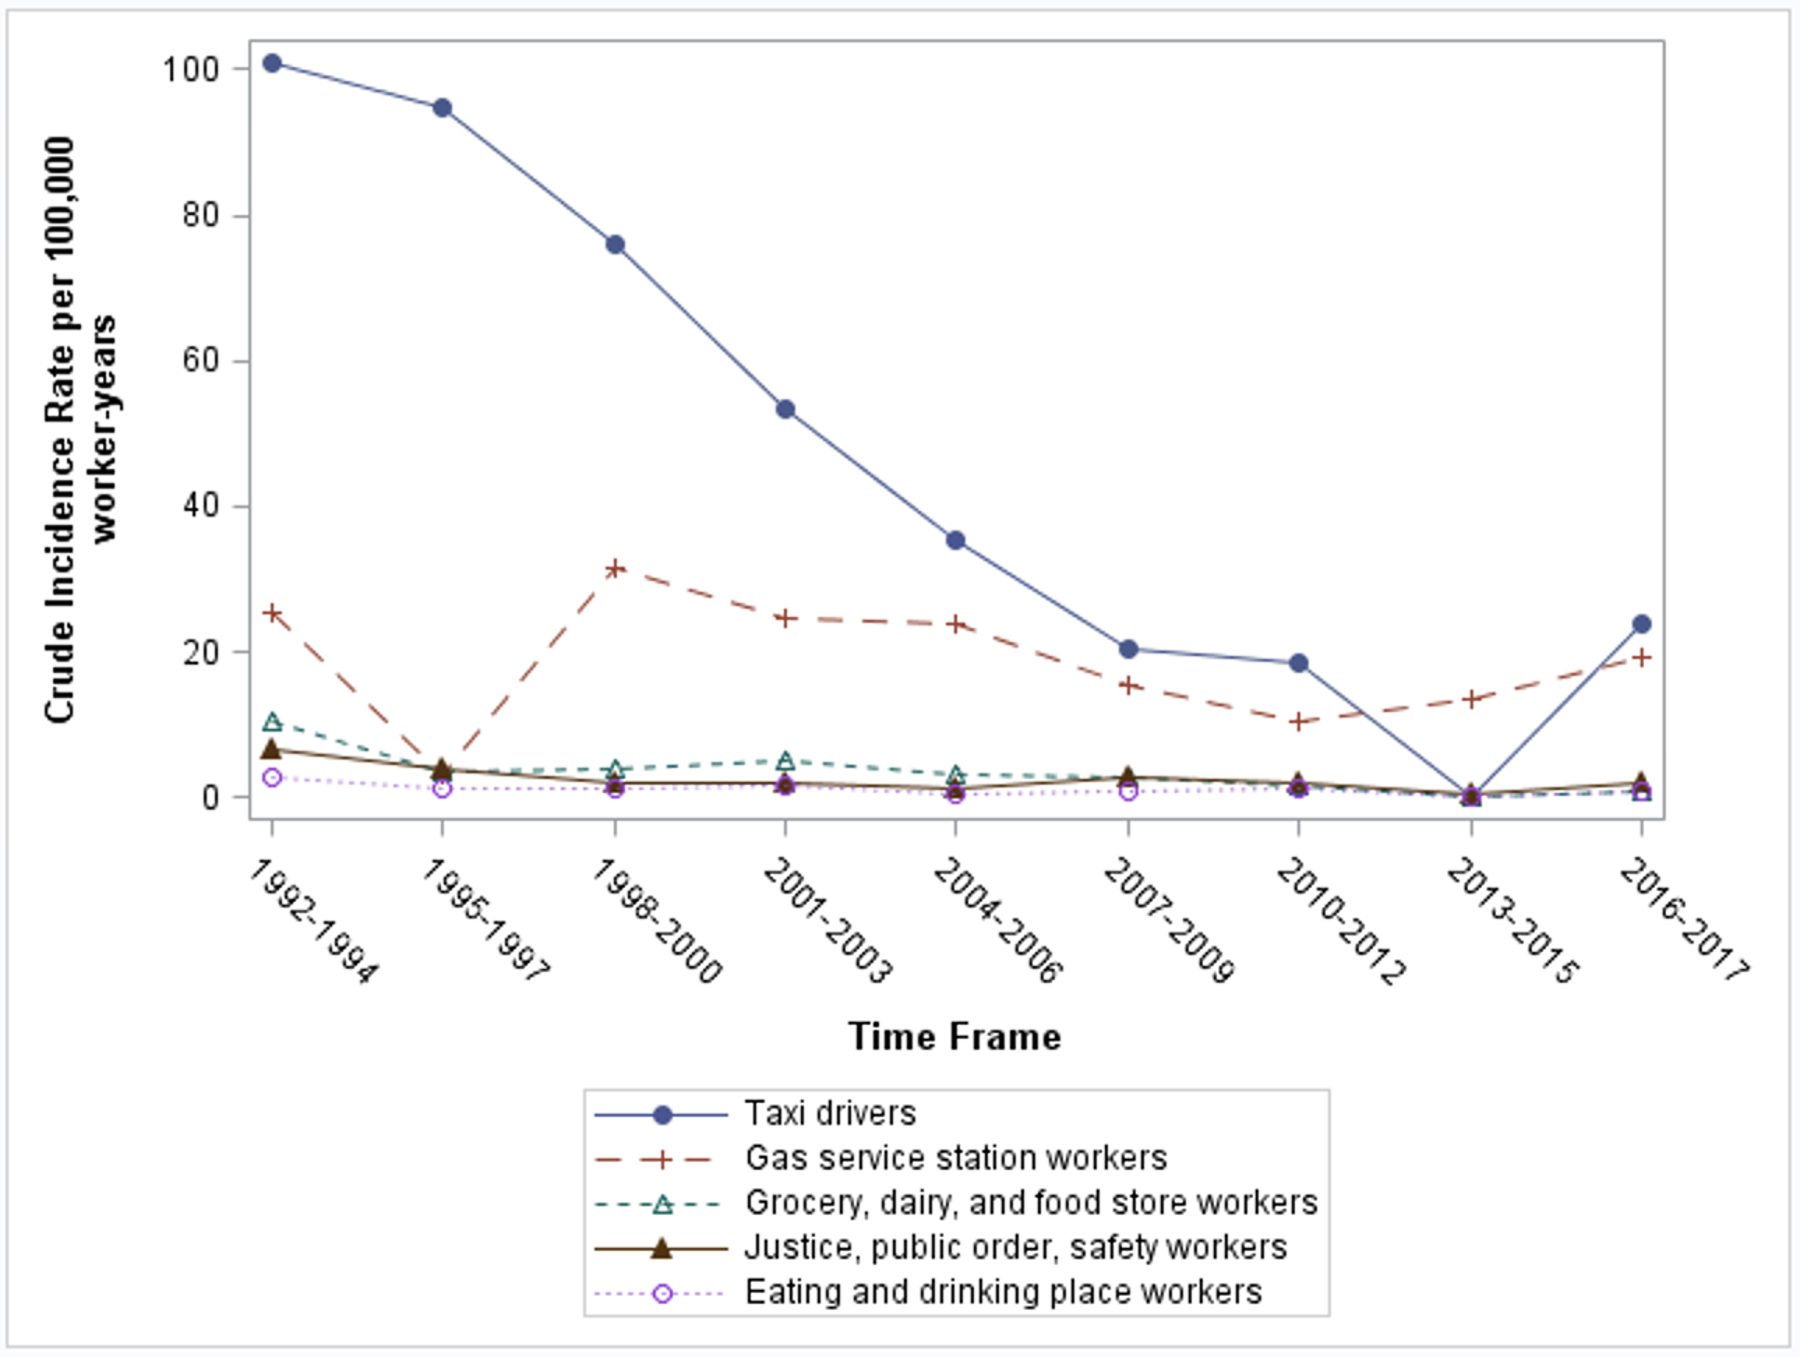
Results: 456 homicides over 111 573 049 w-y were observed. Occupational homicide rates decreased from 0.82 per 100 000 w-y for the period 1992-1995 to 0.21 per 100 000 w-y for the period 2011-2015, but increased to 0.32 per 100 000 w-y in the period 2016-2017. Fifty-five per cent (252) of homicides were perpetrated by strangers. Taxi drivers experienced an occupational homicide rate that was 110 times (95% CI 76.52 to 160.19) the overall occupational homicide rate in NC; however, this rate declined by 76.5% between 1992 and 2017. Disparities were observed among workers 65+ years old, racially and ethnically minoritised workers and self-employed workers.
Conclusion: Our findings identify industries and worker demographics that experienced high occupational homicide fatality rates. Targeted and tailored mitigation strategies among vulnerable industries and workers are recommended.
Keywords: Descriptive Epidemiology; Firearm; Occupational injury; Violence.
© Author(s) (or their employer(s)) 2024. No commercial re-use. See rights and permissions. Published by BMJ.
Conflict of interest statement
Competing interests: None declared.
Figures
Similar articles
-
Surveillance for Violent Deaths - National Violent Death Reporting System, 50 States, the District of Columbia, and Puerto Rico, 2022.MMWR Surveill Summ. 2025 Jun 12;74(5):1-42. doi: 10.15585/mmwr.ss7405a1. MMWR Surveill Summ. 2025. PMID: 40493548 Free PMC article.
-
Surveillance for Violent Deaths - National Violent Death Reporting System, 48 States, the District of Columbia, and Puerto Rico, 2020.MMWR Surveill Summ. 2023 May 26;72(5):1-38. doi: 10.15585/mmwr.ss7205a1. MMWR Surveill Summ. 2023. PMID: 37220104 Free PMC article.
-
Homicide Rates Across County, Race, Ethnicity, Age, and Sex in the US: A Global Burden of Disease Study.JAMA Netw Open. 2025 Feb 3;8(2):e2462069. doi: 10.1001/jamanetworkopen.2024.62069. JAMA Netw Open. 2025. PMID: 40014342 Free PMC article.
-
The global prevalence of intimate partner homicide: a systematic review.Lancet. 2013 Sep 7;382(9895):859-65. doi: 10.1016/S0140-6736(13)61030-2. Epub 2013 Jun 20. Lancet. 2013. PMID: 23791474
-
Interventions for preventing occupational irritant hand dermatitis.Cochrane Database Syst Rev. 2018 Apr 30;4(4):CD004414. doi: 10.1002/14651858.CD004414.pub3. Cochrane Database Syst Rev. 2018. PMID: 29708265 Free PMC article.
References
-
- Moracco KE, Runyan CW, Loomis DP, Wolf SH, Napp D, Butts JD. Killed on the clock: A population-based study of workplace homicide, 1977–1991. American Journal of Industrial Medicine. Published online June 1, 2000. - PubMed
-
- Breaking Point: The Workplace Violence Epidemic and What to Do About It | Office of Justice Programs. Accessed March 18, 2023. https://www.ojp.gov/ncjrs/virtual-library/abstracts/breaking-point-workp...
-
- Homicides and other workplace assaults by gender in 2019 : The Economics Daily: U.S. Bureau of Labor Statistics. Accessed March 18, 2023. https://www.bls.gov/opub/ted/2021/homicides-and-other-workplace-assaults...
-
- Census of Fatal Occupational Injuries (CFOI) - Current and Revised Data : U.S. Bureau of Labor Statistics. Accessed March 18, 2023. https://www.bls.gov/iif/fatal-injuries-tables.htm
Grants and funding
LinkOut - more resources
Full Text Sources