

Pangenome-genotyped structural variation improves molecular phenotype mapping in cattle
- PMID: 38355307
- PMCID: PMC10984387
- DOI: 10.1101/gr.278267.123
Pangenome-genotyped structural variation improves molecular phenotype mapping in cattle
Abstract
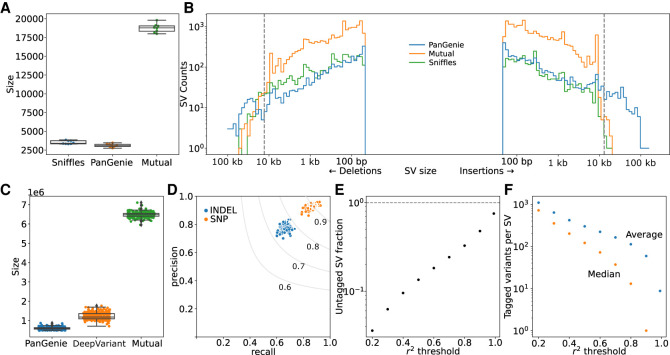
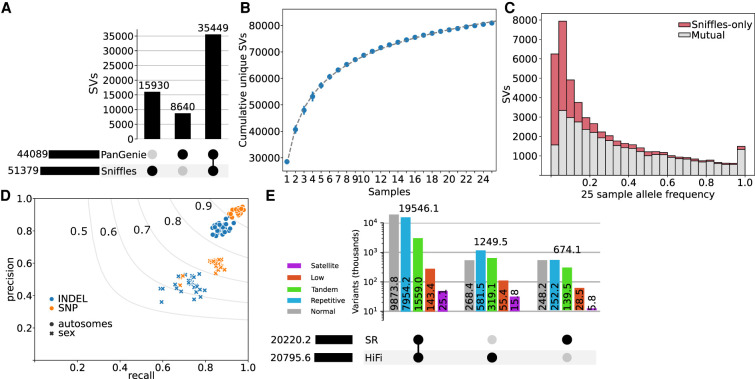
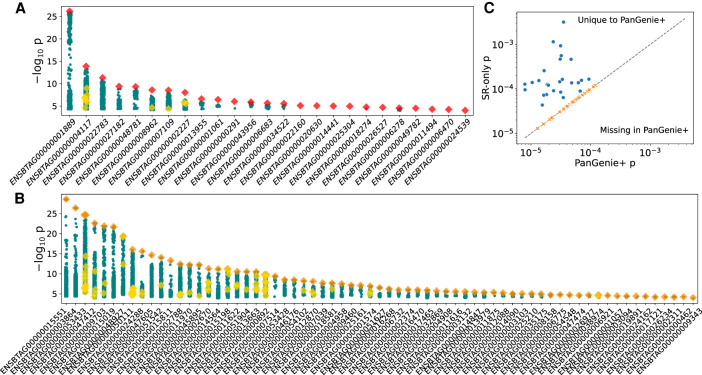
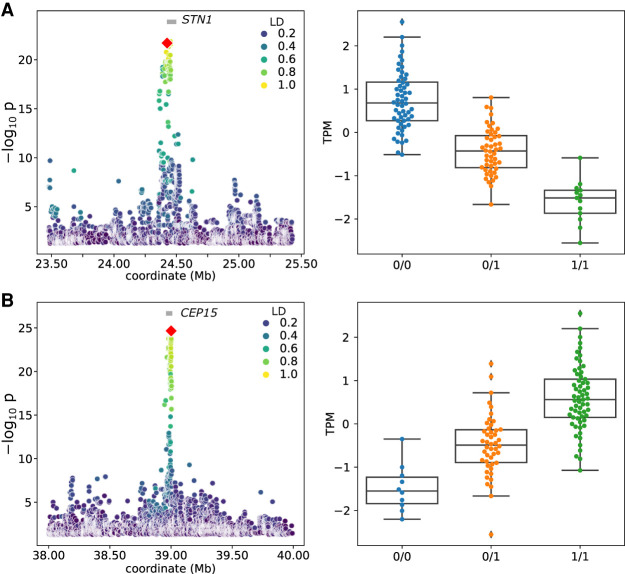
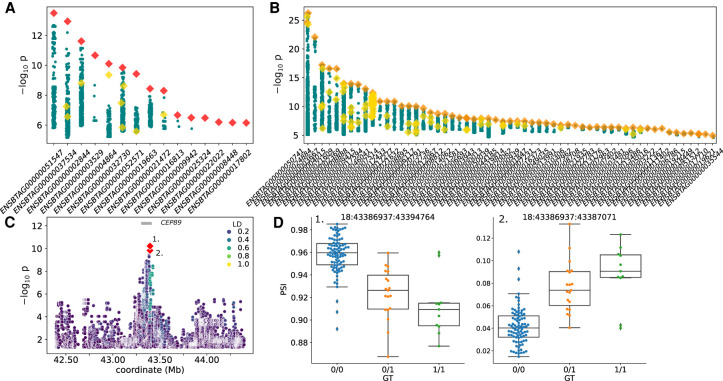
Expression and splicing quantitative trait loci (e/sQTL) are large contributors to phenotypic variability. Achieving sufficient statistical power for e/sQTL mapping requires large cohorts with both genotypes and molecular phenotypes, and so, the genomic variation is often called from short-read alignments, which are unable to comprehensively resolve structural variation. Here we build a pangenome from 16 HiFi haplotype-resolved cattle assemblies to identify small and structural variation and genotype them with PanGenie in 307 short-read samples. We find high (>90%) concordance of PanGenie-genotyped and DeepVariant-called small variation and confidently genotype close to 21 million small and 43,000 structural variants in the larger population. We validate 85% of these structural variants (with MAF > 0.1) directly with a subset of 25 short-read samples that also have medium coverage HiFi reads. We then conduct e/sQTL mapping with this comprehensive variant set in a subset of 117 cattle that have testis transcriptome data, and find 92 structural variants as causal candidates for eQTL and 73 for sQTL. We find that roughly half of the top associated structural variants affecting expression or splicing are transposable elements, such as SV-eQTL for STN1 and MYH7 and SV-sQTL for CEP89 and ASAH2 Extensive linkage disequilibrium between small and structural variation results in only 28 additional eQTL and 17 sQTL discovered when including SVs, although many top associated SVs are compelling candidates.
© 2024 Leonard et al.; Published by Cold Spring Harbor Laboratory Press.
Figures
Similar articles
-
Graphical pangenomics-enabled characterization of structural variant impact on gene expression in Brassica napus.Theor Appl Genet. 2025 Apr 3;138(4):91. doi: 10.1007/s00122-025-04867-2. Theor Appl Genet. 2025. PMID: 40178590 Free PMC article.
-
Structural variants and short tandem repeats impact gene expression and splicing in bovine testis tissue.Genetics. 2023 Nov 1;225(3):iyad161. doi: 10.1093/genetics/iyad161. Genetics. 2023. PMID: 37655920 Free PMC article.
-
A large structural variant collection in Holstein cattle and associated database for variant discovery, characterization, and application.BMC Genomics. 2024 Sep 30;25(1):903. doi: 10.1186/s12864-024-10812-2. BMC Genomics. 2024. PMID: 39350025 Free PMC article.
-
Understanding and predicting complex traits: knowledge from cattle.Hum Mol Genet. 2012 Oct 15;21(R1):R45-51. doi: 10.1093/hmg/dds332. Epub 2012 Aug 16. Hum Mol Genet. 2012. PMID: 22899652 Review.
-
Genetic association of molecular traits: A help to identify causative variants in complex diseases.Clin Genet. 2018 Mar;93(3):520-532. doi: 10.1111/cge.13187. Clin Genet. 2018. PMID: 29194587 Review.
Cited by
-
Pangenome graph mitigates heterozygosity overestimation from mapping bias: a case study in Chinese indigenous pigs.BMC Biol. 2025 Mar 26;23(1):89. doi: 10.1186/s12915-025-02194-y. BMC Biol. 2025. PMID: 40140905 Free PMC article.
-
SVLearn: a dual-reference machine learning approach enables accurate cross-species genotyping of structural variants.Nat Commun. 2025 Mar 11;16(1):2406. doi: 10.1038/s41467-025-57756-z. Nat Commun. 2025. PMID: 40069188 Free PMC article.
-
Taurine pangenome uncovers a segmental duplication upstream of KIT associated with depigmentation in white-headed cattle.Genome Res. 2025 Apr 14;35(4):1041-1052. doi: 10.1101/gr.279064.124. Genome Res. 2025. PMID: 39694857
-
Graphical pangenomics-enabled characterization of structural variant impact on gene expression in Brassica napus.Theor Appl Genet. 2025 Apr 3;138(4):91. doi: 10.1007/s00122-025-04867-2. Theor Appl Genet. 2025. PMID: 40178590 Free PMC article.
-
Overcoming limitations to customize DeepVariant for domesticated animals with TrioTrain.Genome Res. 2025 Aug 1;35(8):1859-1874. doi: 10.1101/gr.279542.124. Genome Res. 2025. PMID: 40456605 Free PMC article.
References
-
- Beyter D, Ingimundardottir H, Oddsson A, Eggertsson HP, Bjornsson E, Jonsson H, Atlason BA, Kristmundsdottir S, Mehringer S, Hardarson MT, et al. 2021. Long-read sequencing of 3,622 Icelanders provides insight into the role of structural variants in human diseases and other traits. Nat Genet 53: 779–786. 10.1038/s41588-021-00865-4 - DOI - PubMed
Publication types
MeSH terms
LinkOut - more resources
Full Text Sources