. 2024 Feb 14;24(1):22.
doi: 10.1186/s12862-023-02193-z.

Linking morphology, performance, and habitat utilization: adaptation across biologically relevant 'levels' in tamarins

Affiliations

Linking morphology, performance, and habitat utilization: adaptation across biologically relevant 'levels' in tamarins

Patricia Berles et al. BMC Ecol Evol. .

Abstract

Background: Biological adaptation manifests itself at the interface of different biologically relevant 'levels', such as ecology, performance, and morphology. Integrated studies at this interface are scarce due to practical difficulties in study design. We present a multilevel analysis, in which we combine evidence from habitat utilization, leaping performance and limb bone morphology of four species of tamarins to elucidate correlations between these 'levels'.

Results: We conducted studies of leaping behavior in the field and in a naturalistic park and found significant differences in support use and leaping performance. Leontocebus nigrifrons leaps primarily on vertical, inflexible supports, with vertical body postures, and covers greater leaping distances on average. In contrast, Saguinus midas and S. imperator use vertical and horizontal supports for leaping with a relatively similar frequency. S. mystax is similar to S. midas and S. imperator in the use of supports, but covers greater leaping distances on average, which are nevertheless shorter than those of L. nigrifrons. We assumed these differences to be reflected in the locomotor morphology, too, and compared various morphological features of the long bones of the limbs. According to our performance and habitat utilization data, we expected the long bone morphology of L. nigrifrons to reflect the largest potential for joint torque generation and stress resistance, because we assume longer leaps on vertical supports to exert larger forces on the bones. For S. mystax, based on our performance data, we expected the potential for torque generation to be intermediate between L. nigrifrons and the other two Saguinus species. Surprisingly, we found S. midas and S. imperator having relatively more robust morphological structures as well as relatively larger muscle in-levers, and thus appearing better adapted to the stresses involved in leaping than the other two.

Conclusion: This study demonstrates the complex ways in which behavioral and morphological 'levels' map onto each other, cautioning against oversimplification of ecological profiles when using large interspecific eco-morphological studies to make adaptive evolutionary inferences.

Keywords: Biomechanics; Field study; Integrative biology; Leaping behavior; Limb bones; Locomotion.


Conflict of interest statement

The authors declare no competing interests.

Figures
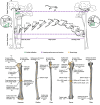
Fig. 1
Fig. 1
Schematic illustration of data acquisition. A Characterization of habitat utilization. Habitat characteristics and posture were recorded in the field/park and are shown in green (diameter, D; orientation, O; flexibility, F). B Leaping performance and posture. Horizontal leaping distance (LD) was recorded in the field/park, time-related performance measures were extracted from camera recordings and an exemplary trunk-to-trunk leap of L. nigrifrons with a leaping distance of 1.5 m is highlighted in violet (take-off-, flight-, and landing-phases in ms). C Acquired morphological variables. Measurements on the bones are highlighted in orange. Anterior view of the left humerus, ulna, radius, femur, and tibia of the specimen S. mystax AMNH 188,178. The numbers in panel C refer to the labelled data points in Fig. 2C. See text for more information
Fig. 2
Fig. 2
Data split by species. A Habitat utilization, (B) Leaping performance, (C) Morphology (standardized variables, compare to Fig. 1C). Humerus: (1) surface area of the scapular articulation, (2) surface area of the radial and ulnar articulation, (3) in-lever of the M. deltoideus, (4) in-lever of the M. subscapularis, (5) in-lever of the M. supraspinatus and M. infraspinatus, (6) cross-sectional-area (CSA) at 50% length, (7) anteroposterior second moment of area (SMAap) at 50%, (8) mediolateral second moment of area (SMAml) at 50% length, (9) trabecular degree of anisotropy (DA), (10) trabecular bone volume fraction (BV.TV); Radius: (11) Surface area of the humeral articulation, (12) Surface area of the carpal articulation; Ulna: (13) surface area of the humeral articulation, (14) surface area of the radial articulation, (15) in-lever of the M. triceps brachii; Femur: (16) surface area of the pelvic articulation, (17) Cross-section of the femoral neck, (18) patellar height index (patellar width projected onto surface/patellar width), (19) in-lever of the M. gluteus medius, (20) in-lever of the M. gluteus superficialis, (21) in-lever of the M. iliopsoas, (22) CSA at 50% length, (23) SMAap at 50% length, (24) SMAml at 50% length, (25) DA, (26) BV.TV; Tibia: (27) surface area of the femoral articulation, (28) surface area of the talar articulation. Percentages of utilized categories of the studied support characteristics and posture can be found in numerical form in supporting information Table S2
Fig. 3
Fig. 3
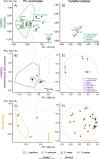
Principal component graphs of biologically relevant ‘levels’. The planes spanned by the first two principal components (PCs) from the habitat utilization (A), leaping performance and posture (B) and morphology (C) datasets are shown with grey symbols representing the mean values of the species and black symbols representing the mean values of the categorical variables. The grey lines connect the species means to highlight cross-level differences. Variable loadings of the corresponding PC analysis (D, E, F) are found right to the PC graph. Loadings of continuous variables represent Pearson’s correlation coefficients and can range from − 1 to + 1. The closer a point falls to the circle’s margin the better is its variable’s representation in this 2D subspace (falling on the margin indicates total representation). Loadings of categorical variables (indicated by asterisks) represent R² values from an ANOVA and can range from 0 to + 1. The point labels in panel F correspond to the numbered morphological variables in Fig. 1C (the point for IMI referring to the effective length measurements used to compute the index)
Fig. 4
Fig. 4
Cladogram of the four studied tamarin species with cluster characterizations for each of the three analyzed biologically relevant ‘levels’. The tree topology follows Botton-Divet & Nyakatura [16], but branch length information was omitted for simplicity

Similar articles

References

    1. Bock WJ, Von Wahlert G. Adaptation and the form-function complex. Evolution. 1965;269–99. 10.2307/2406439.
    1. Feilich KL, López-Fernández H. When does form reflect function? Acknowledging and supporting ecomorphological assumptions. Integr Comp Biol. 2019;59(2):358–70. doi: 10.1093/icb/icz070. - DOI - PubMed
    1. Garber PA. Primate Locomotion. Boston, MA: Springer; 1998. Within-and between-site variability in moustached tamarin (Saguinus mystax) positional behavior during food procurement; pp. 61–78.
    1. Reilly SM, Wainwright PC. Conclusion: ecological morphology and the power of integration. In: Wainwright PC, Reilly SM, editors. Ecological Morphology: Integrative Organismal Biology. Chicago: University of Chicago Press; 1994. pp. 339–54.
    1. Alfaro ME, Bolnick DI, Wainwright PC. Evolutionary consequences of many-to-one mapping of jaw morphology to mechanics in labrid fishes. Am Nat. 2005;165(6):E140–54. doi: 10.1086/429564. - DOI - PubMed