. 2024 Feb 14;15(1):1373.
doi: 10.1038/s41467-024-45132-2.

The IL6/JAK/STAT3 signaling axis is a therapeutic vulnerability in SMARCB1-deficient bladder cancer

Affiliations

The IL6/JAK/STAT3 signaling axis is a therapeutic vulnerability in SMARCB1-deficient bladder cancer

Chandra Sekhar Amara et al. Nat Commun. .

Abstract

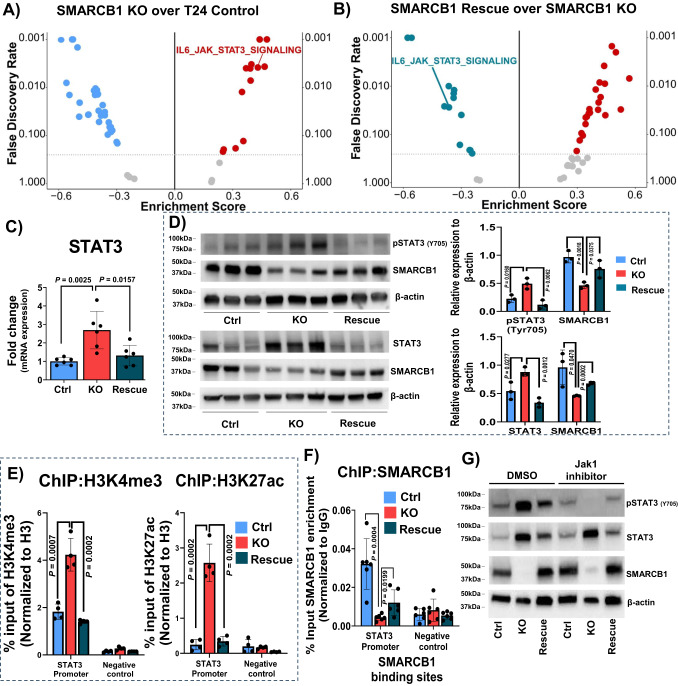
SMARCB1 loss has long been observed in many solid tumors. However, there is a need to elucidate targetable pathways driving growth and metastasis in SMARCB1-deficient tumors. Here, we demonstrate that SMARCB1 deficiency, defined as genomic SMARCB1 copy number loss associated with reduced mRNA, drives disease progression in patients with bladder cancer by engaging STAT3. SMARCB1 loss increases the chromatin accessibility of the STAT3 locus in vitro. Orthotopically implanted SMARCB1 knockout (KO) cell lines exhibit increased tumor growth and metastasis. SMARCB1-deficient tumors show an increased IL6/JAK/STAT3 signaling axis in in vivo models and patients. Furthermore, a pSTAT3 selective inhibitor, TTI-101, reduces tumor growth in SMARCB1 KO orthotopic cell line-derived xenografts and a SMARCB1-deficient patient derived xenograft model. We have identified a gene signature generated from SMARCB1 KO tumors that predicts SMARCB1 deficiency in patients. Overall, these findings support the clinical evaluation of STAT3 inhibitors for the treatment of SMARCB1-deficient bladder cancer.


Conflict of interest statement

S.M.K. is stakeholder of NeoZenome Therapeutics Inc. P.M. has received honoraria for service on a Scientific Advisory Board for Mirati Therapeutics, Bristol Myers Squibb, and Exelixis; consulting for Axiom Healthcare Strategies; non-branded educational programs supported by Exelixis and Pfizer; and research funding for clinical trials from Takeda, Bristol Myers Squibb, Mirati Therapeutics, Gateway for Cancer Research, and The University of Texas MD Anderson Cancer Center. M.J.E. reports grants from CPRIT and McNair Medical Foundation during the conduct of the study; personal fees from AstraZeneca outside the submitted work; in addition, M.J.E. has a patent for PAM50 issued, licensed, and with royalties paid from Veracyte. M.J.E. is current employee of AstraZeneca. H.C.H. is a consultant for Avenge Bio, Inc. A.S.K. is Scientific Advisor to Karkinos Health Care Pvt Ltd, India and unpaid visiting faculty to Sri Sathya Sai Institute for Higher Learning, India. The other authors declare that they have no competing interests.

Figures

Fig. 1
Fig. 1. SMARCB1 deficiency is associated with worse outcomes and enrichment for STAT3 signaling.
A Low expression of SMARCB1 was associated with worse survival in TCGA-BLCA. Kaplan–Meier plot with bladder cancer (n = 406) cohort defined by low (n = 331) or high (n = 75) SMARCB1 mRNA expression based on maximally selected rank statistics [log-rank test (P = 0.031; two-sided); only patients with survival information were represented]. B Ranking of hallmark gene sets that are enriched in low SMARCB1 (n = 331) compared to high SMARCB1 (n = 75) based on maximally selected rank statistics in TCGA-BLCA patients (n = 406). C Gene set enrichment analysis (GSEA) plot for the HALLMARK IL6/JAK/STAT3 signaling pathway comparing SMARCB1 low (n = 331) with SMARCB1 high (n = 75) in TCGA-BLCA patients (n = 406) (NES = 2.3494; P = 0.0011). GSEA analysis was performed using 1000 permutations to determine a significance p-value. D Association between SMARCB1 mRNA expression and SMARCB1 copy number alterations including deep deletion (n = 3); shallow deletion (n = 138), diploid (n = 184), gain (n = 69); amplification (n = 8) (4 patients’ copy number alteration data was unavailable) in the TCGA-BLCA cohort. Violin plots represent the expression levels of SMARCB1 mRNA expression with respect to copy number alterations of SMARCB1 in the TCGA-BLCA patient cohort. E Violin plot showing the correlation between pSTAT3 (Y705) levels (RPPA-TCGA) and SMARCB1 in the TCGA-BLCA cohort. SMARCB1 mRNA levels were defined based on KM plot in Fig.1A. The patients were divided into six groups by considering SMARCB1 copy number alterations and SMARCB1 mRNA levels (Group I: SMARCB1 shallow/deep deletion with low SMARCB1 mRNA; Group II: SMARCB1 diploid with low SMARCB1 mRNA; Group III: SMARCB1 gain with low SMARCB1 mRNA; Group IV: SMARCB1 shallow deletion with high SMARCB1 mRNA; Group V: SMARCB1 diploid with high SMARCB1 mRNA; Group VI: SMARCB1 gain/ amplification with high SMARCB1 mRNA) [Note: pSTAT3 (Y705) data were obtained from RPPA-TCGA and available for matched patients with copy number alterations and survival (n = 334 out of 406 used for analysis, and refer to “Methods” section)]. For panels D and E, P-values were determined by unpaired two-tailed Student’s t-test. Source data are provided as a Source Data file.
Fig. 2
Fig. 2. Effect of SMARCB1 on BLCA tumor growth and metastasis.
A Validation of CRISPR/Cas9 based SMARCB1 KO (clone 16) and rescue (ectopic overexpression of SMARCB1 in KO derived from clone 16) by immunoblot analysis in the T24 BLCA cell line. GAPDH was used as loading control. B Representative bioluminescence images (BLI) of mice bearing T24 Control (ctrl), SMARCB1 KO, and SMARCB1 rescue orthotopic xenografts on day 15. C Weight of orthotopic mice bladders harboring tumors (endpoint, day 23) from T24 ctrl (n = 9), SMARCB1 KO (n = 7), and SMARCB1 rescue (n = 9) [Data are represented as mean ± standard deviation (SD)]. D Representative ex-vivo BLI images of metastatic lesions (lungs, liver, kidneys, and stomach & intestine) from mice bearing T24 ctrl, SMARCB1 KO, and rescue orthotopic xenografts. [Note: Representative ex-vivo BLI images were cropped from different non overlapping regions of same images for lungs, liver, kidneys, and stomach & intestine]. E Scatter plots represent the quantification of BLI signal of lungs, liver, kidneys, and stomach & intestine of mice bearing orthotopic xenografts from T24 ctrl (n = 9), SMARCB1 KO (n = 7) and rescue (n = 9) (quantified by BLI signal; photons/sec/cm2/sr) [Data are represented as mean ± standard deviation (SD)]. F Histology images of Hematoxylin and eosin (H&E) staining of ex-vivo metastatic organs derived from SMARCB1 KO metastatic lesions derived from panel (D). The metastatic lesions were highlighted with dotted boxes. Scale bar represents 100 µm. For panels C and E, P-values were determined by unpaired two-tailed Student’s t-test. Source data are provided as a Source Data file.
Fig. 3
Fig. 3. SMARCB1 loss upregulates STAT3 expression.
A, B Gene set enrichment analysis (GSEA) of RNA-seq data from orthotopic tumors derived from T24 control, SMARCB1 KO and SMARCB1 rescue xenografts. Volcano plot represents the hallmark pathways that were enriched in A SMARCB1 KO over T24 control (FDR < 0.25) and B SMARCB1 rescue over SMARCB1 KO (FDR < 0.25). C Relative fold change in mRNA levels of STAT3 from T24 ctrl (n = 6 replicates sampled across three different mice; each one analyzed under three technical replicates), SMARCB1 KO (n = 6 replicates sampled across three different mice; each one analyzed under three technical replicates) and SMARCB1 rescue (n = 6 replicates sampled across three different mice; each one analyzed under three technical replicates) orthotopic xenografts. Normalized with β-actin [Data are represented as mean ± standard deviation (SD)]. D Immunoblot analysis of pSTAT3 (Y705), STAT3, SMARCB1 in T24 ctrl, SMARCB1 KO and SMARCB1 rescue orthotopic tumors (n = 3). Same lysate was used for upper and bottom panels. β-actin was used as loading control. Scatter plots show relative expression of the target proteins after background subtraction and normalization to β-actin [Data are represented as mean ± standard deviation (SD)]. E ChIP-qPCR analysis shows increased levels of H3K4me3 and H3K27ac on STAT3 promoter in SMARCB1 KO xenografts (n = 4; two biological replicates analyzed under two technical replicates) [Data are represented as mean ± standard deviation (SD)]. F ChIP-qPCR analysis shows decreased levels of SMARCB1 on STAT3 promoter in SMARCB1 KO xenografts which was rescued in SMARCB1 re-expression (n = 6; three biological replicates analyzed under two technical replicates) [Data are represented as mean ± standard deviation (SD)]. G Immunoblot analysis of pSTAT3 (Y705), STAT3, and SMARCB1 in T24 ctrl, KO, and rescue spheroids treated with the JAK1 inhibitor, Itacitinib for 10 days at 1000 nM concentration. β-actin was used as loading control. For panels C, D, E and F, P-values were determined by unpaired two-tailed Student’s t-test. Source data are provided as a Source Data file.
Fig. 4
Fig. 4. STAT3 is essential for tumor growth and metastasis in SMARCB1 KO  BLCA.
A Immunoblot analysis showing the confirmation of STAT3 knockdown (shSTAT3) in T24 SMARCB1 KO cell lines (clone 16). Lane 1- T24 ctrl; lane 2- SMARCB1 KO; lane 3- KO with shCtrl; and lane 4- KO with shSTAT3. Lane 3 and 4 cell lines were used for the in vivo experiments. GAPDH was used as loading control. B Top panel shows representative BLI in orthotopic mouse xenograft models showing decreased BLI signal indicating decreased tumor growth in SMARCB1 KO with shSTAT3. Bottom panel shows the scatter plot representing BLI signal on day 25 from xenografts derived from SMARCB1 KO with shCtrl (n = 10) and SMARCB1 KO with shSTAT3 (n = 13) [Data are represented as mean ± standard deviation (SD)]. C Scatter plot represents the weight of orthotopic mouse bladders harboring tumors (endpoint; day 27) from SMARCB1 KO + shCtrl (n = 10) and SMARCB1 KO + shSTAT3 (n = 13) [Data are represented as mean ± standard deviation (SD)]. D Left panel shows the representative ex-vivo BLI signal of lungs from mice bearing T24 SMARCB1 KO with scrambled sh or STAT3 KD in SMARCB1 KO orthotopic xenografts. Right panel shows the scatter plot representing the quantification of BLI signal of lungs from SMARCB1 KO with shCtrl (n = 10) and SMARCB1 KO with shSTAT3 (n = 13) [Data are represented as mean ± standard deviation (SD)]. For panels B, C and D, P-values were determined by unpaired two-tailed Student’s t-test. Source data are provided as a Source Data file.
Fig. 5
Fig. 5. Therapeutic targeting of pSTAT3 (Y705) in SMARCB1 KO orthotopic BLCA xenografts.
A Schematic overview of experimental plan for SMARCB1 KO xenografts with STAT3 inhibitor TTI-101. B Top panel shows representative BLI images of mice bearing SMARCB1 KO orthotopic xenografts which were treated with vehicle (n = 8) and TTI-101 (n = 10; on day 24). Bottom panel shows scatter plot representing BLI signal on day 24 from vehicle and TTI-101 treated mice (oral gavage – 50 mg/kg body weight, twice a day) [Data are represented as mean ± standard deviation (SD)]. C Scatter plot showing weight of orthotopic bladders harboring tumors (day 29) from T24 SMARCB1 KO treated with vehicle (n = 8) and TTI-101 (n = 10) [Data are represented as mean ± standard deviation (SD)]. D Left panel shows representative ex-vivo BLI images of lungs of T24 SMARCB1 KO cell-bearing mice treated with vehicle (n = 8) and TTI-101 (n = 10) at endpoint day 29. Right panel shows scatter plot representing the quantification of BLI signal of lungs [Data are represented as mean ± standard deviation (SD)]. E Quantification of IL6 secretion by ELISA from mouse plasma bearing T24 SMARCB1 KO xenografts treated with vehicle (n = 8 mice) and TTI-101 (n = 8 mice) inhibitor at endpoint day 29 [Data are represented as mean ± standard deviation (SD)]. For panels B, C, D, and E, P-values were determined by unpaired two-tailed Student’s t-test. Source data are provided as a Source Data file.
Fig. 6
Fig. 6. STAT3 inhibitor TTI-101 suppresses tumor growth in SMARCB1-deficient patient-derived xenografts.
A Tumor growth analysis of PDX model [TM00020 obtained from The Jackson laboratory; harboring SMARCB1 deletion (Supplementary Data 9) and low mRNA (Supplementary Fig. 13A) treated with vehicle (n = 5) and TTI-101 (n = 6) for a period of 14 days at 50 mg/kg by oral gavage, twice per day]. [Data are represented as mean ± standard error of mean (SEM); unpaired two-tailed Student’s t-test]. B Weight of tumors (after 14 days) from TM00020 PDX treated with vehicle (n = 5) and TTI-101 (n = 6). [Data are represented as mean ± standard deviation (SD); unpaired two-tailed Student’s t-test]. C Tumor growth analysis of PDX [BCM-BL8091 obtained from BCM PDX core; high SMARCB1 mRNA (Supplementary Fig. 13A)] treated with vehicle (n = 5) and TTI-101 (n = 5) inhibitor for a period of 77 days at 50 mg/kg by oral gavage, twice per day. [Data are represented as mean ± standard error of mean (SEM)]. No significant difference was observed at all time points using unpaired two-tailed Student’s t-test. D Weight of tumors (after 77 days) from BCM-BL8091 PDX treated with vehicle (n = 5) and TTI-101 (n = 5). [Data are represented as mean ± standard deviation (SD); unpaired two-tailed Student’s t-test]. E Schematic representation of the finding between SMARCB1 deficiency and the IL6/JAK/STAT3 signaling axis in BLCA. TME – Tumor microenvironment. Source data are provided as a Source Data file.

Similar articles

Cited by

References

    1. Sung H, et al. Global cancer statistics 2020: GLOBOCAN estimates of incidence and mortality worldwide for 36 cancers in 185 countries. CA Cancer J. Clin. 2021;71:209–249. doi: 10.3322/caac.21660. - DOI - PubMed
    1. Siegel RL, Miller KD, Fuchs HE, Jemal A. Cancer statistics, 2022. CA A Cancer J. Clin. 2022;72:7–33. doi: 10.3322/caac.21708. - DOI - PubMed
    1. Loriot Y, et al. Erdafitinib in locally advanced or metastatic urothelial carcinoma. N. Engl. J. Med. 2019;381:338–348. doi: 10.1056/NEJMoa1817323. - DOI - PubMed
    1. Powles T, et al. Enfortumab vedotin in previously treated advanced urothelial carcinoma. N. Engl. J. Med. 2021;384:1125–1135. doi: 10.1056/NEJMoa2035807. - DOI - PMC - PubMed
    1. Tagawa ST, et al. TROPHY-U-01: a phase II open-label study of sacituzumab govitecan in patients with metastatic urothelial carcinoma progressing after platinum-based chemotherapy and checkpoint inhibitors. J. Clin. Oncol. 2021;39:2474–2485. doi: 10.1200/JCO.20.03489. - DOI - PMC - PubMed

MeSH terms