Meta-Analysis
. 2024 Feb 14;22(1):67.
doi: 10.1186/s12916-024-03291-5.

Influence of light at night on allergic diseases: a systematic review and meta-analysis

Affiliations
Meta-Analysis

Influence of light at night on allergic diseases: a systematic review and meta-analysis

Andy Deprato et al. BMC Med. .

Abstract

Background: Allergic diseases impose a significant global disease burden, however, the influence of light at night exposure on these diseases in humans has not been comprehensively assessed. We aimed to summarize available evidence considering the association between light at night exposure and major allergic diseases through a systematic review and meta-analysis.

Methods: We completed a search of six databases, two registries, and Google Scholar from inception until December 15, 2023, and included studies that investigated the influence of artificial light at night (ALAN, high vs. low exposure), chronotype (evening vs. morning chronotype), or shift work (night vs. day shift work) on allergic disease outcomes (asthma, allergic rhinitis, and skin allergies). We performed inverse-variance random-effects meta-analyses to examine the association between the exposures (ALAN exposure, chronotype, or shiftwork) and these allergic outcomes. Stratification analyses were conducted by exposure type, disease type, participant age, and geographical location along with sensitivity analyses to assess publication bias.

Results: We included 12 publications in our review. We found that exposure to light at night was associated with higher odds of allergic diseases, with the strongest association observed for ALAN exposure (OR: 1.88; 95% CI: 1.04 to 3.39), followed by evening chronotype (OR: 1.35; 95% CI: 0.98 to 1.87) and exposure to night shift work (OR: 1.33; 95% CI: 1.06 to 1.67). When analyses were stratified by disease types, light at night exposure was significantly associated with asthma (OR: 1.62; 95% CI: 1.19 to 2.20), allergic rhinitis (OR: 1.89; 95% CI: 1.60 to 2.24), and skin allergies (OR: 1.11; 95% CI: 1.09 to 1.91). We also found that the association between light at night exposure and allergic diseases was more profound in youth (OR: 1.63; 95% CI: 1.07 to 2.48) than adults (OR: 1.30; 95% CI: 1.03 to 1.63). Additionally, we observed significant geographical variations in the association between light at night exposure and allergic diseases.

Conclusions: Light at night exposure was associated with a higher prevalence of allergic diseases, both in youth and adults. More long-term epidemiological and mechanistic research is required to understand the possible interactions between light at night and allergic diseases.

Keywords: Allergic rhinitis; Asthma; Chronotype; Shift work; Skin allergies.


Conflict of interest statement

The authors declare that they have no competing interests.

Figures

Fig. 1
Fig. 1
Street-level haze at night from light pollution in Kolkata, India on October 22, 2022. (Picture courtesy of Professor Bhramar Mukherjee, University of Michigan, USA)
Fig. 2
Fig. 2
Preferred Reporting Items for Systematic Reviews and Meta-Analyses (PRISMA) flow diagram of the selection process for eligible studies considering the influence of light at night exposure on allergic diseases
Fig. 3
Fig. 3
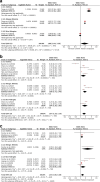
Association between light at night exposure and the odds of allergic diseases stratified by exposure type. Analyses were conducted with an inverse-variance random-effects model. Each square represents the reported odds ratios in each original study, and the size of the square represents the pooled weight that the study was given according to the sample size. The line through the square indicates the corresponding confidence interval (CI). Diamonds represent the overall effect in pooled studies
Fig. 4
Fig. 4
Association between light at night exposure and the odds of allergic diseases stratified by type of allergic disease. Analyses were conducted with an inverse-variance random-effects model. Each square represents the reported odds ratios in each original study, and the size of the square represents the pooled weight that study was given according to the sample size. The line through the square indicates the corresponding confidence interval (CI). Diamonds represent the overall effect in pooled studies
Fig. 5
Fig. 5
Association between light at night exposure and the odds of allergic diseases stratified by type of allergic disease for a artificial light at night exposure, b chronotype, and c shift work. Analyses were conducted with an inverse-variance random-effects model. Each square represents the reported odds ratios in each original study, and the size of the square represents the pooled weight that the study was given according to the sample size. The line through the square indicates the corresponding confidence interval (CI). Diamonds represent the overall effect in pooled studies
Fig. 6
Fig. 6
Association between light at night exposure and the odds of allergic diseases stratified by age group. Analyses were conducted with an inverse-variance random-effects model. Each square represents the reported odds ratios in each original study, and the size of the square represents the pooled weight that the study was given according to the sample size. The line through the square indicates the corresponding confidence interval (CI). Diamonds represent the overall effect in pooled studies
Fig. 7
Fig. 7
Association between light at night exposure and the odds of allergic diseases stratified by continent. Analyses were conducted with an inverse-variance random-effects model. Each square represents the reported odds ratios in each original study, and the size of the square represents the pooled weight that the study was given according to the sample size. The line through the square indicates the corresponding confidence interval (CI). Diamonds represent the overall effect in pooled studies

Similar articles

Cited by

References

    1. Refinetti R. Circadian Physiology. Boca raton, Florida, USA: CRC Press; 2016.
    1. Allada R, Bass J. Circadian mechanisms in medicine. N Engl J Med. 2021;384(6):550–561. doi: 10.1056/NEJMra1802337. - DOI - PMC - PubMed
    1. Lunn RM, Blask DE, Coogan AN, Figueiro MG, Gorman MR, Hall JE, et al. Health consequences of electric lighting practices in the modern world: a report on the National Toxicology Program's workshop on shift work at night, artificial light at night, and circadian disruption. Sci Total Environ. 2017;607–608:1073–1084. doi: 10.1016/j.scitotenv.2017.07.056. - DOI - PMC - PubMed
    1. Seto KC, Golden JS, Alberti M, Turner BL., 2nd Sustainability in an urbanizing planet. Proc Natl Acad Sci U S A. 2017;114(34):8935–8938. doi: 10.1073/pnas.1606037114. - DOI - PMC - PubMed
    1. Wegrzyn LR, Tamimi RM, Rosner BA, Brown SB, Stevens RG, Eliassen AH, et al. Rotating night-shift work and the risk of breast cancer in the nurses' health studies. Am J Epidemiol. 2017;186(5):532–540. doi: 10.1093/aje/kwx140. - DOI - PMC - PubMed

Publication types