. 2024 Feb 14;15(1):1351.
doi: 10.1038/s41467-024-45285-0.

In vitro induction of patterned branchial arch-like aggregate from human pluripotent stem cells

Affiliations

In vitro induction of patterned branchial arch-like aggregate from human pluripotent stem cells

Yusuke Seto et al. Nat Commun. .

Abstract

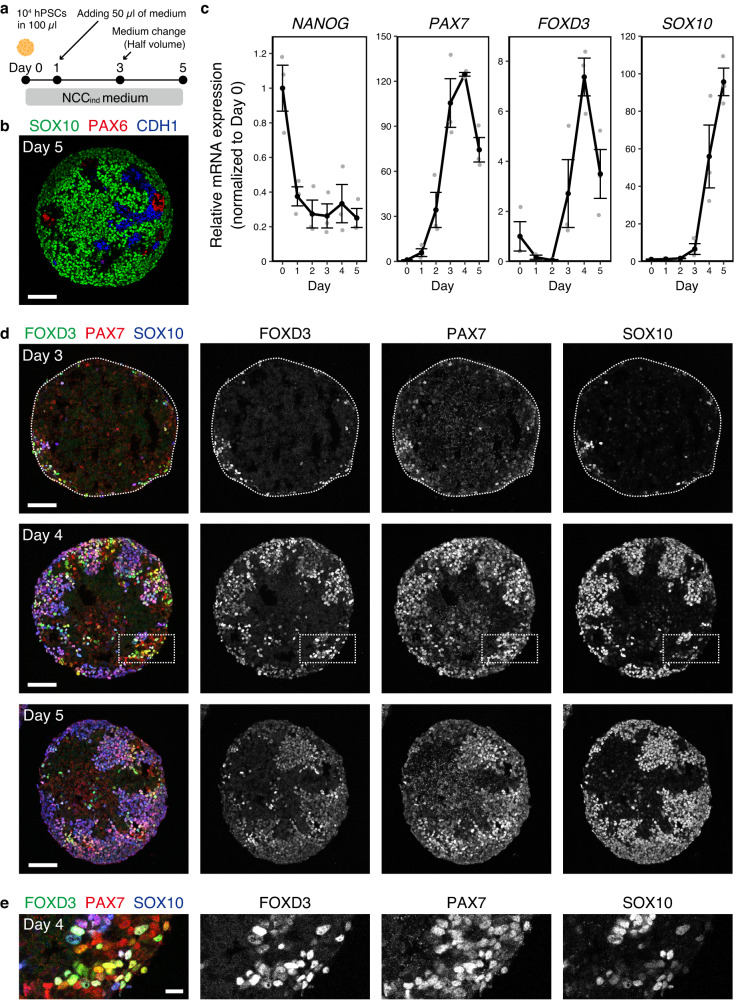
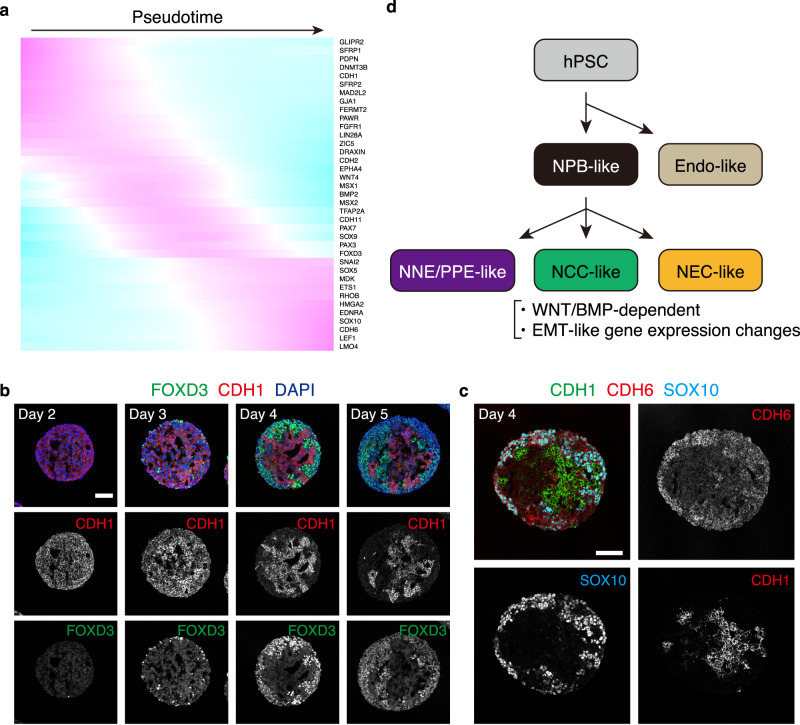
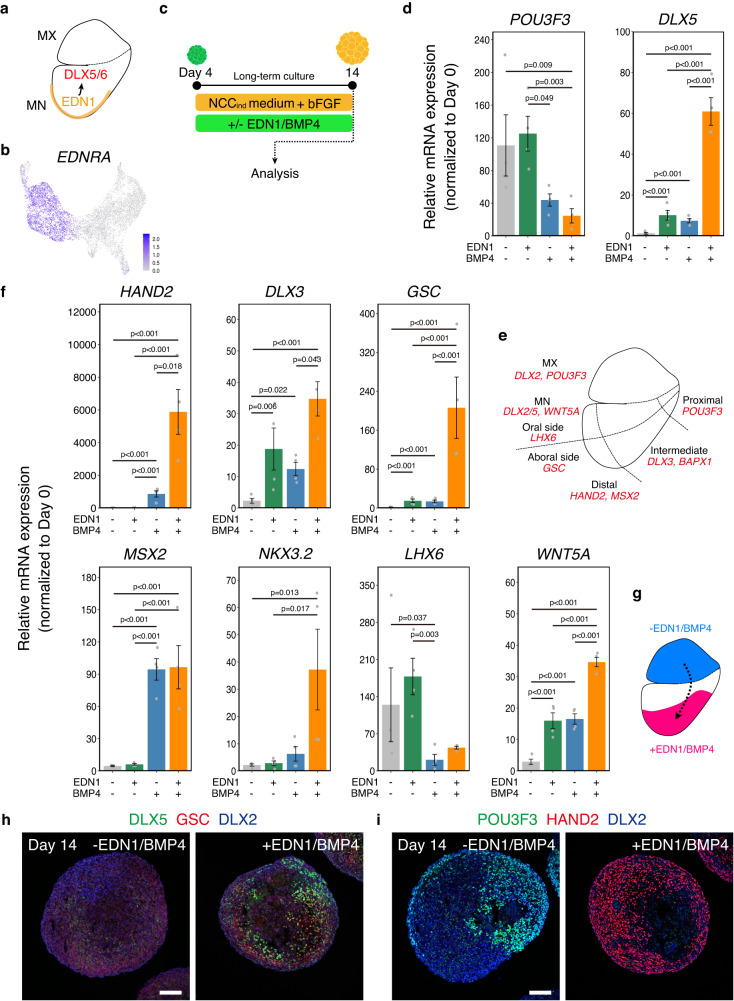
Early patterning of neural crest cells (NCCs) in the craniofacial primordium is important for subsequent development of proper craniofacial structures. However, because of the complexity of the environment of developing tissues, surveying the early specification and patterning of NCCs is difficult. In this study, we develop a simplified in vitro 3D model using human pluripotent stem cells to analyze the early stages of facial development. In this model, cranial NCC-like cells spontaneously differentiate from neural plate border-like cells into maxillary arch-like mesenchyme after a long-term culture. Upon the addition of EDN1 and BMP4, these aggregates are converted into a mandibular arch-like state. Furthermore, temporary treatment with EDN1 and BMP4 induces the formation of spatially separated domains expressing mandibular and maxillary arch markers within a single aggregate. These results suggest that this in vitro model is useful for determining the mechanisms underlying cell fate specification and patterning during early facial development.


Conflict of interest statement

The authors declare no competing interests.

Figures

Fig. 1
Fig. 1. Induction of NCC (neural crest cell)-like cells in the aggregates derived from hPSCs (human pluripotent stem cells).
a Scheme of the differentiation culture for the induction of NCC-like cells. b Immunostaining of the day-5 aggregate with antibodies for SOX10 (green), PAX6 (red), and CDH1 (blue). Scale bar, 100 µm. Three independent cultures were used for experiment and representative images are shown. c Real-time polymerase chain reaction analysis of time-course samples. Day-0 samples were undifferentiated hPSCs and used for normalization. Data are presented as mean ± standard error of mean (n = 3 independent experiments). Source data are provided as a Source Data file. d Immunostaining of the aggregates at days 3, 4, and 5 with antibodies for FOXD3 (green), PAX7 (red), and SOX10 (blue). Scale bar, 100 µm. Three independent cultures were used for experiment and representative images are shown. e Magnifications of areas surrounded by dotted lines in images of day-4 aggregates in (d). Scale bar, 20 µm.
Fig. 2
Fig. 2. Analysis of the cellular content of the day-5 aggregates.
a Uniform manifold approximation and projection of scRNA-seq data from the day-5 aggregates. Cluster number was determined according to the cluster size. Endo endoderm, NCC neural crest cell, NEC neuroepithelial cell, NNE/PPE non-neural ectoderm/pre-placodal epithelium, NPB neural plate border. b Dot plot of key marker genes to define each cluster. c Ratio of the annotated populations in the day-5 aggregates. df Feature plots of genes which characterize NCC-like cells and their progenitors g Violin plots of SOX10, PAX7, FOXD3, and SP5 (hj) Feature plots of genes characterize immature cells, endo-like cells, NNE/PPE-like cells, NCC-derived neuron-like cells, NEC-like cells and placode-derived neuron-like cells.
Fig. 3
Fig. 3. Importance of endogenous WNT/BMP (bone morphogenetic protein) signals during NCC (neural crest cell)-like cell induction.
a Real-time polymerase chain reaction (PCR) analysis of WNT/BMP and downstream genes in time-course samples. Day-0 samples were undifferentiated hPSCs. Data are presented as mean ± standard error of mean (SEM) (n = 3 independent experiments). Source data are provided as a Source Data file. b Scheme of the WNT/BMP inhibition experiment. IWP-2 or dorsomorphin was added on days 1, 2, and 3. Aggregates were analyzed by real-time PCR and immunohistochemistry on day 5. c Real-time PCR analysis of inhibitor-treated aggregates on day 5. Non-treated aggregates were used as control. Data are presented as mean ± SEM (n = 3 independent experiments). Two-tailed Student’s t-test was used. Source data are provided as a Source Data file. d Immunostaining of inhibitor-treated aggregates on day 5 with antibodies for SOX10 (green), PAX6 (red), and CDH1 (blue). Scale bars, 100 µm and 25 µm (magnifications). Three independent cultures were used for experiment and representative images are shown. e Immunostaining of inhibitor-treated aggregates on day 5 with antibodies for PAX6 (green), SIX1 (red), and CDH1 (blue). Scale bars, 100 µm and 25 µm (magnifications). Three independent cultures were used for experiment and representative images are shown. f Scheme representing a hypothesis about the effect of WNT/BMP inhibition. The left illustration indicates the spatial organization of each cellular domain in the early embryo. WNT and BMP forms gradients along anterior-posterior and medial-lateral axes, regulating positional information in the embryo. The right illustration indicates the hypothetical scheme of the effects of WNT/BMP inhibition in vitro. hPSC-derived aggregates generate NCC-like cells preferentially in NCCind medium in intrinsic WNT and BMP-dependent manner as default state. WNT inhibition may change the positional information of the aggregate into more anterior and medial identity and result in the induction of the anterior PPE-like cells. BMP inhibition may induce more medial positional identity and result in the induction of neural cells. NEC neuroepithelial cell, NNE non-neural ectoderm, and PPE pre-placodal epithelium.
Fig. 4
Fig. 4. Characterization of the developmental process of the aggregates.
a UMAP (Uniform manifold approximation and projection) of merged scRNA-seq data (day 2 to day 5). Individual cells are colored by cluster number or sampling date. Endo endoderm, NCC neural crest cell, NEC neuroepithelial cell, NNE/PPE non-neural ectoderm/pre-placodal epithelium, NPB neural plate border, PSC pluripotent stem cell. bg Feature plots of genes associated with PSC-like cells, endoderm-like cells, NPB-like cells, NNE/PPE-like cells, NEC-like cells. h RNA velocities visualized as streamlines on UMAP. i UMAP of scRNA-seq data colored by inferred pseudotime without clusters 10, 18, 21, and 22. j Expression dynamics of PSC, NPB, and NCC-related genes along pseudotime.
Fig. 5
Fig. 5. Recapitulation of gene expression changes associated with EMT (epithelial-mesenchymal transition).
a Expression dynamics of EMT-related genes along pseudotime. b Immunostaining of aggregates with antibodies for FOXD3 (green) and CDH1 (red), and counterstaining with DAPI (blue). FOXD3 and CDH1 were expressed in complementary manner. Scale bar, 100 µm. Three independent cultures were used for experiment and representative images are shown. c Immunostaining of aggregates with antibodies for CDH1 (green), CDH6 (red), and SOX10 (cyan). CDH1 and CDH6 were expressed in complementary manner. SOX10+ cells expressed CDH6 instead of CDH1. Scale bar, 100 µm. Three independent cultures were used for experiment and representative images are shown. d Schematic representation of the presumptive process of NCC (neural crest cell)-like cell induction from hPSCs (human pluripotent stem cells). hPSCs bifurcate into NPB (neural plate border)-like cells or Endo (endoderm)-like cells at first. Then NPB-like cells differentiate into NNE/PPE (non-neural ectoderm/pre-placodal epithelium)-like cells, NEC (neuroepithelial cell)-like cells, and NCC-like cells. NCC-like cell induction depends on aggregate-intrinsic WNT/BMP (bone morphogenetic protein) signals and is associated with EMT-like gene expression changes.
Fig. 6
Fig. 6. Differentiation of the aggregates into craniofacial mesenchyme-like cells.
a Scheme of the long-term culture and bright-field images of the aggregates. Aggregates were cultured with or without bFGF (basic fibroblast growth factor) from day 4. Scale bar, 400 µm. NCC: neural crest cell. Three independent cultures were used for experiment and representative images are shown. b Real-time PCR analysis of craniofacial mesenchyme-related genes. Data are presented as mean ± SEM (n = 3 independent experiments). Two-tailed Student’s t-test was used. Source data are provided as a Source Data file. c Schema of gene expression pattern in the first branchial arch. MN mandibular arch, MX maxillary arch. d Immunostaining of bFGF-treated aggregates on day 28 with antibodies for TWIST1 (green) and counterstaining with DAPI (blue). Scale bars, 200 µm. Three independent cultures were used for experiment and representative images are shown. e Immunostaining of bFGF-treated aggregates on day 28 with antibodies for DLX2 (green), LHX6 (red), and PRRX1 (blue). Scale bars, 100 µm. Three independent cultures were used for experiment and representative images are shown. f Immunostaining of bFGF-treated aggregates on day 28 with antibodies for BARX1 (green) and counterstaining with DAPI (blue). Scale bars, 100 µm. Three independent cultures were used for experiment and representative images are shown.
Fig. 7
Fig. 7. Mandibular arch (MN)-like differentiation of the aggregates.
a Schema of the expression of EDN1 (endothelin 1) and DLX5/6 in first branchial arch. MX: maxillary arch. b Feature plot of EDNRA in scRNA-seq data. c Scheme of long-term culture of aggregates. Aggregates were cultured with or without EDN1 and BMP4 (bone morphogenetic protein 4) in the presence of bFGF (basic fibroblast growth factor) from day 4 and analyzed by real-time PCR and immunohistochemistry at day 14. NCC: neural crest cell. d Real-time PCR analysis of POU3F3, and DLX5, which are expressed in MX and MN, respectively. Data are presented as mean ± SEM (n = 4 independent experiments). Two-way ANOVA with Tukey–Kramer test was used. Source data are provided as a Source Data file. e Schema of the spatial organization of domains in the first branchial arch. f Real-time PCR analysis of the region-specific genes. Data are presented as mean ± SEM (n = 4 independent experiments). Two-way ANOVA with Tukey–Kramer test was used. Source data are provided as a Source Data file. g Hypothetical representation of the effect of EDN1 and BMP4 on regional identity of the aggregates. The aggregates switched their identity from the MX-like to the MN-like, when treated with EDN1 and BMP4 during the long-term culture. h Immunostaining of non-treated aggregates and EDN1/BMP4-treated aggregates on day 14 with antibodies for DLX5 (green), GSC (red), and DLX2 (blue). Scale bar, 100 µm. i Immunostaining of non-treated aggregates and EDN1/BMP4-treated aggregates on day 14 with antibodies for POU3F3 (green), HAND2 (red), and DLX2 (blue). Scale bar, 100 µm. Three independent cultures were used for experiment and representative images are shown.
Fig. 8
Fig. 8. Formation of the 1st BA (first branchial arch)-like aggregates containing both proximal and distal-type cells.
a Schema of the axial organization of the 1st BA. The proximal (dorsal) side is POU3F3+ MX (maxillary arch), and the distal (ventral) side is HAND2+ distal MN (mandibular arch). b Schematic of experiment. The duration of treatment with EDN1 (endothelin 1) and BMP4 (bone morphogenetic protein 4) differed among conditions 1, 2, and 3. The aggregates were analyzed using real-time PCR and immunohistochemistry on day 21. bFGF: basic fibroblast growth factor. c Immunostaining of the day-21 aggregates cultured in each condition with antibodies for POU3F3 (green), HAND2 (red), and DLX2 (blue). Scale bars, 100 µm (the left one) and 200 µm (the others). Three independent cultures were used for experiment and representative images are shown. Cond. 1–3 condition 1–3. d Real-time PCR analysis of the region-specific genes. Data are presented as mean ± SEM (n = 3 independent experiments). One-way ANOVA with Tukey–Kramer test was used. Source data are provided as a Source Data file. e Scheme for differentiation of first branchial arch-like aggregates. When cultured with bFGF alone, the aggregates differentiated into MX-like states, whereas they differentiated into MN-like states in the presence of EDN1 and BMP4. Temporary treatment with EDN1 and BMP4 induced the formation of single aggregates containing both POU3F3+ Mx-like and HAND2+ Mn-like regions.
Fig. 9
Fig. 9. Osteogenic/Chondrogenic differentiation in the aggregates after long-term culture.
a Schema of the long-term culture. After the wash out of EDN1 (endothelin 1) and BMP4 (bone morphogenetic protein 4), the aggregates were cultured in NCCind medium supplemented with only bFGF (basic fibroblast growth factor). NCC neural crest cell. b Immunostaining of the day-35 aggregates with antibodies for SP7 (green), RUNX2 (red), and counterstaining with DAPI (blue). Scale bar, 200 µm. Three independent cultures were used for experiment and representative images are shown. c Immunostaining of the day-35 aggregates with antibodies for NKX3.2 (green), SOX9 (red), and counterstaining with DAPI (blue). Scale bar, 200 µm. Three independent cultures were used for experiment and representative images are shown.

Similar articles

Cited by

References

    1. Santagati F, Rijli FM. Cranial neural crest and the building of the vertebrate head. Nat. Rev. Neurosci. 2003;4:806–818. doi: 10.1038/nrn1221. - DOI - PubMed
    1. Helms JA, Cordero D, Tapadia MD. New insights into craniofacial morphogenesis. Development. 2005;132:851–861. doi: 10.1242/dev.01705. - DOI - PubMed
    1. Yuan Y, et al. Spatiotemporal cellular movement and fate decisions during first pharyngeal arch morphogenesis. Sci. Adv. 2020;6:eabb0119. doi: 10.1126/sciadv.abb0119. - DOI - PMC - PubMed
    1. Fukuta M, et al. Derivation of mesenchymal stromal cells from pluripotent stem cells through a neural crest lineage using small molecule compounds with defined media. PLoS ONE. 2014;9:e112291. doi: 10.1371/journal.pone.0112291. - DOI - PMC - PubMed
    1. Leung AW, et al. WNT/β-catenin signaling mediates human neural crest induction via a pre-neural border intermediate. Development. 2016;143:398–410. doi: 10.1242/dev.130849. - DOI - PMC - PubMed