

A diagnostic model based on bioinformatics and machine learning to differentiate bipolar disorder from schizophrenia and major depressive disorder
- PMID: 38355593
- PMCID: PMC10866880
- DOI: 10.1038/s41537-023-00417-1
A diagnostic model based on bioinformatics and machine learning to differentiate bipolar disorder from schizophrenia and major depressive disorder
Abstract
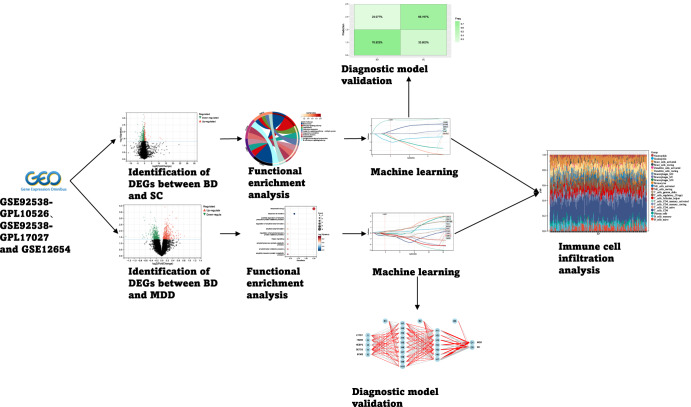
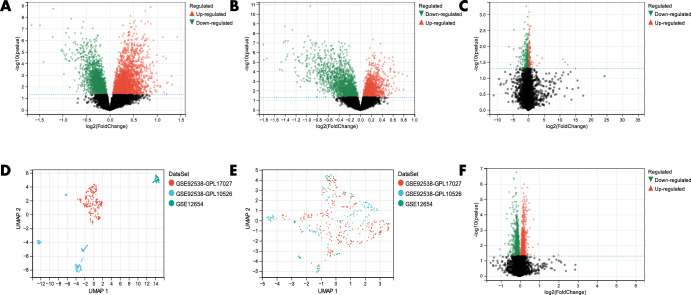
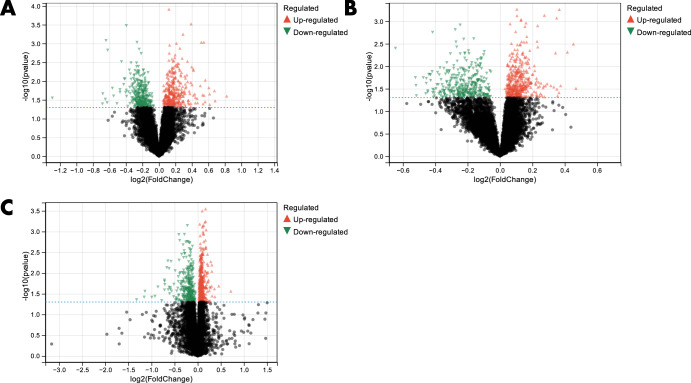
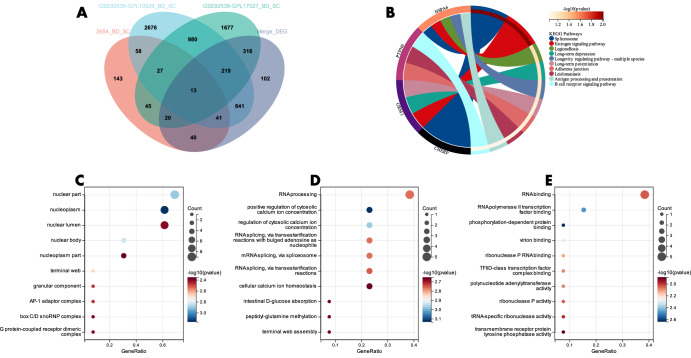
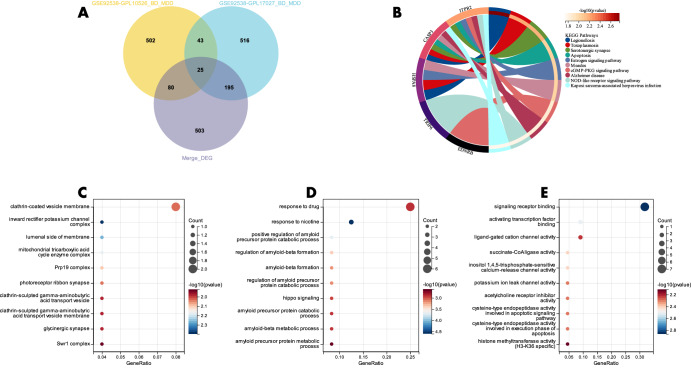
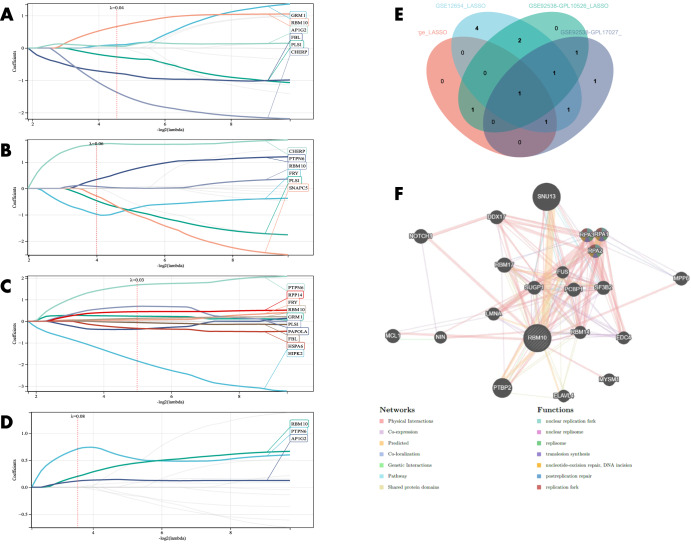
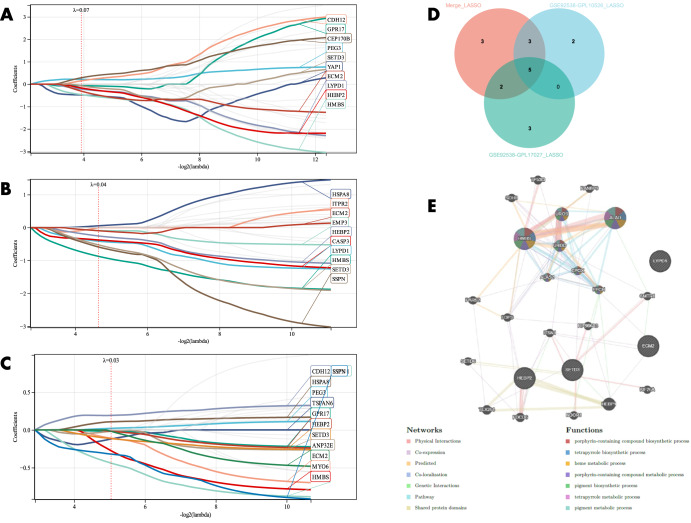
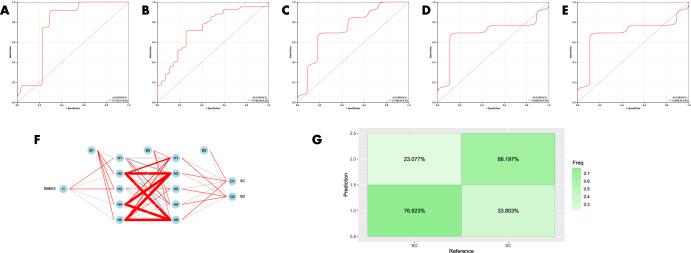
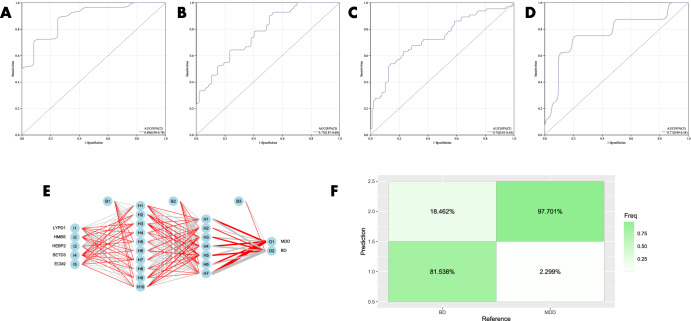
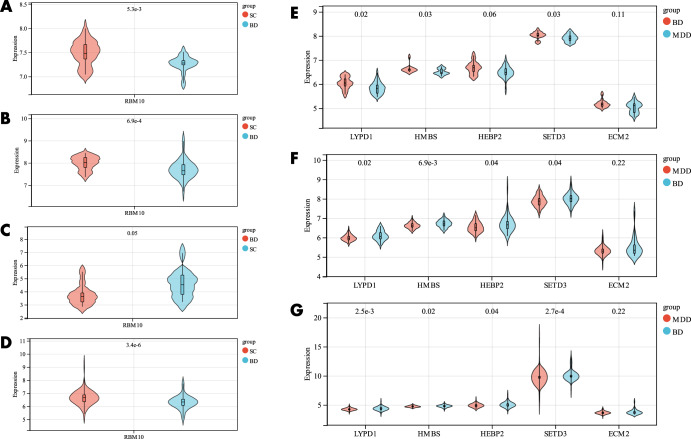
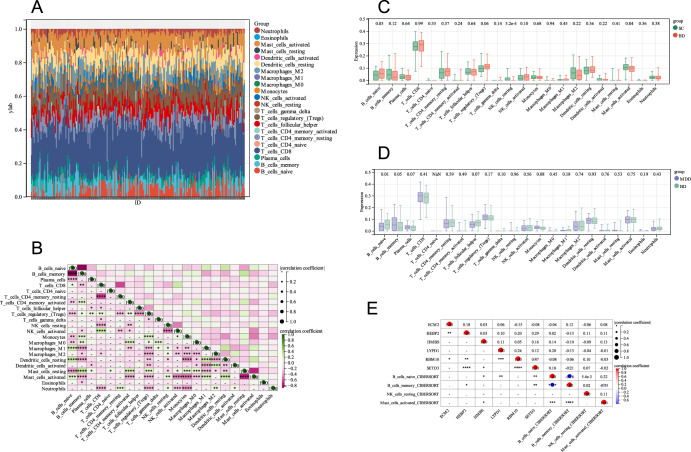
Bipolar disorder (BD) showed the highest suicide rate of all psychiatric disorders, and its underlying causative genes and effective treatments remain unclear. During diagnosis, BD is often confused with schizophrenia (SC) and major depressive disorder (MDD), due to which patients may receive inadequate or inappropriate treatment, which is detrimental to their prognosis. This study aims to establish a diagnostic model to distinguish BD from SC and MDD in multiple public datasets through bioinformatics and machine learning and to provide new ideas for diagnosing BD in the future. Three brain tissue datasets containing BD, SC, and MDD were chosen from the Gene Expression Omnibus database (GEO), and two peripheral blood datasets were selected for validation. Linear Models for Microarray Data (Limma) analysis was carried out to identify differentially expressed genes (DEGs). Functional enrichment analysis and machine learning were utilized to identify. Least absolute shrinkage and selection operator (LASSO) regression was employed for identifying candidate immune-associated central genes, constructing protein-protein interaction networks (PPI), building artificial neural networks (ANN) for validation, and plotting receiver operating characteristic curve (ROC curve) for differentiating BD from SC and MDD and creating immune cell infiltration to study immune cell dysregulation in the three diseases. RBM10 was obtained as a candidate gene to distinguish BD from SC. Five candidate genes (LYPD1, HMBS, HEBP2, SETD3, and ECM2) were obtained to distinguish BD from MDD. The validation was performed by ANN, and ROC curves were plotted for diagnostic value assessment. The outcomes exhibited the prediction model to have a promising diagnostic value. In the immune infiltration analysis, Naive B, Resting NK, and Activated Mast Cells were found to be substantially different between BD and SC. Naive B and Memory B cells were prominently variant between BD and MDD. In this study, RBM10 was found as a candidate gene to distinguish BD from SC; LYPD1, HMBS, HEBP2, SETD3, and ECM2 serve as five candidate genes to distinguish BD from MDD. The results obtained from the ANN network showed that these candidate genes could perfectly distinguish BD from SC and MDD (76.923% and 81.538%, respectively).
© 2024. The Author(s).
Conflict of interest statement
The authors declare no competing interests.
Figures
Similar articles
-
Machine learning-based predictive models and drug prediction for schizophrenia in multiple programmed cell death patterns.Front Mol Neurosci. 2023 Mar 13;16:1123708. doi: 10.3389/fnmol.2023.1123708. eCollection 2023. Front Mol Neurosci. 2023. PMID: 36993785 Free PMC article.
-
Bioinformatics analysis and prediction of Alzheimer's disease and alcohol dependence based on Ferroptosis-related genes.Front Aging Neurosci. 2023 Jul 13;15:1201142. doi: 10.3389/fnagi.2023.1201142. eCollection 2023. Front Aging Neurosci. 2023. PMID: 37520121 Free PMC article.
-
Identification of the role of immune-related genes in the diagnosis of bipolar disorder with metabolic syndrome through machine learning and comprehensive bioinformatics analysis.Front Psychiatry. 2023 Oct 4;14:1187360. doi: 10.3389/fpsyt.2023.1187360. eCollection 2023. Front Psychiatry. 2023. PMID: 37860165 Free PMC article.
-
Schizophrenia and cell senescence candidate genes screening, machine learning, diagnostic models, and drug prediction.Front Psychiatry. 2023 Apr 11;14:1105987. doi: 10.3389/fpsyt.2023.1105987. eCollection 2023. Front Psychiatry. 2023. PMID: 37113536 Free PMC article.
-
Identification of Immune-Associated Genes in Diagnosing Aortic Valve Calcification With Metabolic Syndrome by Integrated Bioinformatics Analysis and Machine Learning.Front Immunol. 2022 Jul 4;13:937886. doi: 10.3389/fimmu.2022.937886. eCollection 2022. Front Immunol. 2022. PMID: 35865542 Free PMC article.
Cited by
-
A novel anxiety-associated SNP identified in LYNX2 (LYPD1) is associated with decreased protein binding to nicotinic acetylcholine receptors.Front Behav Neurosci. 2024 Dec 23;18:1347543. doi: 10.3389/fnbeh.2024.1347543. eCollection 2024. Front Behav Neurosci. 2024. PMID: 39763615 Free PMC article.
-
Detecting depression severity using weighted random forest and oxidative stress biomarkers.Sci Rep. 2024 Jul 15;14(1):16328. doi: 10.1038/s41598-024-67251-y. Sci Rep. 2024. PMID: 39009760 Free PMC article.
References
Grants and funding
LinkOut - more resources
Full Text Sources
Miscellaneous
