. 2024 Feb 14;15(1):1367.
doi: 10.1038/s41467-024-45561-z.

Epigenetic regulation of CD38/CD48 by KDM6A mediates NK cell response in multiple myeloma

Affiliations

Epigenetic regulation of CD38/CD48 by KDM6A mediates NK cell response in multiple myeloma

Jiye Liu et al. Nat Commun. .

Abstract

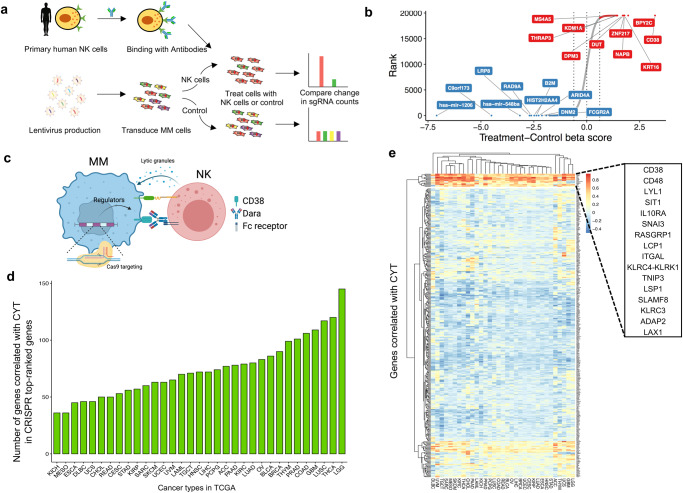
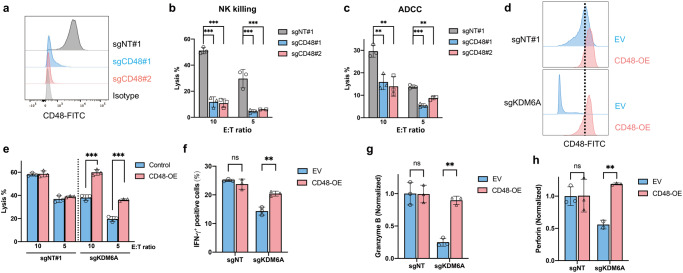
Anti-CD38 monoclonal antibodies like Daratumumab (Dara) are effective in multiple myeloma (MM); however, drug resistance ultimately occurs and the mechanisms behind this are poorly understood. Here, we identify, via two in vitro genome-wide CRISPR screens probing Daratumumab resistance, KDM6A as an important regulator of sensitivity to Daratumumab-mediated antibody-dependent cellular cytotoxicity (ADCC). Loss of KDM6A leads to increased levels of H3K27me3 on the promoter of CD38, resulting in a marked downregulation in CD38 expression, which may cause resistance to Daratumumab-mediated ADCC. Re-introducing CD38 does not reverse Daratumumab-mediated ADCC fully, which suggests that additional KDM6A targets, including CD48 which is also downregulated upon KDM6A loss, contribute to Daratumumab-mediated ADCC. Inhibition of H3K27me3 with an EZH2 inhibitor resulted in CD38 and CD48 upregulation and restored sensitivity to Daratumumab. These findings suggest KDM6A loss as a mechanism of Daratumumab resistance and lay down the proof of principle for the therapeutic application of EZH2 inhibitors, one of which is already FDA-approved, in improving MM responsiveness to Daratumumab.


Conflict of interest statement

K.C.A. serves on advisory boards to Pfizer, AstraZeneca, Janssen, Starton, Window, and Bristol Myers Squibb; and is a Founder of OncoPep, C4 Therapeutics, Dynamic Cell Therapies, and NextRNA. All the other authors declare no competing interests.

Figures

Fig. 1
Fig. 1. CRISPR screen identifies cell-intrinsic genes regulating the sensitivity of MM cells to Dara-mediated NK cell cytotoxicity.
a Schematic of genome-wide CRISPR screen in a MM cell line treated with Dara and human primary NK cells. b Top genes for enriched (red) and depleted (blue) sgRNAs from the screen. Candidate genes were plotted based on the beta score, computed by MaGeCK (Model-based Analysis of Genome-wide CRISPR-Cas9 Knockout) of sgRNAs normalized to control. c Schematic of the CRISPR assay to identify essential genes for Dara-NK-mediated ADCC. d TCGA RNA-seq data from 36 human cancer types were analyzed to obtain genes positively correlated with cytolytic (CYT) activity. The number of overlapped genes between our top candidates and CYT activity-related genes was quantified in each cancer type. e Heatmap showing the partitioning of the clusters of genes based on Pearson’s correlation coefficient values of CRISPR screen hits with CYT activity using pan-cancer TCGA data. Figure 1c was created with BioRender.com.
Fig. 2
Fig. 2. KDM6A loss inhibits the expression of CD38.
a Schematic of the second genome-wide CRISPR screen in a MM cell line. Five percent of cells with the lowest expression of CD38 were collected for next-generation sequencing. b Top genes for enriched (red) and depleted (blue) gRNAs from the screen. c Venn diagram showing the overlapped enriched genes between the two CRISPR screens. d Western blot of CD38 protein levels in MM cell lines with CRISPR-mediated knock (KO) of KDM6A. e q-RT-PCR for CD38 mRNA in MM cell lines transfected with indicated sgRNAs. Data were normalized against GAPDH (mean ± SEM, n = 3 biologically independent experiments). ***p < 0.001; ****p < 0.0001 (two-sided student’s t test). f Representative flow cytometry analysis of CD38 expression in H929 single clones transfected with indicated sgRNAs. g Western blotting of CD38 protein levels after ectopic overexpression of KDM6A in KDM6A-KO H929 cells. OE, overexpression. Three independent experiments were performed and similar results were obtained. h Representative flow cytometry analysis of CD38 expression level after ectopic overexpression of KDM6A in KDM6A-KO H929 cells. Source data are provided as a Source Data file.
Fig. 3
Fig. 3. KDM6A regulates CD38 expression at the transcriptional level.
a Genome-wide heatmaps of H3K27me3 ChIP-seq peak centered signal in KDM6A WT and KO H929 cells. b ChIP-seq density profiles for H3K27me3 at the CD38 promoter region in KDM6A WT and KO H929 cells. c, H3K27me3 ChIP-qPCR analysis at the CD38 gene in KDM6A WT and KO H929 cells (mean ± SEM, n = 3 biologically independent experiments). *p < 0.05; **p < 0.01; ***p < 0.001 (two-sided student’s t test). d Genome-wide analysis of differentially accessible chromatin sites (|log2 fold change|> 0.5) following KDM6A KO in H929 cells. e The intensities of peaks at the CD38 locus across the three samples are compared. The violin plot describes the distribution of peak intensity values. The width describes how often the intensity value occurs in the data set. The ends of the middle vertical line define the minimum and maximum values. Box plots represent the median, 25th, and 75th percentiles, and the thick dots represent outliers. The actual intensity values under different conditions are also marked in the figure. f Western blot of CD38 and H3K27me3 levels in KMS11 Dara-sensitive and Dara-resistant cells. Three independent experiments were performed and similar results were obtained. g H3K27me3 ChIP-qPCR analysis at the CD38 gene in KMS11 Dara-sensitive and Dara-resistant cells (mean ± SEM, n = 3 biologically independent experiments). ***p < 0.001 (two-sided student’s t test). q-RT-PCR for KDM6A (h) and CD38 (i) mRNA in newly diagnosed (N/D) (n = 7) and Dara-resistant (R/R) (n = 12) patient MM samples. Data were normalized against GAPDH (mean ± SEM). ***p < 0.001 (two-sided student’s t test). Source data are provided as a Source Data file.
Fig. 4
Fig. 4. KDM6A KO decreases CD38 mAb-mediated ADCC.
KDM6A WT and KO H929 cells were co-cultured with primary human NK cells and Dara (a) or Isa (b), and subjected to ADCC assay (mean ± SEM, n = 3 biologically independent experiments). ***p < 0.001 (two-sided student’s t test). c Bioluminescent imaging of mice transplanted with KDM6A KO or WT H929 cells and treated with human primary NK cells or NK+Dara (8 mg/kg). Representative images of five mice for each group are shown at the indicated time. d Kaplan-Meier survival curves of mice in c. Schematic design of ELISA assay (e). KDM6A WT or KO H929 cells were co-cultured with Dara or primary NK cells for 6 hours, and the supernatant was collected for Perforin (f) and Granzyme B (g) ELISA assay (mean ± SEM, n = 3 biologically independent experiments). **p < 0.01; ***p < 0.001 (Student’s test). h Intracellular IFN-γ staining of primary NK cells co-cultured with KDM6A WT or KO H929 cells and Dara for 6 hours (mean ± SEM, n = 3 biologically independent experiments). *p < 0.05; **p < 0.01 (two-sided student’s t test). Source data are provided as a Source Data file.
Fig. 5
Fig. 5. KDM6A regulates CD48 expression in MM cells.
a Normalized lysis percentage of KDM6A WT or KO H929 cells after co-culture with primary NK cells at different E:T ratios with IL-2 for 6 hours (mean ± SEM, n = 3 biologically independent experiments). *p < 0.05; **p < 0.01; ***p < 0.001 (two-sided student’s t test). b Intracellular IFN-γ staining of primary NK cells co-cultured with KDM6A WT or KO H929 cells with IL-2 for 6 hours (mean ± SEM, n = 3 biologically independent experiments). **p < 0.01 (two-sided student’s t test). c Volcano plot of differentially expressed genes in KDM6A KO H929 cells compared with WT cells assessed by RNA-seq. d Venn diagram showing the overlapped enriched genes between the CRISPR screen and RNA-seq. e, Representative flow cytometry analysis of CD48 expression in H929 transfected with indicated sgRNAs. f q-RT-PCR for CD48 mRNA in H929 cells transfected with indicated sgRNAs. Data were normalized against GAPDH (mean ± SEM, n = 3 biologically independent experiments). ****p < 0.0001 (two-sided student’s t test). g, ChIP-seq density profiles for H3K27me3 on the CD48 gene in KDM6A WT and KO H929 cells. h, H3K27me3 ChIP-qPCR analysis at the CD48 gene in KDM6A WT and KO H929 cells (mean ± SEM, n = 3 biologically independent experiments). ***p < 0.001 (two-sided student’s t test). i, ATAC-seq density profiles at the CD48 promoter region in KDM6A WT and KO H929 cells. j q-RT-PCR for CD48 mRNA in newly diagnosed (N/D) (n = 7) and Dara-resistant (R/R) (n = 12) patient samples. Data were normalized against GAPDH (mean ± SEM). *p < 0.05 (two-sided student’s t test). Source data are provided as a Source Data file.
Fig. 6
Fig. 6. CD48 mediates ADCC sensitivity through NK activity regulation.
a Representative flow cytometry analysis of CD48 expression in H929 cells transfected with indicated sgRNAs. b Normalized lysis percentage of CD48 WT or KO H929 cells after co-culture with primary NK cells at different E:T ratios with IL-2 for 6 hours (mean ± SEM, n = 3 biologically independent experiments). ***p < 0.001 (two-sided student’s t test). c CD48 WT and KO H929 cells were co-cultured with primary human NK cells and Dara at different E:T ratios, and subjected to ADCC assay (mean ± SEM, n = 3 biologically independent experiments). **p < 0.01; ***p < 0.001 (two-sided student’s t test). d Representative flow cytometry analysis of CD48 expression in KDM6A KO and control H929 cells after ectopic overexpression of CD48. e ADCC assay of KDM6A KO and WT H929 cells after ectopic overexpression of CD48 and co-cultured with primary human NK cells and Dara at different E:T ratios (mean ± SEM, n = 3 biologically independent experiments). ***p < 0.001 (two-sided student’s t test). f Intracellular IFN-γ staining of primary NK cells co-cultured with KDM6A WT or KO H929 cells after ectopic overexpression of CD48 with Dara for 6 hours (mean ± SEM, n = 3 biologically independent experiments). ns, not significant; **p < 0.01 (two-sided student’s t test). KDM6A KO or control H929 cells after ectopic overexpression of CD48 were co-cultured with Dara and primary NK cells for 6 hours, and the supernatant was collected for granzyme B (g) and perforin (h) ELISA assay (mean ± SEM, n = 3 biologically independent experiments). ns, not significant; **p < 0.01 (two-sided student’s t test). Source data are provided as a Source Data file.
Fig. 7
Fig. 7. EZH2 inhibitors increase CD38 and CD48 expression and enhance Dara-mediated ADCC.
a Schematic utilizing EZH2 inhibitor to balance the expression of CD38 and CD48 in KDM6A-KO MM cells. b, Western blot of CD38 and CD48 protein levels in KDM6A-KO and control H929 cells treated with Taze (5 μM) for 4 days. q-RT-PCR for CD38 (c) and CD48 (d) mRNA in KDM6A-KO and control H929 cells treated with Taze (5 μM) for 4 days. Data were normalized against GAPDH (mean ± SEM, n = 3 biologically independent experiments). ns, not significant; ***p < 0.001 (two-sided student’s t test). e Representative flow cytometry analysis of CD38 and CD48 expression in KDM6A WT and KO H929 cells treated with Taze (5 μM) for 4 days. H3K27me3 ChIP-qPCR analysis at the CD38 (f) and CD48 (g) genes in KDM6A WT and KO H929 cells (mean ± SEM, n = 3 biologically independent experiments). ***p < 0.001 (two-sided student’s t test). KDM6A WT and KO H929 cells were treated with Taze (5 μM) for 4 days, then co-cultured with primary human NK cells and Dara (h) or Isa (i) and subjected to ADCC assay (mean ± SEM, n = 3 biologically independent experiments). ns, not significant; **p < 0.01 (two-sided student’s t test). j KDM6A WT and KO H929 cells were treated with Taze (5 μM) for 4 days, and then co-cultured with Dara and primary NK cells for 6 hours. The supernatant was collected for granzyme B ELISA assay (mean ± SEM, n = 3 biologically independent experiments). **p < 0.01; ***p < 0.001 (two-sided student’s t test). k The patients’ MM cells were treated with DMSO or Taze (5 μM) for 4 days, followed by the addition of Dara and incubation for 12 hours. Cell cytotoxicity was assessed by flow cytometry. (n = 10 for each group). Box plots represent the median, 25th, and 75th percentiles, and whiskers represent the values of min and max. *p < 0.05 (two-sided paired student’s t test). Source data are provided as a Source Data file.
Fig. 8
Fig. 8. Schema of epigenetic regulation of NK cell-mediated immune response in multiple myeloma monoclonal antibody therapy.
The loss or inactivation of KDM6A increased the level of H3K27me3, resulting in the downregulation of both CD38 and CD48 expression, which led to reduced ADCC. Lowering the H3K27me3 with an EZH2 inhibitor restored sensitivity to Dara through CD38 and CD48 upregulation. This Figure was created with BioRender.com.

Similar articles

Cited by

References

    1. Palumbo A, Anderson K. Multiple myeloma. N. Engl. J. Med. 2011;364:1046–1060. doi: 10.1056/NEJMra1011442. - DOI - PubMed
    1. Kuehl WM, Bergsagel PL. Multiple myeloma: evolving genetic events and host interactions. Nat. Rev. Cancer. 2002;2:175–187. doi: 10.1038/nrc746. - DOI - PubMed
    1. Kumar SK, Anderson KC. Immune therapies in multiple myeloma. Clin. Cancer Res. 2016;22:5453–5460. doi: 10.1158/1078-0432.CCR-16-0868. - DOI - PubMed
    1. Tai YT, et al. Anti-CS1 humanized monoclonal antibody HuLuc63 inhibits myeloma cell adhesion and induces antibody-dependent cellular cytotoxicity in the bone marrow milieu. Blood. 2008;112:1329–1337. doi: 10.1182/blood-2007-08-107292. - DOI - PMC - PubMed
    1. Lonial S, et al. Elotuzumab in combination with lenalidomide and low-dose dexamethasone in relapsed or refractory multiple myeloma. J. Clin. Oncol. 2012;30:1953–1959. doi: 10.1200/JCO.2011.37.2649. - DOI - PubMed