. 2024 Feb 14;14(1):3702.
doi: 10.1038/s41598-023-50228-8.

Assessing respiratory epidemic potential in French hospitals through collection of close contact data (April-June 2020)

Affiliations

Assessing respiratory epidemic potential in French hospitals through collection of close contact data (April-June 2020)

George Shirreff et al. Sci Rep. .

Abstract

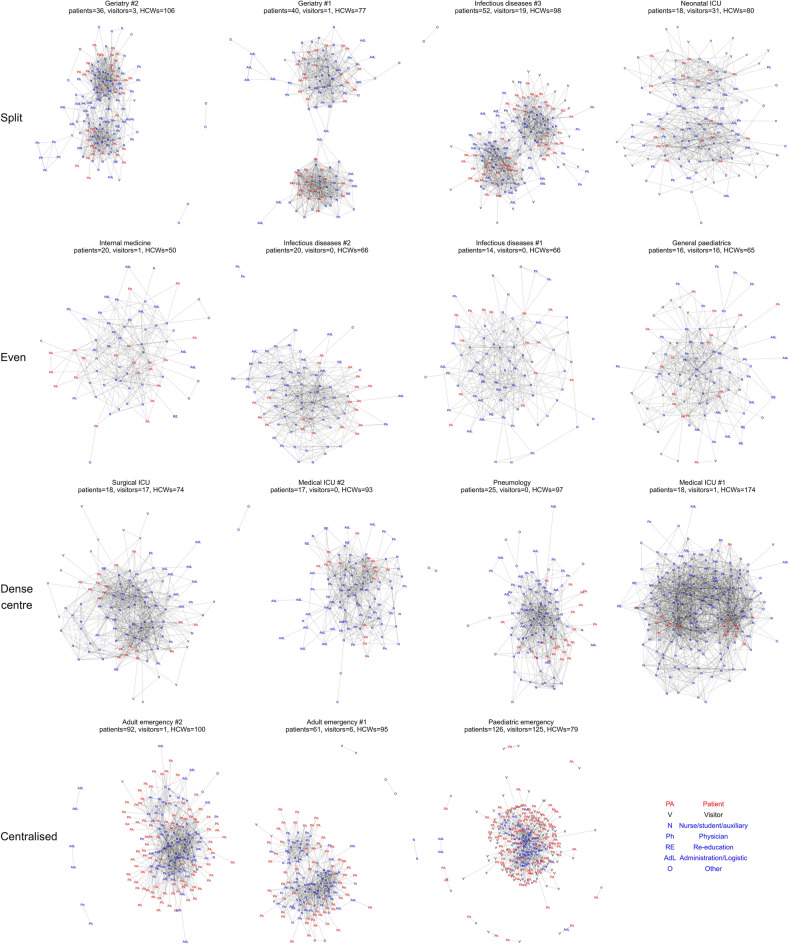
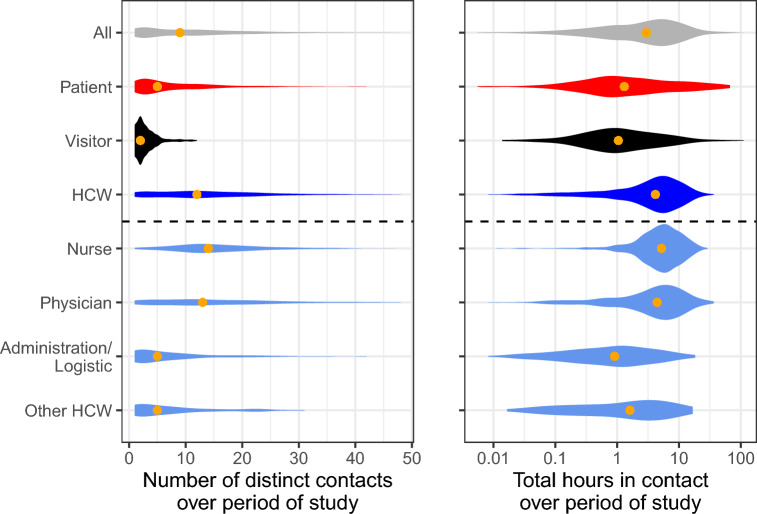
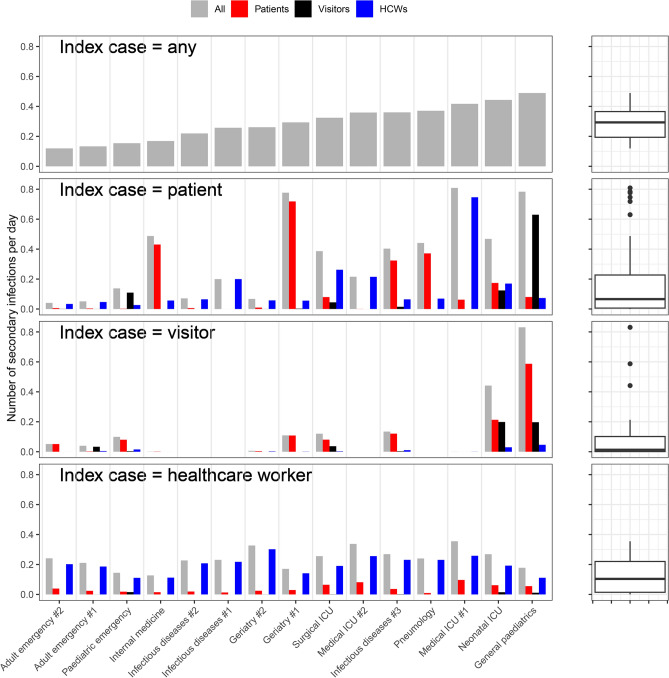
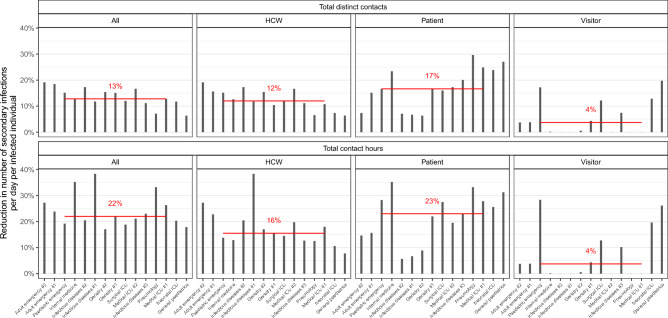
The transmission risk of SARS-CoV-2 within hospitals can exceed that in the general community because of more frequent close proximity interactions (CPIs). However, epidemic risk across wards is still poorly described. We measured CPIs directly using wearable sensors given to all present in a clinical ward over a 36-h period, across 15 wards in three hospitals in April-June 2020. Data were collected from 2114 participants and combined with a simple transmission model describing the arrival of a single index case to the ward to estimate the risk of an outbreak. Estimated epidemic risk ranged four-fold, from 0.12 secondary infections per day in an adult emergency to 0.49 per day in general paediatrics. The risk presented by an index case in a patient varied 20-fold across wards. Using simulation, we assessed the potential impact on outbreak risk of targeting the most connected individuals for prevention. We found that targeting those with the highest cumulative contact hours was most impactful (20% reduction for 5% of the population targeted), and on average resources were better spent targeting patients. This study reveals patterns of interactions between individuals in hospital during a pandemic and opens new routes for research into airborne nosocomial risk.


Conflict of interest statement

The authors declare no competing interests.

Figures

Figure 1
Figure 1
Representations of contact networks within a ward. Each individual is a node and each link a contact, regardless of duration. Each row represents a different characteristic network shape, as indicated by the labels on the left. The numbers present of each status are given in the subtitle.
Figure 2
Figure 2
Connectivity of all status and functions of individuals across all wards. The depth of the violin represents the frequency of that value, and the total volume of each violin is equal. The orange point indicates the median of the distribution.
Figure 3
Figure 3
Contact intensity between statuses of individuals on each ward. Each panel represents a ward, and each cell represents the total cumulative contact minutes that each type of individual (patient, visitor or HCW, columns) has with each type of individual (rows) per hour spent carrying the sensor. Where the type of individual is not present, the corresponding column is grey.
Figure 4
Figure 4
Predicted number of secondary infections per day from a single index case. Each panel represents a different hypothetical index infection, and the coloured bars represent the number of individuals of each status expected to be directly infected per day. The boxplots on the right illustrate the range of values in each bar plot.
Figure 5
Figure 5
The percentage reduction in number of secondary infections per day per infected individual, when the most connected 5% of the population are completely protected. In the top row, individuals were targeted by the number of distinct contacts, while in the bottom row they were targeted by total contact hours. In each panel, the 5% are taken only from the group indicated on the panel column. Each bar represents a single ward, and the horizontal red line represents the median across all wards.

References

    1. Read JM, et al. Hospital-acquired SARS-CoV-2 infection in the UK’s first COVID-19 pandemic wave. Lancet. 2021;398:1037–1038. doi: 10.1016/S0140-6736(21)01786-4. - DOI - PMC - PubMed
    1. Evans S, et al. The impact of testing and infection prevention and control strategies on within-hospital transmission dynamics of COVID-19 in English hospitals. Philos. Transact. Royal Soc. B: Biol. Sci. 2021;376:20200268. doi: 10.1098/rstb.2020.0268. - DOI - PMC - PubMed
    1. Temime L, et al. A conceptual discussion about R0 of SARS-COV-2 in healthcare settings. Clin. Infect. Dis. 2020 doi: 10.1093/cid/ciaa682. - DOI - PMC - PubMed
    1. Smith DRM, et al. Optimizing COVID-19 surveillance in long-term care facilities: A modelling study. BMC Med. 2020;18:386. doi: 10.1186/s12916-020-01866-6. - DOI - PMC - PubMed
    1. Abbas M, et al. Nosocomial transmission and outbreaks of coronavirus disease 2019: The need to protect both patients and healthcare workers. Antimicrob. Resist. Infect Control. 2021;10:1. doi: 10.1186/s13756-020-00875-7. - DOI - PMC - PubMed