

Visual field progression patterns in the ocular hypertension treatment study correspond to vulnerability regions of the disc
- PMID: 38355667
- PMCID: PMC11126578
- DOI: 10.1038/s41433-024-02949-x
Visual field progression patterns in the ocular hypertension treatment study correspond to vulnerability regions of the disc
Abstract
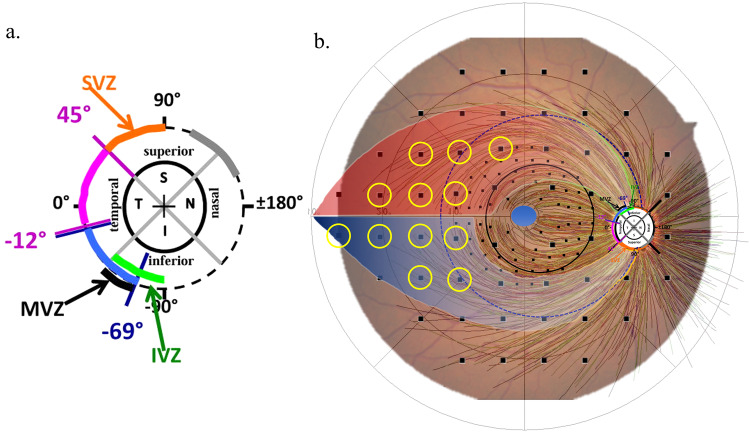
Objectives: To determine the locations on the 24-2 visual field (VF) testing grid that are most likely to progress in patients with ocular hypertension (OHTN). Based on a structural model of superior and inferior areas of relative vulnerability at the optic disc, we hypothesized that the nasal and paracentral regions are more prone to show a reduction in sensitivity.
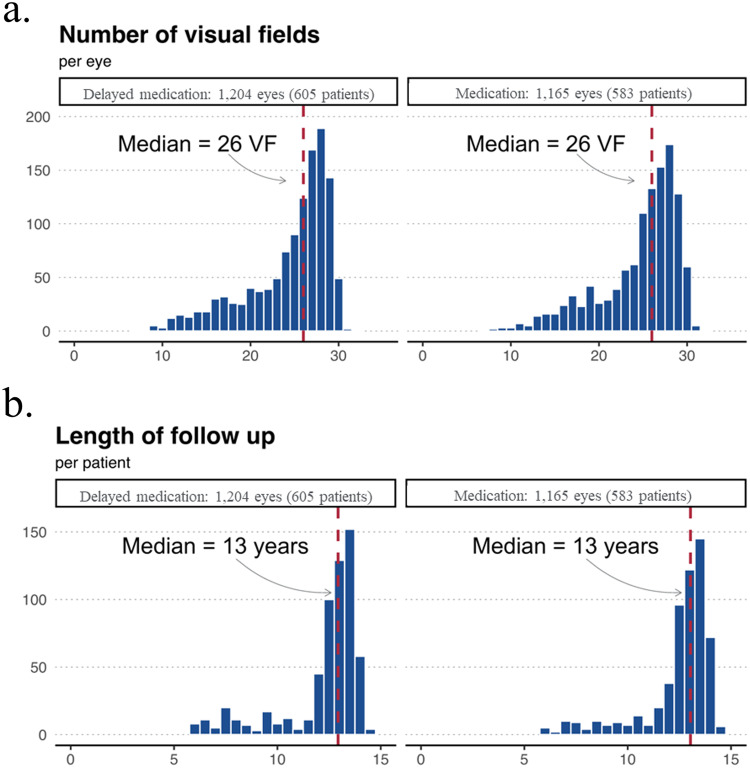
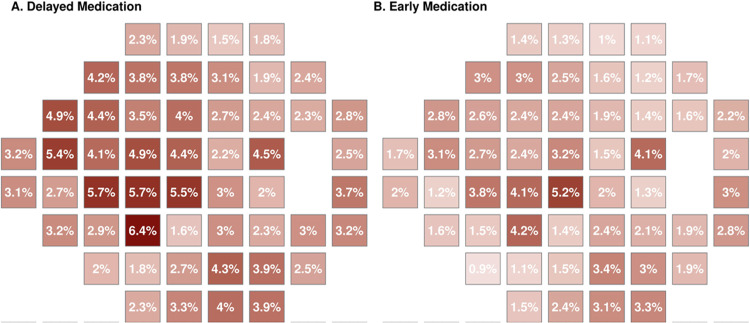
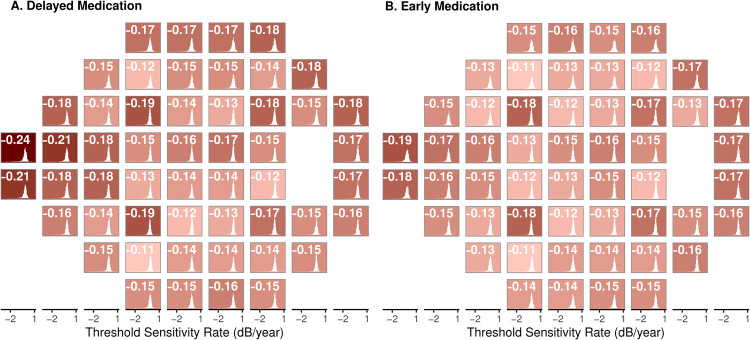
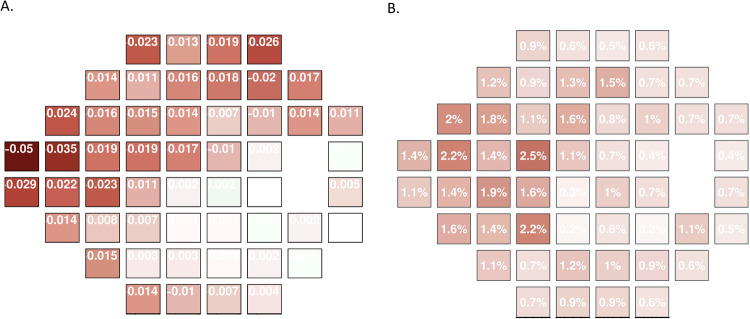
Methods: Posthoc analysis of data collected in phases 1 and 2 of the Ocular Hypertension Treatment Study (OHTS). A pointwise analysis was applied to determine the progression patterns in the early and delayed treatment groups. Each group's progression rate and frequency were calculated for each of the 52 locations corresponding to the 24-2 VF strategy, using trend- and event-based analyses, respectively.
Results: For the event-based analysis, the events were most commonly found in the nasal and paracentral regions. The same regions, with some modest variation, were found to have the fastest rates of progression (ROP) measured with trend analysis. A similar pattern of progression was observed in both the early and delayed treatment groups. The difference in event rates and ROP between the early and delayed treatment groups was also greatest in the nasal and paracentral regions.
Conclusions: Development of VF loss in ocular hypertensive eyes appears to be consistent with the vulnerability zones previously described in glaucomatous eyes with established VF loss. Ocular hypotensive treatment likely helps to slow the rate of progression in these regions. This suggests that careful monitoring of these locations may be useful.
© 2024. The Author(s), under exclusive licence to The Royal College of Ophthalmologists.
Conflict of interest statement
Carlos G. De Moraes: Carl Zeiss Meditec, Inc. (C); Novartis (C); Heidelberg Engineering (R); Topcon (F); Galimedix (C); Perfuse Therapeutics (C); Ora Clinical, Inc. (E) Jeffrey M. Liebmann: Novartis (R), Alcon (C), Allergan (C), Genentech (C), Thea (C).
Figures
Similar articles
-
Visual Field Progression in the Ocular Hypertension Treatment Study.Am J Ophthalmol. 2025 Mar;271:360-370. doi: 10.1016/j.ajo.2024.11.017. Epub 2024 Dec 6. Am J Ophthalmol. 2025. PMID: 39647569 Clinical Trial.
-
The association between glaucomatous visual fields and optic nerve head features in the Ocular Hypertension Treatment Study.Ophthalmology. 2006 Sep;113(9):1603-12. doi: 10.1016/j.ophtha.2006.05.061. Ophthalmology. 2006. PMID: 16949445 Clinical Trial.
-
Quality of Life and Primary Open-Angle Glaucoma in the Ocular Hypertension Treatment Study.JAMA Ophthalmol. 2024 Oct 1;142(10):935-942. doi: 10.1001/jamaophthalmol.2024.3282. JAMA Ophthalmol. 2024. PMID: 39207774 Clinical Trial.
-
The rate of visual field change in the ocular hypertension treatment study.Invest Ophthalmol Vis Sci. 2012 Jan 25;53(1):224-7. doi: 10.1167/iovs.10-7117. Invest Ophthalmol Vis Sci. 2012. PMID: 22159015 Free PMC article. Clinical Trial.
-
Effect of treatment on the rate of visual field change in the ocular hypertension treatment study observation group.Invest Ophthalmol Vis Sci. 2012 Apr 2;53(4):1704-9. doi: 10.1167/iovs.11-8186. Invest Ophthalmol Vis Sci. 2012. PMID: 22395889 Free PMC article. Clinical Trial.
Cited by
-
Should We Fear Wipe-Out in Glaucoma Surgery?Diagnostics (Basel). 2025 Jun 20;15(13):1571. doi: 10.3390/diagnostics15131571. Diagnostics (Basel). 2025. PMID: 40647570 Free PMC article. Review.
References
-
- Medeiros FA, Zangwill LM, Bowd C, Vessani RM, Susanna R, Weinreb RN. Evaluation of retinal nerve fiber layer, optic nerve head, and macular thickness measurements for glaucoma detection using optical coherence tomography. Am J Ophthalmol. 2005;139:44–55. doi: 10.1016/j.ajo.2004.08.069. - DOI - PubMed
Publication types
MeSH terms
Substances
LinkOut - more resources
Full Text Sources
