. 2024 Feb 14;14(1):3752.
doi: 10.1038/s41598-024-53098-w.

Single-cell analysis reveals the spatial-temporal expression of genes associated with esophageal malformations

Affiliations

Single-cell analysis reveals the spatial-temporal expression of genes associated with esophageal malformations

Carlo Maj et al. Sci Rep. .

Abstract

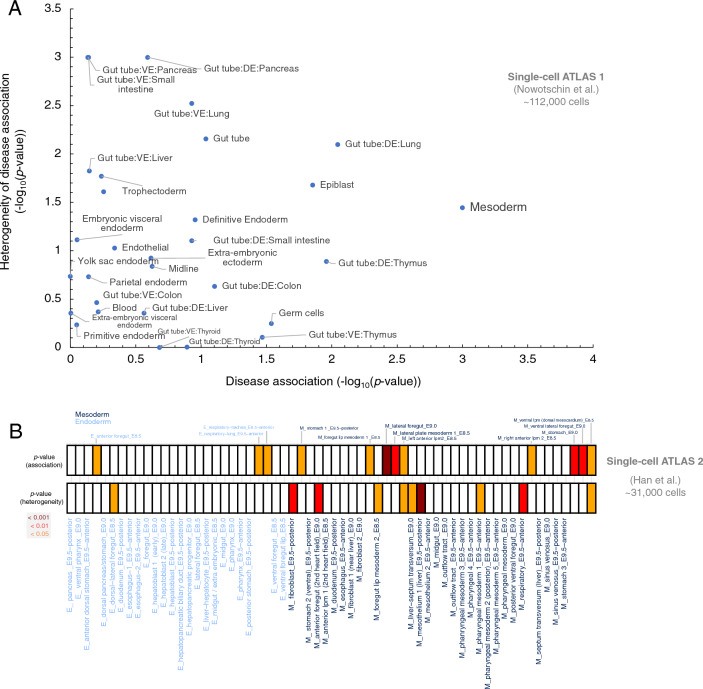
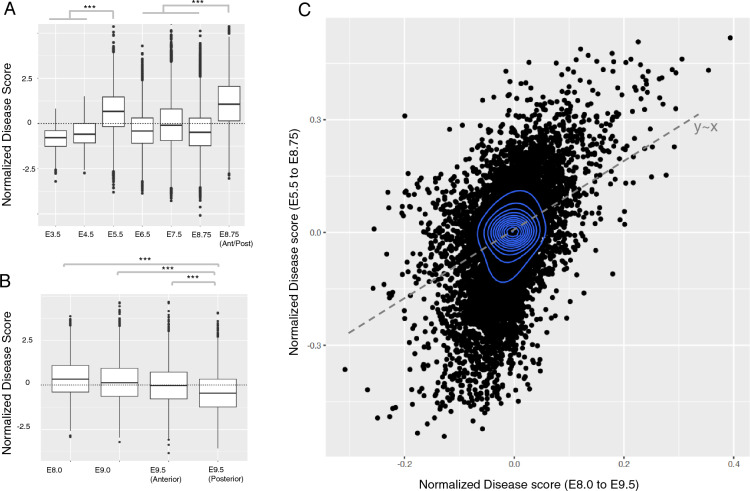
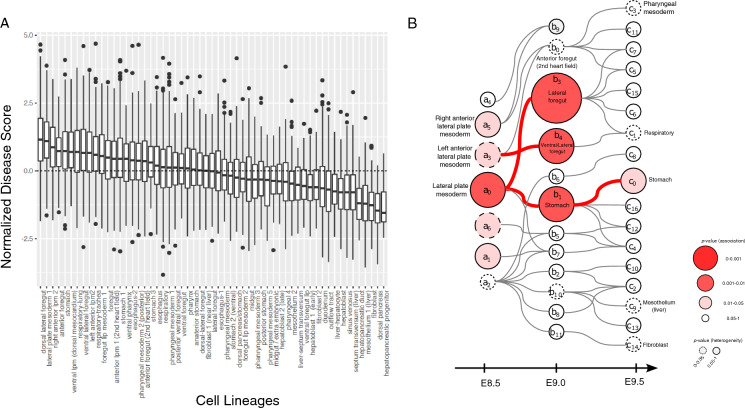
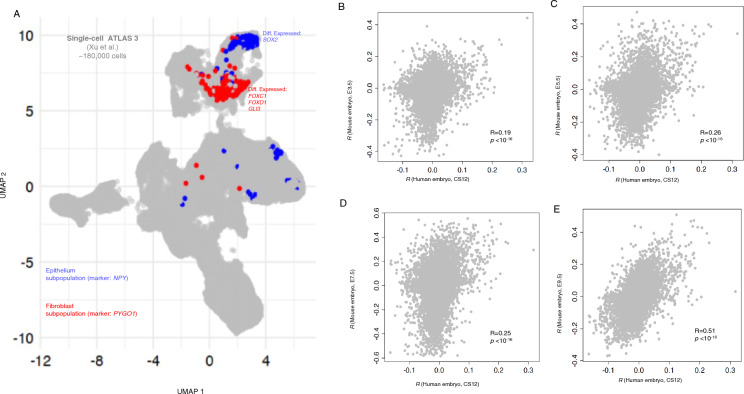
Understanding the molecular mechanisms of congenital diseases is challenging due to their occurrence within specific developmental stages. Esophageal malformations are examples of such conditions, characterized by abnormalities in the development of esophagus during embryogenesis. These developmental malformations encompass a range of anomalies, including esophageal atresia, and tracheoesophageal fistula. Here, we investigated the preferential expression of 29 genes that are implicated in such malformations and their immediate interactome (a total of 67 genes). We conducted our analyses across several single-cell atlases of embryonic development, encompassing approximately 150,000 cells from the mouse foregut, 180,000 cells from human embryos, and 500,000 cells from 24 human organs. Our study, spanning diverse mesodermal and endodermal cell populations and early developmental stages, shows that the genes associated with esophageal malformations show their highest cell-type specific expression in lateral plate mesoderm cells and at the developmental stage of E8.75-E9.0 days. In human embryos, these genes show a significant cell-type specific expression among subpopulations of epithelial cells, fibroblasts and progenitor cells including basal cells. Notably, members of the forkhead-box family of transcription factors, namely FOXF1, FOXC1, and FOXD1, as well as the SRY-box transcription factor, SOX2, demonstrate the most significant preferential expression in both mouse and human embryos. Overall, our findings provide insights into the temporal and cellular contexts contributing to esophageal malformations.


Conflict of interest statement

The authors declare no competing interests.

Figures

Figure 1
Figure 1
Cell Type Enrichment of genes associated with esophageal malformations. (A) the heterogeneity of disease association (− log10(pheterogeneity)) versus the disease association (-log10(passociation)) for different cell types of the mouse gut endoderm. (B) Enrichment of EM- associated genes in different cell types of endodermic and mesodermal origins. The heatmap shows p-values, with colors indicating significance levels. Dark red, red, orange, and white correspond to p-values < 0.001, between 0.001 and 0.01, between 0.01 and 0.05, and non-significant cell types, respectively. In panel (A), VE and DE refers to visceral endoderm and definitive endoderm, respectively. The cell type identities in panel B are listed in Table S3. The p-values in all panels were calculated from the scDRS algorithm using permutation tests.
Figure 2
Figure 2
Temporal preferential expression of genes associated with esophageal malformations. (A) Ranked normalized disease score for all cell types within the developmental time points of E3.5, E4.5, E5.5, E6.5, E7.5, E8.75 (extracted from the descendants of either visceral or definitive endoderm in the gut tube), and E8.75 (taken from anterior/posterior halves). (B) Ranked normalized disease score for all cell types within the time points of E8.0, E9.0, and E9.5 in anterior and posterior regions of the foregut. Comparisons with the p-value < 10–10 from a Wilcoxon’s rank-sum test are denoted by three asterisks. (C) The correlation of gene expression with single-cell disease scores for 20,898 human genes in the developmental stages of E5.5–E8.75 (single-cell atlas of Nowotschin et al.) (y-axis) versus the same correlation in the later stages of E8.0–E9.5 days (Han et al.). The p-values in all panels were calculated from the scDRS algorithm using permutation tests.
Figure 3
Figure 3
Disease scores of mesodermal cell types and cell lineages. (A) Normalized disease scores for distinct cell lineages of mesodermal cell types (Han et al. ). (B) The cell fate tree of mesodermal cell types and their enrichment of EM-associated genes. The size/color of cell types reflect the significance of their association, while their dashed or solid line represent the level of heterogeneity of disease association. Gray edges represent the most likely relationship between different cell types using a single-cell voting approach. Red edges connect two cell types with a significant preferential enrichment of EM-associated genes. The p-values in all panels were calculated from the scDRS algorithm using permutation tests.
Figure 4
Figure 4
Gene prioritization using the single-cell disease scores. (A) The rank of EM-associated genes in their correlation with single-cell disease scores at different developmental stages of the mouse gut endoderm. (B, C) The ranked correlation of the expression of 20,898 human genes with single-cell disease scores in the cells of the mouse gut endoderm (panel B, Nowotschin et al.) at the time point of E8.75, and mouse foregut (Panel C, Han et al.) at the time point of E9.0. The red circles represent EM-associated genes.
Figure 5
Figure 5
The preferential expression of genes associated with esophageal malformations in Human embryos. (A) The UMAP coordinates of 180 K human embryos from CS12 to CS16 from the single-cell atlas of Xu et al. The cells colored in blue, and red belong to the subpopulations of epithelial cells, and fibroblasts which show the most significant preferential expression of EM associated genes among other cell clusters. (BE) The correspondence between gene expression correlation with disease scores in human and mouse embryos for 20,897 human genes. Each gray circle shows the Pearson correlation between the gene expression in single-cells and the disease scores. The y-axis in all panels show the correlation coefficient for human genes in human embryos at the developmental stage of CS12. We compared the correlation coefficients for human genes with the correlation coefficients of mouse genes at the developmental stage of E3.5 (panel B), E5.5 (panel C), E7.5 (panel D), and E9.5 (panel E) from the atlas of Nowotschin et al..

Similar articles

References

    1. Zhang S-J, et al. Machine learning models for genetic risk assessment of infants with non-syndromic orofacial cleft. Genomics Proteomics Bioinform. 2018;16:354–364. doi: 10.1016/j.gpb.2018.07.005. - DOI - PMC - PubMed
    1. Bruneau BG. The developmental genetics of congenital heart disease. Nature. 2008;451:943–948. doi: 10.1038/nature06801. - DOI - PubMed
    1. Kelly CJ, et al. Impaired development of the cerebral cortex in infants with congenital heart disease is correlated to reduced cerebral oxygen delivery. Sci. Rep. 2017;7:15088. doi: 10.1038/s41598-017-14939-z. - DOI - PMC - PubMed
    1. Wu X, Long E, Lin H, Liu Y. Prevalence and epidemiological characteristics of congenital cataract: A systematic review and meta-analysis. Sci. Rep. 2016;6:28564. doi: 10.1038/srep28564. - DOI - PMC - PubMed
    1. Feng Y, et al. Maternal folic acid supplementation and the risk of congenital heart defects in offspring: A meta-analysis of epidemiological observational studies. Sci. Rep. 2015;5:8506. doi: 10.1038/srep08506. - DOI - PMC - PubMed

Substances