. 2024 Feb 14;15(1):1372.
doi: 10.1038/s41467-024-45456-z.

Modeling early pathophysiological phenotypes of diabetic retinopathy in a human inner blood-retinal barrier-on-a-chip

Affiliations

Modeling early pathophysiological phenotypes of diabetic retinopathy in a human inner blood-retinal barrier-on-a-chip

Thomas L Maurissen et al. Nat Commun. .

Abstract

Diabetic retinopathy (DR) is a microvascular disorder characterized by inner blood-retinal barrier (iBRB) breakdown and irreversible vision loss. While the symptoms of DR are known, disease mechanisms including basement membrane thickening, pericyte dropout and capillary damage remain poorly understood and interventions to repair diseased iBRB microvascular networks have not been developed. In addition, current approaches using animal models and in vitro systems lack translatability and predictivity to finding new target pathways. Here, we develop a diabetic iBRB-on-a-chip that produces pathophysiological phenotypes and disease pathways in vitro that are representative of clinical diagnoses. We show that diabetic stimulation of the iBRB-on-a-chip mirrors DR features, including pericyte loss, vascular regression, ghost vessels, and production of pro-inflammatory factors. We also report transcriptomic data from diabetic iBRB microvascular networks that may reveal drug targets, and examine pericyte-endothelial cell stabilizing strategies. In summary, our model recapitulates key features of disease, and may inform future therapies for DR.


Conflict of interest statement

T.L.M., A.J.S., G.S., M.B., J.R.V., S.Y.L., S.F., P.D.W. and H.R. are employees of F. Hoffmann-La Roche Ltd. R.D.K. is a cofounder of AIM Biotech. G.P. declares no competing interests.

Figures

Fig. 1
Fig. 1. Inner blood-retinal barrier model formed of self-assembled microvascular networks.
a Schematic (top) of 3D inner blood-retinal barrier (iBRB) microvascular network (MVN) formation: the MVNs are formed by mixing human retinal microvascular endothelial cells (HRMVECs, 6 × 10⁴ cells), human retinal pericytes (HRPs, 6 × 10⁴ cells) and human retinal astrocytes (HRAs, 6 × 104 cells) in 10 μl of fibrin gel (3 mg ml-1). Created with BioRender.com. Timeline (bottom) of cells in fibrin loaded in the devices and cultured for 4 days in medium supplemented with 50 ng ml-1 VEGF (vessel formation) and 3 days in medium with basal VEGF (vessel maturation) to allow iBRB MVN formation. On D2, the side channels are seeded with HRMVECs (3 × 10⁴ cells per channel). b Representative images of iBRB MVNs: HRPs (PDGFRβ) and HRAs (S100b) co-localized near HRMVEC networks (UEA I). DAPI was used to visualize nuclei. Frames in the merged image indicate enlarged regions used in (c). c Enlarged image regions showing pericyte-EC interactions (top) and astrocyte protrusions in proximity to the abluminal endothelial surface (bottom). The images were taken on D7 and show maximum intensity projections of 124.5 μm Z-stacks. Stainings were repeated in n = 5 independent experiments with similar results. d Cross-section of iBRB MVNs on D7. Image shows orthogonal projections of 124.5 μm Z-stacks. Stainings were repeated in n = 5 independent experiments. e Representative images of endothelial networks (CD31) containing different HRMVEC:HRP:HRA cell number ratios. Images show maximum intensity projections of 290 μm Z-stacks. Experiments were repeated in n = 3 independent experiments. f Quantification of CD31+ vascular area (left), PDGFRβ+ pericyte area (middle) and F-actin+ total area (right). n = 35 HRMVEC 1:0:0, n = 39 1:1:0, n = 36 1:1:1 and n = 40 HUVEC 1:1:1 networks analyzed from n = 3 independent experiments. Data are mean ± s.d. ****P < 0.0001; one-way ANOVA. Source data are provided as a Source Data file. Scale bars, 10 μm (c), 50 μm (b, d) and 100 μm (d).
Fig. 2
Fig. 2. Inner retinal microvasculature indicate mature and functional barrier properties.
a Representative images of tight junction (CLDN5 and ZO-1) and adherens junction (VE-cadherin) proteins co-localizing with endothelial networks (UEA I or CD31). Stainings were repeated in n = 3 independent experiments with similar results. b Basement membrane proteins (LAM and COL IV) co-localizing with endothelial networks (UEA I). Images show maximum intensity projections of 290 μm Z-stacks. Stainings were repeated in n = 3 independent experiments. c Heat map of differential gene expression between D4 and D0 (vessel formation), D7 and D4 (vessel maturation), and the whole iBRB MVN formation process between D7 and D0. Results are from a defined characterization gene panel without cutoff. Data are RNA-Seq aggregated Log2 FC from n = 3 independent experiments. d Permeability assay timeline: iBRB MVNs were formed between D0 and D7, were either kept in standard culture or treated with 1 ng ml-1 TNF-α for 24 h before performing the permeability assay. e Representative image of TNF-α-treated (1 ng ml−1, 24 h) iBRB MVNs perfused on D10 with TRITC-labelled dextran (100 μg ml-1, 70 kDa), acquired by fluorescence confocal microscopy at 5 min intervals. At t = 10 min, the binary mask shows leakage. Perfusion images are maximum intensity projections of 290 μm Z-stacks. f Apparent permeability coefficients were quantified on D10 in untreated (blue) and TNF-α-treated MVNs (red) using 70 kDa TRITC-dextran as a tracer. n = 6 untreated and n = 3 TNF-α-treated networks. Data are mean ± s.d. **P = 0.0029; two-tailed Student’s t-test. Source data are provided as a Source Data file. Scale bars, 100 μm (a, b, e).
Fig. 3
Fig. 3. Modeling diabetic retinopathy with chronic diabetic stimulation.
a Timeline of disease modeling. b Representative images of iBRB MVNs (UEA I) cultured in standard medium on D7 (left), D28 (middle) or in diabetic medium on D28 (right). c Quantification of vascular area for control on D7, D14 (blue circles) and D28 (blue triangles) and diabetic conditions on D14 (red circles) and D28 (red triangles). n = 113 control D7, n = 117 D14, n = 165 D28, n = 117 diabetic D14 and n = 203 D28 networks analyzed from n = 3 independent experiments. d Representative images of pericytes (PDGFRβ) and endothelial networks (UEA I). Frames in the merged images indicate enlarged regions used in (e). e Enlarged image regions showing pericyte-EC interactions. f Quantification of pericyte area. g Quantification of pericyte coverage defined by the pericyte area overlapping the vascular area. n = 49 control D7, n = 42 D14, n = 48 D28, n = 48 diabetic D14 and n = 61 D28 networks analyzed for pericyte area and coverage, from n = 3 independent experiments. ***P = 0.0007. h Representative images of endothelial networks (UEA I) and overlay images with basement membranes (COL IV) revealing the presence of ghost vessels that are COL IV+UEA I− (arrowheads). Frames indicate enlarged regions used in (i). i Enlarged image regions showing increased ghost vessels in diabetic conditions (bottom) on D28. j Quantification of collagen type IV area. **P = 0.0045. k Quantification of the fraction of ghost vessels calculated by the difference of COL IV+ area and vascular area, divided by the COL IV+ area. n = 38 control D7, n = 45 D14, n = 45 D28, n = 40 diabetic D14 and n = 42 D28 networks analyzed from n = 3 independent experiments. Data are mean ± s.d. *P = 0.0270; **P = 0.0094; ****P < 0.0001; one-way ANOVA. Source data are provided as a Source Data file. All images show maximum intensity projections of 395 μm Z-stacks. Scale bars, 20 μm (e, i) and 100 μm (b, d, h).
Fig. 4
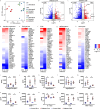
Fig. 4. Transcriptomic analysis reveals pathways affected in diabetic retinopathy.
a Principal component analysis of RNA-Seq data from untreated and osmotic controls and diabetic treatment. Data are from n = 3 independent experiments with each replicate shown. Volcano plots of differentially expressed genes (FC > 2, FDR < 0.01) of diabetic D14 (b) and D28 (c) compared to untreated controls at the same time points, with the number of up- and down-regulated genes indicated (FC > 2). Heat maps of differential gene expression between diabetic treated and untreated conditions corresponding to vascular regression (d), pericyte loss (e), ECM remodeling (f), inflammation (g) and astrocytes (h). Results are from defined gene panels without cutoff. Data are aggregated log2 FC from n = 3 independent experiments. Analyte measurements from untreated (blue) and diabetic treated (red) supernatants collected on D14 (circles) and D28 (triangles), showing concentrations of human collagen IV alpha I (i), MMP-9, **P = 0.0023 (j), Angiopoietin-1, *P = 0.0119 (k), Angiopoietin-2 (l), Tie-2 (m), CXCL1, *P = 0.0288, ***P = 0.0009 (n), ICAM-1, **P = 0.0014, ***P = 0.0009 (o), IL-1β, **P = 0.0011 (p), IL-6 (q) and MCP−1 (r). Supernatants are obtained from n = 5 independent experiments. Data are mean ± s.d. ****P < 0.0001; one-way ANOVA. Source data are provided as a Source Data file.
Fig. 5
Fig. 5. Inhibition of pericyte-endothelial cell interactions leads to pathophysiological vascular changes similar to diabetic stimulation.
a Timeline of treatment administration aimed at inhibiting pericyte-EC stability (top). Schematic of targeted pathways (bottom). Created with BioRender.com. APB5, PDGFRβ inhibitor; Tie2i, TIE2 inhibitor; DAPT, γ-secretase inhibitor; 19,20-dihydroxydocosapentaenoic acid (DHDP); advanced glycation end products (AGE). b Representative images of iBRB MVNs (UEA I, top) and overlay images with pericytes (PDGFRβ, middle) on D14, following 7 days of treatment. Enlarged regions of overlay images showing pericyte-EC interactions (bottom). Quantification of vascular area, **P = 0.0066 (c), pericyte area, *P = 0.0176, ***P = 0.0001 (d), pericyte coverage (e) and fraction of ghost vessels (f) for untreated conditions (blue) and different treatments (red) on D14. n = 29 untreated, n = 34 APB5, n = 35 Tie2i, n = 30 DAPT, n = 27 DHDP and n = 35 AGE treated networks analyzed from n = 3 replicate channels for vascular area. n = 20 untreated, n = 22 APB5, n = 23 Tie2i, n = 19 DAPT, n = 17 DHDP and n = 22 AGE treated networks analyzed from n = 2 replicate channels for pericyte area and coverage. n = 9 untreated, n = 12 APB5, n = 12 Tie2i, n = 11 DAPT, n = 10 DHDP and n = 13 AGE treated networks analyzed from n = 1 channel for ghost vessel fraction. Data are mean ± s.d. ****P < 0.0001; one-way ANOVA. Source data are provided as a Source Data file. g, Enlarged image regions of endothelial surface stainings (UEA I) appearing disrupted with diabetic (middle) and APB5 (right) treatments compared to the untreated control (left). Arrows indicate granular objects detected on the vascular luminal side. h, Appearance of holes in the endothelial surface visible with UEA I (left) and CLDN5 (right) stainings. This qualitative change is specific to APB5 treatment. All images show maximum intensity projections of 395 μm Z-stacks, from n = 2 independent experiments. Scale bars, 20 μm (b bottom, g, h) and 100 μm (b top and middle).

References

    1. Griffith LG, Swartz MA. Capturing complex 3D tissue physiology in vitro. Nat. Rev. Mol. Cell Biol. 2006;7:211–224. doi: 10.1038/nrm1858. - DOI - PubMed
    1. Shamir ER, Ewald AJ. Three-dimensional organotypic culture: experimental models of mammalian biology and disease. Nat. Rev. Mol. Cell Biol. 2014;15:647–664. doi: 10.1038/nrm3873. - DOI - PMC - PubMed
    1. Vunjak-novakovic G, Ronaldson-bouchard K, Radisic M. Organs-on-a-chip models for biological research. Cell. 2021;184:4597–4611. doi: 10.1016/j.cell.2021.08.005. - DOI - PMC - PubMed
    1. Kim S, Lee H, Chung M, Jeon NL. Engineering of functional, perfusable 3D microvascular networks on a chip. Lab Chip. 2013;13:1489–1500. doi: 10.1039/c3lc41320a. - DOI - PubMed
    1. Whisler JA, Chen MB, Kamm RD. Control of perfusable microvascular network morphology using a multiculture microfluidic system. Tissue Eng Part C Methods. 2014;20:543–552. doi: 10.1089/ten.tec.2013.0370. - DOI - PMC - PubMed