. 2024 Feb 14;15(2):140.
doi: 10.1038/s41419-024-06535-7.

Innate and adaptive immune cell interaction drives inflammasome activation and hepatocyte apoptosis in murine liver injury from immune checkpoint inhibitors

Affiliations

Innate and adaptive immune cell interaction drives inflammasome activation and hepatocyte apoptosis in murine liver injury from immune checkpoint inhibitors

Layla Shojaie et al. Cell Death Dis. .

Abstract

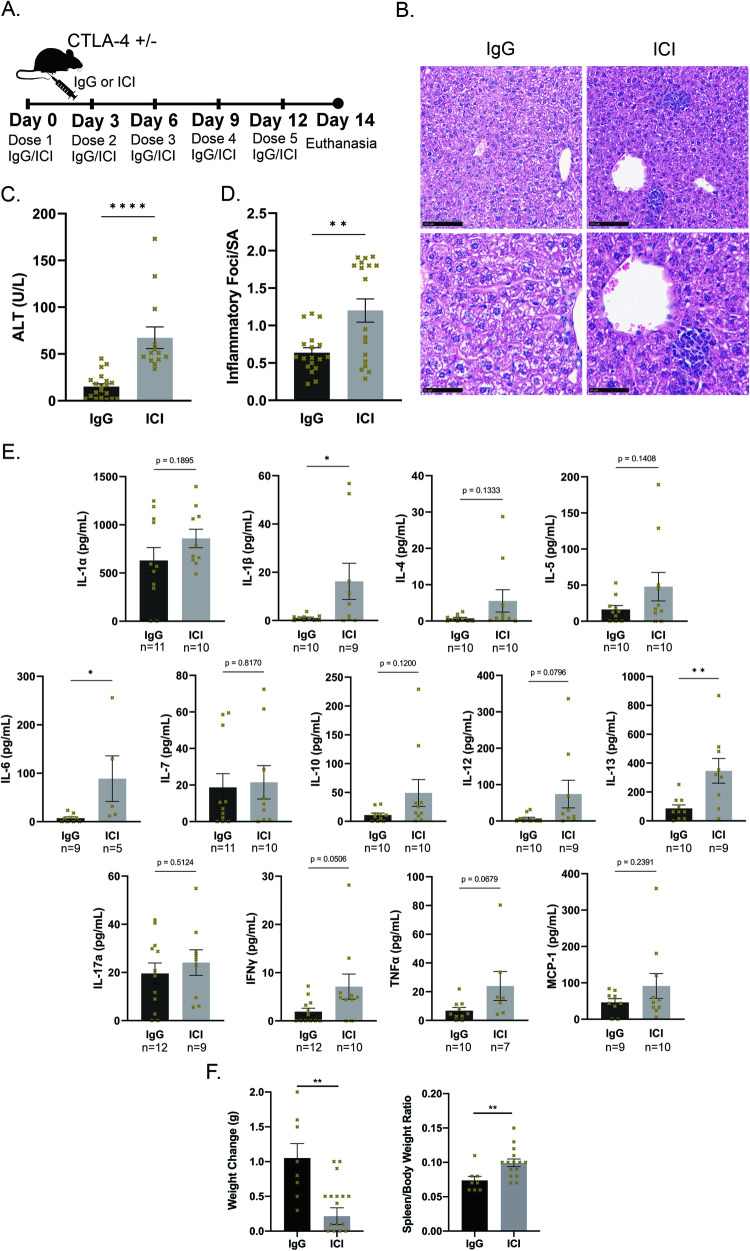
Immune checkpoints (CTLA4 & PD-1) are inhibitory pathways that block aberrant immune activity and maintain self-tolerance. Tumors co-opt these checkpoints to avoid immune destruction. Immune checkpoint inhibitors (ICIs) activate immune cells and restore their tumoricidal potential, making them highly efficacious cancer therapies. However, immunotolerant organs such as the liver depend on these tolerogenic mechanisms, and their disruption with ICI use can trigger the unintended side effect of hepatotoxicity termed immune-mediated liver injury from ICIs (ILICI). Learning how to uncouple ILICI from ICI anti-tumor activity is of paramount clinical importance. We developed a murine model to recapitulate human ILICI using CTLA4+/- mice treated with either combined anti-CTLA4 + anti-PDL1 or IgG1 + IgG2. We tested two forms of antisense oligonucleotides to knockdown caspase-3 in a total liver (parenchymal and non-parenchymal cells) or in a hepatocyte-specific manner. We also employed imaging mass cytometry (IMC), a powerful multiplex modality for immunophenotyping and cell interaction analysis in our model. ICI-treated mice had significant evidence of liver injury. We detected cleaved caspase-3 (cC3), indicating apoptosis was occurring, as well as Nod-like receptor protein 3 (NLRP3) inflammasome activation, but no necroptosis. Total liver knockdown of caspase-3 worsened liver injury, and induced further inflammasome activation, and Gasdermin-D-mediated pyroptosis. Hepatocyte-specific knockdown of caspase-3 reduced liver injury and NLRP3 inflammasome activation. IMC-generated single-cell data for 77,692 cells was used to identify 22 unique phenotypic clusters. Spatial analysis revealed that cC3+ hepatocytes had significantly closer interactions with macrophages, Kupffer cells, and NLRP3hi myeloid cells than other cell types. We also observed zones of three-way interaction between cC3+ hepatocytes, CD8 + T-cells, and macrophages. Our work is the first to identify hepatocyte apoptosis and NLRP3 inflammasome activation as drivers of ILICI. Furthermore, we report that the interplay between adaptive and innate immune cells is critical to hepatocyte apoptosis and ILICI.


Conflict of interest statement

The authors declare no competing interests.

Figures

Fig. 1
Fig. 1. Immune checkpoint inhibitors (ICI) induce liver disease in a murine injury model.
A Murine injury model of immune-mediated liver injury from ICIs (ILICI). 8–12 week-old CTLA4+/- littermates received anti-CTLA4 plus anti-PD-L1 or isotype control (IgG1 and IgG2) via intraperitoneal injection as shown B Representative H&E images Top: 20x, Bottom: 40x C Alanine aminotransferase (ALT) n = 13 for ICI, 20 for IgG. D Quantification of inflammatory foci over surface area in liver sections n = 18/group. E Cytokines. F Quantification of (left) body weight change and (right) spleen/body weight ratio between day 0 and day 14 n = 8 IgG and 16 ICI. Data are mean ± SEM. P-value calculated using unpaired t-test. P-value * (<0.05), ** (<0.01), *** (<0.001), **** (<0.0001).
Fig. 2
Fig. 2. Apoptosis is activated in the livers of ICI-treated mice.
A (left) Representative western blot from whole liver lysates of treated CTLA4+/- mice showing detection of cleaved Caspase-3 in the ICI-treated group, and loading control. Densitometry (right) n = 3 IgG and 4 ICI. B Immunohistochemistry for cleaved Caspase-3. 20x magnification. C Representative immunofluorescence for cleaved Caspase-3 and HNF4-α signals 40x magnification. D Western blot from whole liver lysates of treated CTLA4+/- mice for RIPK1, RIPK3, pMLKL, and GAPDH (RIPK3 KO was used as internal WB control negative to show antibody specificity). Data are mean ± SEM. P-value calculated using unpaired t-test. P-value * (<0.05).
Fig. 3
Fig. 3. Activation of the NLRP3 inflammasome in the livers of ICI-treated mice.
A (left) Representative western blot from whole liver lysates of treated CTLA4+/- mice for indicated proteins and loading control (GAPDH). (right) Densitometry. B Immunofluorescence for NLRP3 and CD45 on CTLA4+/- liver treated with ICI, and overlay (bottom-right, enlarged in cutout). 40x magnification. Data are mean ± SEM n = 6/group. P-values were calculated using an unpaired t-test. P-value ** (<0.01), *** (<0.001), **** (<0.0001).
Fig. 4
Fig. 4. Total liver Caspase-3 knockdown via unconjugated antisense oligonucleotide (ASO) worsens liver injury in ICI-treated mice.
A (left) Representative western blot of whole liver and spleen lysates of CTLA4+/- demonstrating knockdown of Caspase-3. (right) Densitometry n = 3/group. Data are mean ± SEM. P-value calculated using unpaired t-test. B Murine injury model of ILICI modified to include ASO treatment. CTLA4+/- littermates were treated with either CTRL-ASO or C3-ASO for two doses prior to receiving isotype control IgG or ICI treatment alternating with ASO. C ALT. Data are mean ± SEM. n = 8 CTRL IgG and 9 for all other groups. P-values were calculated using a two-way analysis of variance (ANOVA) followed by Sidak’s test for multiple comparisons. D Representative H&E images 20x magnification. E Quantification of inflammatory foci over surface area in liver sections. Data are mean ± SEM. n = 6 IgGs and 9 ICIs. P-values were calculated using two-way ANOVA followed by Sidak’s test for multiple comparisons. F Quantification of (left) body weight change and (right) spleen/ body weight ratio between day 0 and day 21. n = 6 for IgG, 8 CTRL-ASO ICI, 11 C3-ASO ICI. Data are mean ± SEM. P-values were calculated using two-way ANOVA. P-value *(<0.05), **(<0.01).
Fig. 5
Fig. 5. Hepatocyte-specific Caspase-3 knockdown using GalNac-ASO ameliorates liver injury in ICI-treated mice.
A (left) Hepatocytes (HEP) and non-parenchymal cells (NPC) were isolated from livers of CTLA4+/- mice treated with GalNac-control-ASO and GalNac-Caspase-3-ASO, homogenized, and immunoblotting was performed for total Caspase-3 and GAPDH (loading control) to demonstrate hepatocyte-specific knockdown. (right) Densitometry. Data are mean ± SEM. n = 3/group. B Murine injury model of ILICI modified to include GalNac-ASO treatment. CTLA4+/- littermates were treated with either GalNac-CTRL-ASO or GalNac-C3-ASO for two doses prior to receiving isotype control IgG or ICI treatment alternating with GalNac-ASO. C Representative H&E images 20x magnification. D Quantification of inflammatory foci over the surface area in liver sections n = 9 IgG, 14 GN-CTRL + ICI, 12 GN-C3 + ICI. E ALT n = 8/group. F Quantification of (left) body weight change and (right) spleen/body weight ratio between day 0 and day 21. Data are mean ± SEM n = 11 GN-IgGs, 10 GN-CTRL + ICI, 9 GN-C3 + ICI. G (left) Representative western blot of whole liver lysates of treated CTLA4+/- mice for indicated proteins. (right) Densitometry n = 6/group. P-values were calculated using one-way or two-way ANOVA followed by Sidak’s or Tukey’s test for multiple comparisons when appropriate. P-value *(<0.05), **(<0.01), ***(<0.001), ****(<0.0001).
Fig. 6
Fig. 6. Single-cell resolution phenotyping of livers of ICI-treated mice using Imaging Mass Cytometry (IMC).
A (left) Tissue microarray (TMA) with livers of control and ICI-treated CTLA4+/- mice. The corresponding H&E-stained TMA section is shown. (right) H&E-stained section of one region of interest (ROI) from ICI-treated liver. Scale bar = 250 µm. B Pseudocolored spatial rendering of acquired IMC data from ICI-treated liver showing (left) multi-channel signal, (center) single-cell segmentation mask, and (right) single-cell spatial and phenotypic identity. C Single-cell clustering and phenotypic signatures were visualized using pseudocolored uniform manifold approximation and projection (UMAP) using all ROIs. D Scaled mean marker expression heatmap showing marker signatures for all non-parenchymal phenotypic clusters. E Cluster abundance heatmap showing the relative abundance of non-hepatocyte clusters in control (green) and ICI-treated (red) ROIs. F UMAP of the non-parenchymal cell (NPC) clusters only. G Quantification of number of cells/ROI in IgG and ICI-treated livers. Data are mean ± SEM. n = 5 IgG, 12 ICIs ROIs, from 4 IgG mice and 8 ICI mice. P-values were calculated using multiple unpaired t-tests. P-value **(<0.01).
Fig. 7
Fig. 7. Spatial analysis of single-cell IMC data reveals a direct interplay between the adaptive and innate immune cells with apoptotic hepatocytes in ILICI.
A Heatmap depicting pairwise distance rank between NPC clusters, cleaved Caspase-3+ (CC3 + ) hepatocytes included. Scale: 1/black: furthest distance pair, 0/yellow: closest distance pair. B Feature map summating pairwise distance ranks and spatial distribution of NPC clusters and cC3+ hepatocytes. Node size: abundance, edge opacity: pairwise distance rank. Node pseudocoloring as in Fig. 7A. C Pseudocolored single-cell renderings of ICI-treated ROIs depicting spatial interaction zones. Cells colored according to the Red-Green-Blue channel composite based on spatial interaction with cC3+ hepatocytes (red), CD8 + T-cells (green), and macrophages (blue). White/gray coloring denotes the interaction zone consisting of all three cell types. D Plots of mean distances between cells of a given phenotype and neighboring cells of other phenotypes across n = 12 ICI-treated ROIs. Data are mean with range. P-values were calculated using Welch’s ANOVA. P-value *(<0.05), **(<0.01), ***(<0.001).
Fig. 8
Fig. 8. Depletion of CD8 + T-cells in ILICI model protects.
A Murine model of anti-CD8 CTL depletion. B FACS Analysis. C Representative H&E images at 10X and 20X magnification. D Inflammatory Foci/surface area n = 10 IgG2b+ICI and 9 anti-CD8 + ICI from two independent experiments. E ALT n = 10 IgG2b+ICI and 9 anti-CD8 + ICI. F Representative IHC for CD68. P-values were calculated using a t-test. P-value *(<0.05), ***(<0.001).

References

    1. La-Beck NM, Jean GW, Huynh C, Alzghari SK, Lowe DB. Immune checkpoint inhibitors: new insights and current place in cancer therapy. Pharmacotherapy. 2015;35:963–76. doi: 10.1002/phar.1643. - DOI - PubMed
    1. Makarova-Rusher OV, Medina-Echeverz J, Duffy AG, Greten TF. The Yin and Yang of evasion and immune activation in HCC. J Hepatol. 2015;62:1420–9. doi: 10.1016/j.jhep.2015.02.038. - DOI - PubMed
    1. Liu X, Hogg GD, DeNardo DG. Rethinking immune checkpoint blockade: ‘Beyond the T cell. J Immunother Cancer. 2021;9:e001460. doi: 10.1136/jitc-2020-001460. - DOI - PMC - PubMed
    1. Liu Z, Zhu Y, Xie H, Zou Z. Immune-mediated hepatitis induced by immune checkpoint inhibitors: current updates and future perspectives. Front Pharmacol. 2022;13:1077468. doi: 10.3389/fphar.2022.1077468. - DOI - PMC - PubMed
    1. Lee SK, Choi JY, Jung ES, Kwon JH, Jang JW, Bae SH, et al. An immunological perspective on the mechanism of drug induced liver injury: focused on drugs for treatment of hepatocellular carcinoma and liver transplantation. Int J Mol Sci. 2023;24:5002. doi: 10.3390/ijms24055002. - DOI - PMC - PubMed

Publication types