. 2024 Mar;16(3):445-474.
doi: 10.1038/s44321-024-00024-2. Epub 2024 Feb 14.

Targeting the mevalonate or Wnt pathways to overcome CAR T-cell resistance in TP53-mutant AML cells

Affiliations

Targeting the mevalonate or Wnt pathways to overcome CAR T-cell resistance in TP53-mutant AML cells

Jan Mueller et al. EMBO Mol Med. 2024 Mar.

Abstract

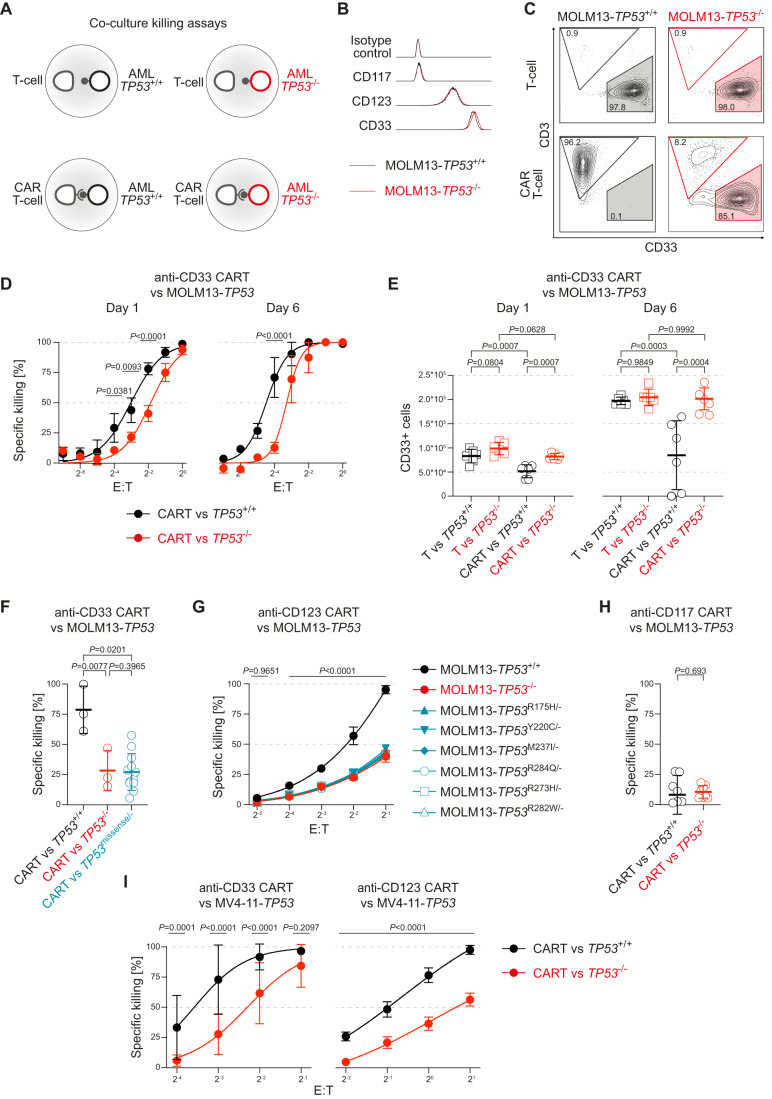
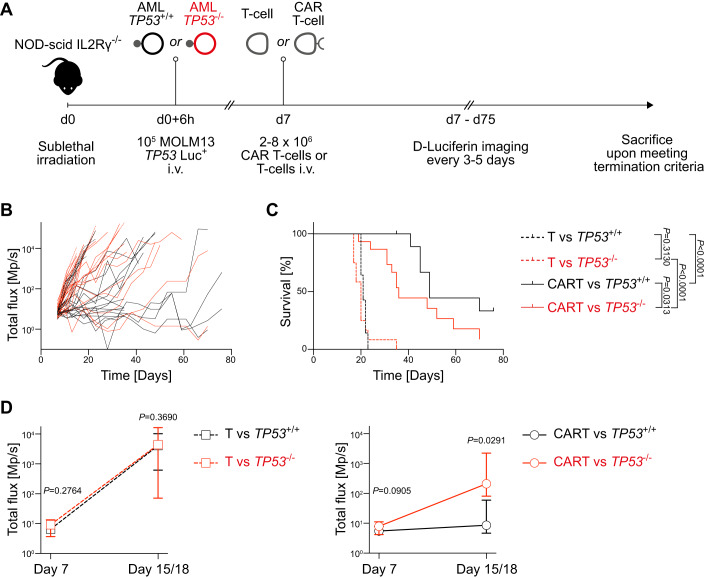
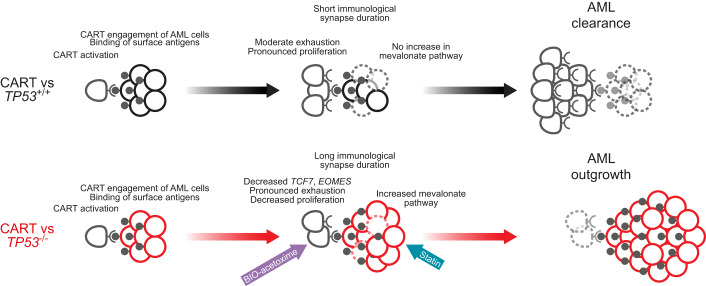
TP53-mutant acute myeloid leukemia (AML) and myelodysplastic neoplasms (MDS) are characterized by chemotherapy resistance and represent an unmet clinical need. Chimeric antigen receptor (CAR) T-cells might be a promising therapeutic option for TP53-mutant AML/MDS. However, the impact of TP53 deficiency in AML cells on the efficacy of CAR T-cells is unknown. We here show that CAR T-cells engaging TP53-deficient leukemia cells exhibit a prolonged interaction time, upregulate exhaustion markers, and are inefficient to control AML cell outgrowth in vitro and in vivo compared to TP53 wild-type cells. Transcriptional profiling revealed that the mevalonate pathway is upregulated in TP53-deficient AML cells under CAR T-cell attack, while CAR T-cells engaging TP53-deficient AML cells downregulate the Wnt pathway. In vitro rational targeting of either of these pathways rescues AML cell sensitivity to CAR T-cell-mediated killing. We thus demonstrate that TP53 deficiency confers resistance to CAR T-cell therapy and identify the mevalonate pathway as a therapeutic vulnerability of TP53-deficient AML cells engaged by CAR T-cells, and the Wnt pathway as a promising CAR T-cell therapy-enhancing approach for TP53-deficient AML/MDS.

Keywords: TP53 Mutations; AML; CAR T-Cell Therapy; Mevalonate Pathway.


Conflict of interest statement

The authors declare no competing interests.

Figures

Figure 1
Figure 1. TP53-mutant AML cells are resistant to CAR T-cell-mediated killing in vitro.
(A) Scheme of in vitro killing assays with untransduced T-cell controls, CAR T-cells, and isogenic MOLM13-TP53 AML cells with different TP53 status. (B) Representative expression of CD117 (negative), CD123 (int), CD33 (high) on isogenic MOLM13-TP53 AML cells relative to isotype control. (C) Representative FACS plots of in vitro killing assays of anti-CD33 CAR T-cells with isogenic MOLM13-TP53 AML cells with wild-type (MOLM13-TP53+/+) or null (MOLM13-TP53−/−) TP53 status. Percentages of parental populations are shown. (D) Specific CAR T-cell-mediated killing of MOLM13-TP53+/+ AML cells (black) or MOLM13-TP53−/− AML cells (red) at the indicated E:T ratios and incubation days. Pooled results from three different healthy T-cell donors are shown (biological replicates per healthy donor, n = 3; two technical replicates for each biological replicate; symbols represent averages of all replicates; error bars indicate SD; two-way ANOVA). (E) Absolute CD33+ cell numbers designating MOLM13-TP53 AML cells (black: TP53+/+, and red: TP53-/-) in co-incubation assays with untransduced T-cells and anti-CD33 CAR T-cells at an E:T of 1:16 on days 1 and 6 (biological replicates, n = 3; two technical replicates for each biological replicate; symbols represent individual replicates; thickened line represents mean and error bars indicate SD; two-way ANOVA). (F) Specific anti-CD33 CAR T-cell-mediated killing of MOLM13-TP53+/+ (black), MOLM13-TP53−/− (red) or MOLM13-TP53missense/− (blue) AML cells on day 6 of co-incubation (biological replicates, n = 2 for MOLM13-TP53+/+, MOLM13-TP53−/−, and for each of the six indicated MOLM13-TP53missense/− conditions; two technical replicates for each biological replicate; symbols represent individual replicates; thickened line represents mean and error bars indicate SD; two-way ANOVA). (G) Specific killing of anti-CD123 CAR T-cells against MOLM13-TP53 AML cells at various E:T ratios (biological replicates, n = 3–4; symbols represent means; error bars indicate SD; two-way ANOVA). (H) Specific CAR T-cell-mediated killing of MOLM13-TP53+/+ AML cells (black) and MOLM13-TP53−/− AML cells (red) with a CAR targeting CD117 (D79), (biological replicates, n = 3; two technical replicates for each biological replicate; symbols represent individual replicates; thickened line represents mean and error bars indicate SD; unpaired Student’s t test). (I) Left panel: Specific killing of anti-CD33 CAR T-cell against MV4-11-TP53 AML cells at various E:T ratios (biological replicates, n = 3; symbols represent means; error bars indicate SD; two-way ANOVA). Right panel: Specific killing of anti-CD123 CAR T-cells against MV4-11-TP53 AML cells at various E:T ratios (biological replicates, n = 3; symbols represent means; error bars indicate SD; two-way ANOVA). Source data are available online for this figure.
Figure 2
Figure 2. CAR T-cells engaging MOLM13-TP53−/− AML cells proliferate less, exhibit sustained activation marker expression, an exhausted immunophenotype, enhanced trogocytosis, and a longer duration of interaction between CAR T-cells and MOLM13-TP53−/− AML cells.
(A) Absolute CD3+ cell numbers for untransduced T-cell controls and anti-CD33 CAR T-cells co-incubated with MOLM13-TP53 AML cells (black: TP53+/+, and red: TP53−/−) at an E:T of 1:16 on days 1 and 6 (biological replicates, n = 4; 2–3 technical replicates for each biological replicate; symbols represent individual replicates; thickened line represents mean and error bars indicate SD; two-way ANOVA). (B) Representative FACS histograms with according percentages of CD25 positive CAR T-cells and T-cell controls co-incubated with isogenic MOLM13-TP53 AML cells with wild-type (MOLM13-TP53+/+, in black) or null (MOLM13-TP53−/−, in red) TP53 status. (C) Quantitative CD25 expression on CAR T-cells and T-cell controls co-incubated for 6 days with isogenic MOLM13-TP53 AML cells with wild-type (MOLM13-TP53+/+, in black) or null (MOLM13-TP53−/−, in red) TP53 status, (biological replicates, n = 3; two technical replicates per biological replicate; symbols represent individual replicates; thickened lines indicate mean and error bars indicate SD; two-way ANOVA). (D) Representative FACS histograms with according percentages of PD-1, LAG3, and TIM3 positive CAR T-cells and T-cell controls co-incubated with isogenic MOLM13-TP53 AML cells with wild-type (MOLM13-TP53+/+, in black) or null (MOLM13-TP53−/−, in red) TP53 status on day 6 of co-incubation. (E) Summary of exhaustion markers of CAR T-cells and T-cell controls co-incubated with isogenic MOLM13-TP53 AML cells with wild-type (MOLM13-TP53+/+) or null (MOLM13-TP53-/-) TP53 status (biological replicates, n = 3; +, single exhaustion marker positive; ++, double exhaustion marker positive; +++, triple exhaustion marker positive; −, negative for exhaustion markers). (F) Representative FACS histograms of CD33 expression on CAR T-cells and T-cell controls co-incubated with isogenic MOLM13-TP53 AML cells with wild-type (MOLM13-TP53+/+, in black) or null (MOLM13-TP53−/−, in red) TP53 status. (G) Quantification of trogocytosis of CAR T-cells and T-cell controls co-incubated with isogenic MOLM13-TP53 AML cells with wild-type (MOLM13-TP53+/+, in black) or null (MOLM13-TP53−/−, in red) TP53 status on day 6 of co-incubation, (biological replicates, n = 4; 2–3 technical replicates per biological replicate; symbols represent individual replicates; thickened lines indicate mean and error bars indicate SD; two-way ANOVA). (H) Representative stills of fluorescence live-cell time-lapse imaging data of anti-CD33 CAR T-cell engaging MOLM13-TP53+/+ AML or MOLM13-TP53−/− AML cells (scale bars, 10 µm). (I) Summary data showing time to propidium iodide influx for CAR T-cells engaging MOLM13-TP53-/- and MOLM13-TP53+/+ AML cells (biological replicates, n = 3; >17 technical replicates per biological replicate; symbols indicate individual replicates; thickened lines indicate mean and error bars indicate SD; unpaired Studentʼs t test). (J) Fraction of killing events as judged by propidium iodide influx after engagement of CAR T-cells to MOLM13-TP53 isogenic cell lines (Fisher’s exact test). Source data are available online for this figure.
Figure 3
Figure 3. MOLM13-TP53−/− AML cells are resistant to CAR T-cells in a therapeutic xenograft in vivo mouse model.
(A) Experimental outline depicting the overall workflow of the xenograft mouse model. (B) Summary of bioluminescence signals longitudinally measured in mice engrafted with luciferase-expressing MOLM13-TP53+/+ or MOLM13-TP53−/− AML cells and treated with anti-CD33 CAR T-cells or untransduced T-cell controls from three pooled independent experiments (n = 53 mice in total and n = 3 healthy donors, T-cells vs. MOLM13-TP53+/+Luc+=12, T-cells vs. MOLM13-TP53−/−Luc+=11, CAR T-cells vs. MOLM13-TP53+/+Luc+=15, CAR T-cells vs. MOLM13-TP53−/−Luc+=15). (C) Kaplan–Meier survival curve of mice engrafted with luciferase-expressing MOLM13-TP53+/+ or MOLM13-TP53-/- AML cells and treated with anti-CD33 CAR T-cells or untransduced T-cell control from three pooled independent experiments. (n = 53 mice in total and n = 3 healthy donors, T-cells vs. MOLM13-TP53+/+Luc+=12, T-cells vs. MOLM13-TP53-/-Luc+=11, CAR T-cells vs. MOLM13-TP53+/+Luc+=15, CAR T-cells vs. MOLM13-TP53−/−Luc+=15; symbols represent mean; error bars indicate SD; Log-rank Mantel–Cox test). (D) Pooled bioluminescence signals on day 7 (before CAR T-cell or untransduced T-cell infusion) and on the last day before termination of any mice (day 15 or 18 for the different biological replicates). Bioluminescence signals of mice injected with T-cell controls are shown on the left and bioluminescence signals of mice injected with CAR T-cells are shown on the right. (n = 53 mice in total and n = 3 healthy donors, T-cells vs. MOLM13-TP53+/+Luc+=12, T-cells vs. MOLM13-TP53−/−Luc+=11, CAR T-cells vs. MOLM13-TP53+/+Luc+=15, CAR T-cells vs. MOLM13-TP53-/-Luc+=15; unpaired Studentʼs t test). Source data are available online for this figure.
Figure 4
Figure 4. Gene expression analysis of CAR T-cells and isogenic MOLM13-TP53 AML cells reveals differentially expressed TP53-dependent genes and pathways.
(A) Overview of the samples obtained for mRNA-seq. (B) Principal component analysis (PCA) of the seven distinct samples with each of the three technical replicates. (C) Volcano plot of differentially expressed genes between MOLM13-TP53+/+(CART) and MOLM13-TP53−/−(CART) (individual data points represent means of n = 3 replicates per sample). (D) Heatmap showing differential expression of genes involved in cholesterol biosynthesis identified in the GSEA (n = 3 replicates per sample). (E) Gene set enrichment analysis (GSEA) of mevalonate pathway genes in MOLM13-TP53-/-(CART) vs MOLM13-TP53+/+(CART), (ES = 0.92, NES = 1.93, nominal P value = <0.000, FDR q-value = <0.000, Kolmogorov–Smirnov test). (F) Volcano plot of differentially expressed genes between CART(MOLM13-TP53+/+) and CART(MOLM13-TP53−/−) (individual data points represent means of n = 3 replicates per sample).
Figure 5
Figure 5. Targeting the mevalonate or the Wnt pathways fully rescues CAR T-cell killing of TP53-deficient AML cells.
(A) Experimental outline showing the various co-incubation settings of CAR T-cells with TP53+/+ or TP53−/− AML cells in the presence of DMSO, simvastatin, simvastatin+mevalonate and BIO-acetoxime. (B) Summary data showing specific anti-CD33 CAR T-cell-mediated killing of MOLM13-TP53+/+ or MOLM13-TP53−/− AML cells over various E:T ratios in the presence of DMSO, simvastatin 1 μM, simvastatin 1 μM + mevalonate 1mM and BIO-acetoxime 0.5 μM, respectively. (biological replicates, n = 3; symbols represent mean; error bars indicate SD; two-way ANOVA). (C) Summary data showing results from (B) at an E:T of 1:8 (biological replicates, n = 3; two technical replicates per biological replicate; symbols represent individual replicates; error bars indicate SD; two-way ANOVA). (D) Summary of exhaustion markers of CAR T-cells and T-cell controls co-incubated with isogenic MOLM13-TP53 AML cells with wild-type (MOLM13-TP53+/+) or null (MOLM13-TP53−/−) TP53 status in the presence of DMSO, simvastatin 1 μM or BIO-acetoxime 0.5 μM (biological replicates, n = 3; +, single exhaustion marker positive; ++, double exhaustion marker positive; +++, triple exhaustion marker positive; −, negative for exhaustion markers). (E) Summary data showing time to propidium iodide influx for CAR T-cells engaging MOLM13-TP53−/− or MOLM13-TP53+/+ AML cells in the presence of simvastatin 1 μM or BIO-acetoxime 0.5 μM (biological replicates, n = 3; symbols indicate individual technical replicates; error bars indicate SD; unpaired Studentʼs t test). Source data are available online for this figure.
Figure 6
Figure 6. Pretreatment with simvastatin but not with BIO-acetoxime rescues CAR T-cell killing of TP53-deficient AML cells.
(A) Graphical representation outlining pretreatment co-incubation assays. (B) LDLR expression on the surface of MOLM13-TP53 cells upon simvastatin 1 μM treatment for 24 h. (biological replicates, n = 3; two technical replicates per biological replicate; symbols indicate individual replicates; thickened line indicates mean and error bars indicate SD; two-way ANOVA). (C) Luminescence signal from T-cells transduced with a Wnt-responsive luciferase gene reporter system and incubated with or without BIO-acetoxime at 0.5 μM for 1, 4, or 6 days. (data shown from one healthy T-cell donor; biological replicates, n = 2; two technical replicates per biological replicate; symbols indicate individual replicates; thickened lines indicate mean and error bars indicate SD; unpaired Student’s t test). (D) Results of pretreatment co-incubation assays with specific anti-CD33 CAR T-cell-mediated killing of MOLM13-TP53+/+ or MOLM13-TP53−/− AML cells at various E:T ratios. (biological replicates, n = 3; two technical replicates per biological replicate; symbols represent means; error bars indicate SD; two-way ANOVA). (E) Summary data highlighting results from (D) at an E:T ratio of 1:8 (biological replicates, n = 2; two technical replicates per biological replicate; symbols represent individual replicates; thickened lines indicate mean and error bars indicate SD; two-way ANOVA). (F) Graphical representation outlining co-incubation assays with CRISPR/Cas9-edited CD33- and CD123-directed CAR T-cells against TP53+/+ or TP53−/− AML cells. nc: unperturbed CAR T-cells; mock: CAR T-cells electroporated with nonsense gRNA and Cas9; RegKO: CAR T-cells gene-edited by CRISPR/Cas9 to induce Regnase-1 deficiency. (G) Results of co-incubation assays showing CRISPR/Cas9-edited CD33- and CD123-directed CAR T-cell-mediated killing (nc, mock and RegKO) against MOLM13-TP53 and MV4-11-TP53 AML cells. (biological replicates, n = 2; two technical replicates per biological replicate; symbols represent means; error bars indicate SD; two-way ANOVA). (H) Summary data highlighting results from (G) of gene-edited anti-CD33 CAR T-cell mediated killing against MOLM13-TP53 at an E:T of 1:32 (biological replicates, n = 2; two technical replicates per biological replicate; symbols represent individual replicates; thickened lines indicate mean and error bars indicate SD; two-way ANOVA). Source data are available online for this figure.
Figure 7
Figure 7. TP53 deficiency in AML leads to resistance against CAR T-cell-mediated killing that can be overcome by targeting the mevalonate and Wnt pathways.
Graphical representation of our proposed model. The intrinsic apoptotic defect in TP53-deficient AML cells leads to a longer duration of cellular interaction between CAR T-cells and TP53-deficient AML cells. Longer temporal interaction between CAR T-cells and TP53-deficient AML eventually leads to reduced CAR T-cell proliferation and enhanced CAR T-cell exhaustion resulting in the outgrowth of TP53-deficient AML cells. Inhibition of cholesterol biosynthesis in TP53-deficient AML cells or activation of the Wnt pathway in CAR T-cells can overcome resistance of TP53-deficient AML cells to CAR T-cell-mediated killing.
Figure EV1
Figure EV1. Details of TP53-associated resistance to in vitro CAR T-cell killing, relates to Figs. 1 and 2.
(A) Vector design for second-generation CAR expression under an EF1 promotor with a CD8α hinge, a 4-1BB costimulatory domain, a CD3ζ activating domain and an RQR8 identification and selection peptide. (B) Lentiviral T-cell transduction and MACS purification yielded a > 95% pure CAR T-cell population for further experiments. (C) In vitro growth kinetics of unperturbed MOLM13-TP53+/+ and MOLM13-TP53-/- leukemia cells. (D) Graphical representation of in vitro competitive co-incubation assay. (E) Representative FACS plots of in vitro killing assays showing ratio of MOLM13-TP53−/−GFP+ over MOLM13-TP53+/+RFP+ upon 10 days of co-incubation with untransduced T-cell controls and or CAR T-cells. Percentages of parental populations are shown. (F) −Log of MOLM13-TP53+/+/MOLM13-TP53−/− ratios normalized to the calculated initial MOLM13-TP53+/+/MOLM13-TP53-/- ratios plotted against time of co-incubation. Pooled results of all different E:T and KO:WT ratios are shown (biological replicates, n = 2; three technical replicates per biological replicate; symbols represent means and error bars indicate SD; two-way ANOVA). (G) Calculated specific killing from in vitro competitive co-incubation assays of anti-CD33 CAR T-cells against a mixture of MOLM13-TP53+/+ and MOLM13-TP53−/− leukemia cells. (H) Absolute CD3+ cell numbers at an E:T ratio of 1:16 for untransduced T-cell controls and anti-CD33 CAR T-cells co-incubated with MOLM13-TP53+/+ (black), MOLM13-TP53-/- (red) or MOLM13-TP53missense/- (blue) AML cells on day 6 (biological replicates, n = 2; two technical replicates per biological replicate; symbols represent individual replicates; thickened lines indicate means and error bars indicate SD; two-way ANOVA). (I) CD33 target antigen density on MOLM13-TP53+/+ and TP53−/− AML cells in co-incubation at an E:T of 1:16 with untransduced T-cell controls and anti-CD33-directed CAR T-cells on days 1 and 6 (biological replicates, n = 4; three technical replicates for each biological replicates; symbols represent individual replicates; thickened lines indicate means and error bars indicate SD; two-way ANOVA). (J) PD-L1 surface expression on MOLM13-TP53+/+ and TP53-/- AML cells in co-incubation with untransduced T-cell controls and anti-CD33-directed CAR T-cells on days 1 and 6 (biological replicates, n = 3; two technical replicates for each biological replicate; symbols represent individual replicates; thickened lines indicate means and error bars indicate SD; two-way ANOVA).
Figure EV2
Figure EV2. Details of therapeutic in vivo xenograft model, relates to Fig. 3.
Pseudo-colored bioluminescence measurements taken at the indicated days showing leukemic burden in the respective groups of treated and control mice. The three biological replicates with different HD untransduced T-cells and CAR T-cells are shown, (n = 53 mice in total and n = 3 biological replicates; T-cells vs. MOLM13-TP53+/+Luc+=12, T-cells vs. MOLM13-TP53-/-Luc+=11, CAR T-cells vs. MOLM13-TP53+/+Luc+=15, CAR T-cells vs. MOLM13-TP53-/-Luc+=15).
Figure EV3
Figure EV3. Details of sorting procedure and gene expression profiling results, relates to Fig. 4.
(A) Gating strategy for flow cytometry sorting as shown by an example (i.e., same data) from panel (B): CD3+ T-cells were sorted as shown, CD3-CD33+ events were further gated on CD33+CD123+ to sort double-positive MOLM13-TP53 AML leukemia cells. The resulting cell populations of >97% purity are shown on the right two panels. (B) FACS plots of n = 3 technical replicates of in vitro co-culture assays subjected to flow cytometry sorting and mRNA extraction. (C) Calculated specific killing from co-incubation assay of MOLM13-TP53+/+ (black) or MOLM13-TP53−/− (red) with anti-CD33 CAR T-cells used for RNA-sequencing (biological replicate, n = 1; three technical replicates; symbols indicate individual technical replicates; thickened line represents mean and error bars indicate SD; unpaired Student’s t test). (D) Fraction of live cells from co-incubation assay used for RNA-sequencing. (biological repliactes, n = 1; 3 technical replicates; symbols represent individual replicates; thickened lines indicate mean and error bars represent SD; unpaired Student’s t test). (E) Total sorted cell numbers for the respective conditions used for mRNA sequencing. (F) Proportion of variance plot. Bars represent the specific proportion of total variance explained by the principal component (PC) and curve represents the cumulative variance explained by PC and all PCs before it. (G) Pathways and gene ontology (GO) terms related to biological processes (BPs) enriched in MOLM13-TP53 under CAR T-cell attack. (H) RT-qPCR measuring expression of HMGCR and HMGCS1 transcripts normalized to ACTB in MOLM13-TP53 and MV4-11-TP53 cells sorted from co-incubation assays with either untransduced T-cells [AML-TP53(resting)] or CD33-/CD123-directed CAR T-cells [AML-TP53(CART)] (biological replicates, n = 2; 2 technical replicates per biological replicate; symbols indicate individual replicates; thickened lines indicate mean and error bars indicate SD; one-way ANOVA). (I) Pathways and gene ontology (GO) terms related to biological processes (BPs) enriched in CAR T-cells co-incubated with MOLM13-TP53. (J) RT-qPCR measuring expression of TCF7 and EOMES transcripts normalized to ACTB in CAR T-cells sorted from co-incubation assays with TP53+/+ [CART(AML-TP53+/+]) or TP53-/- [CART(AML-TP53-/-]) target cells lines MOLM13 and MV4-11 (biological replicates, n = 2; 2 technical replicates per biological replicate; symbols indicate individual replicates; thickened lines indicate mean and error bars indicate SD; unpaired Student’s t test).
Figure EV4
Figure EV4. Details of rescue co-incubation assays, relates to Figs. 5 and 6.
LDLR mean fluorescence intensity and extrapolated EC50 of (A) MOLM13-TP53 and (B) MV4-11-TP53 AML cells incubated with increasing concentrations of simvastatin (biological replicates, n = 2; symbols represent means; error bars indicate SD). (C) Upper panel: Representative FACS histograms of LDLR mean fluorescence intensity of isogenic MOLM13-TP53 AML cells with wild-type (MOLM13-TP53+/+) or null (MOLM13-TP53-/-) TP53 status in the presence of DMSO, simvastatin 1 μM or simvastatin 1 μM + mevalonate 1mM. Lower panel: LDLR mean fluorescence intensity of MOLM13-TP53 cells on days 1, 4 and 6 in the presence or absence of simvastatin 1 μM and/or mevalonate 1mM (biological replicates, n = 3; 2 technical replicates per biological replicate; symbols indicate individual replicates; thickened lines indicate means and error bars indicate SD; two-way ANOVA). (D) Upper panel: Representative FACS histograms of LDLR mean fluorescence intensity of isogenic MV4-11-TP53 AML cells with wild-type (MV4-11-TP53+/+) or null (MV4-11-TP53-/-) TP53 status in the presence of DMSO, simvastatin 15  μM or simvastatin 15 μM + mevalonate 1mM. Lower panel: LDLR mean fluorescence intensity of MV4-11-TP53 cells on days 1, 4 and 6 in the presence or absence of simvastatin 15 μM and/or mevalonate 1mM as well as after washout of simvastatin (biological replicates, n = 3; 2 technical replicates per biological replicate; symbols indicate individual replicates; thickened lines indicate means and error bars indicate SD; two-way ANOVA). (E) Summary data showing results from 3 different co-incubation assays of CAR T-cell-mediated killing of TP53+/+ or TP53-/- AML cells over various E:T ratios in the presence of DMSO, simvastatin (1 μM for MOLM13 and 15 μM for MV4-11), simvastatin + mevalonate 1mM or BIO-acetoxime 0.5 μM, respectively. Co-incubation assays include anti-CD123 CAR vs MOLM13-TP53, anti-CD33 CAR vs MV4-11-TP53 and anti-CD123 CAR vs MV4-11-TP53. (replicates, n = 2–3; symbols represent mean; error bars indicate SD; two-way ANOVA). (F) Absolute CD33+ target cell numbers from various co-incubation assays of untransduced T-cells or CAR T-cells with TP53+/+ or TP53−/− AML cells at an E:T of 1:16 in the presence of DMSO, simvastatin (1 μM for MOLM13 and 15 μM for MV4-11) or BIO-acetoxime 0.5 μM, respectively. Co-incubation assays include anti-CD33 CAR vs MOLM13-TP53, anti-CD123 CAR vs MOLM13-TP53, anti-CD33 CAR vs MV4-11-TP53 and anti-CD123 CAR vs MV4-11-TP53. (biological replicates, n = 2; 2 technical replicates per biological replicate; symbols represent individual replicates; thickened lines indicate means and error bars indicate SD; ns, non-significant; two-way ANOVA). (G) Absolute CD3+ effector cell numbers from various co-incubation assays of untransduced T-cells or CAR T-cells with TP53+/+ or TP53-/- AML cells at an E:T of 1:16 in the presence of DMSO, simvastatin (1 μM for MOLM13 and 15 μM for MV4-11) or BIO-acetoxime 0.5 μM, respectively. Co-incubation assays include anti-CD33 CAR vs MOLM13-TP53, anti-CD123 CAR vs MOLM13-TP53, anti-CD33 CAR vs MV4-11-TP53 and anti-CD123 CAR vs MV4-11-TP53. (biological replicates, n = 2; 2 technical replicates per biological replicate; symbols represent individual replicates; thickened lines indicate means and error bars indicate SD; two-way ANOVA).
Figure EV5
Figure EV5. Details of rescue and pretreatment co-incubation assays as well as Regnase-1-deficient CAR T-cells, relates to Figs. 5 and 6.
(A) Fraction of T-cells negative for all three investigated exhaustion markers (right) and negative for all three markers (left) treated with the indicated compounds (one biological replicate, n = 2 technical replicates; symbols represent means; error bars indicate SD; two-way ANOVA). (B) Representative stills of fluorescence live-cell time-lapse imaging data of anti-CD33 CAR T-cell engaging MOLM13-TP53+/+ AML or MOLM13-TP53-/- AML cells in the presence of simvastatin 1 μM or BIO-acetoxime 0.5 μM (scale bars, 10μm). (C) Luminescence signal of T-cells transduced with a Wnt-responsive luciferase gene reporter system and incubated with or without BIO-acetoxime at 0.5 μM for 1, 4 or 6 days as well as after washout of BIO-acetoxime. (Data shown from a second healthy T-cell donor than in Fig. 6C; biological replicates, n = 2; 2 technical replicates per biological replicate; symbols indicate individual replicates; thickened lines denote means and error bars indicate SD; unpaired Student’s t test). (D) Results from 3 different pretreatment co-incubation assays with anti-CD33 and anti-CD123 CAR T-cells against TP53+/+ or TP53-/- AML (MOLM13 and MV4-11) cells at various E:T ratios. Co-incubations include: anti-CD123 CAR vs MOLM13-TP53, anti-CD33 CAR vs MV4-11-TP53 and anti-CD33 CAR vs MV4-11-TP53. (biological replicates, n = 2–3; 2 technical replicates per biological replicate; symbols represent means; error bars indicate SD; two-way ANOVA). (E) Heatmaps depicting LDLR expression (mean fluorescence intensity) within treatment as well as pretreatment co-incubation assays with anti-CD33 and anti-CD123 CAR T-cells against MOLM13-TP53 and MV4-11-TP53 AML cells at various E:T ratios. (biological replicates, n = 3–4; 2 technical replicates per biological replicate; pseudocolors indicate signal of LDLR expression). (F) Sequencing results graphed as %indels of Regnase-1 CRISPRed anti-CD33 as well as anti-CD123 CAR T-cells from one healthy donor. (G) RT-qPCR measuring expression of TCF7 transcripts normalized to ACTB in nc, mock and RegKO anti-CD33 and anti-CD123 CAR T-cells (biological replicates, n = 2; 2 technical replicates per biological replicate; symbols indicate individual replicates; thickened lines indicate means and error bars indicate SD; paired Student’s t test).

References

    1. Ali SA, Shi V, Maric I, Wang M, Stroncek DF, Rose JJ, Brudno JN, Stetler-Stevenson M, Feldman SA, Hansen BG, et al. T cells expressing an anti-B-cell maturation antigen chimeric antigen receptor cause remissions of multiple myeloma. Blood. 2016;128:1688–1700. - PMC - PubMed
    1. Arai Y, Choi U, Corsino CI, Koontz SM, Tajima M, Sweeney CL, Black MA, Feldman SA, Dinauer MC, Malech HL. Myeloid conditioning with c-kit-targeted CAR-T cells enables donor stem cell engraftment. Mol Ther. 2018;26:1181–1197. - PMC - PubMed
    1. Arber DA, Orazi A, Hasserjian RP, Borowitz MJ, Calvo KR, Kvasnicka HM, Wang SA, Bagg A, Barbui T, Branford S, et al. International consensus classification of myeloid neoplasms and acute leukemias: integrating morphologic, clinical, and genomic data. Blood. 2022;140:1200–1228. - PMC - PubMed
    1. Bansal D, Undela K, D’Cruz S, Schifano F. Statin use and risk of prostate cancer: a meta-analysis of observational studies. PLoS ONE. 2012;7:e46691. - PMC - PubMed
    1. Basu R, Whitlock BM, Husson J, Le Floc’h A, Jin W, Oyler-Yaniv A, Dotiwala F, Giannone G, Hivroz C, Biais N, et al. Cytotoxic T cells use mechanical force to potentiate target cell killing. Cell. 2016;165:100–110. - PMC - PubMed

LinkOut - more resources