. 2024 May;5(5):774-790.
doi: 10.1038/s43018-024-00731-2. Epub 2024 Feb 14.

Efferocytosis reprograms the tumor microenvironment to promote pancreatic cancer liver metastasis

Affiliations

Efferocytosis reprograms the tumor microenvironment to promote pancreatic cancer liver metastasis

Yuliana Astuti et al. Nat Cancer. 2024 May.

Erratum in

Abstract

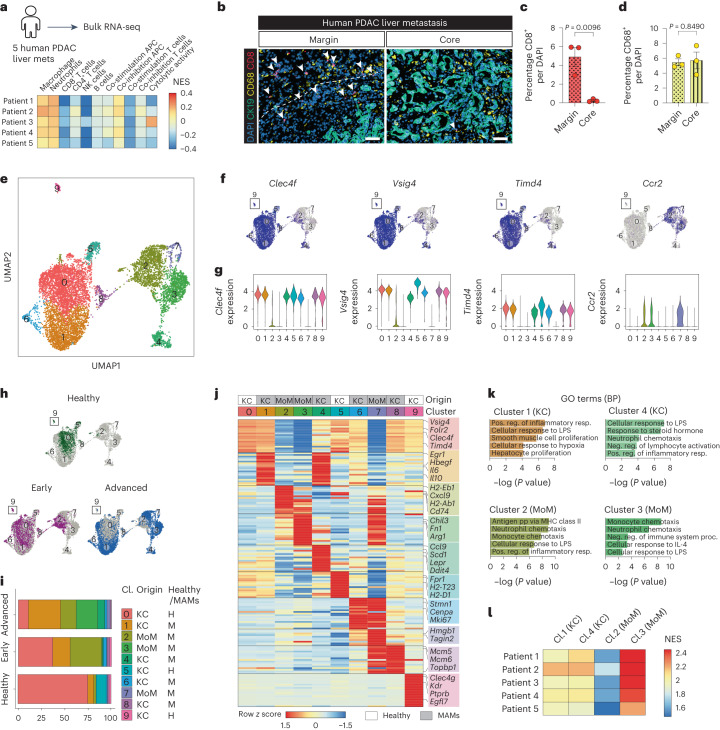
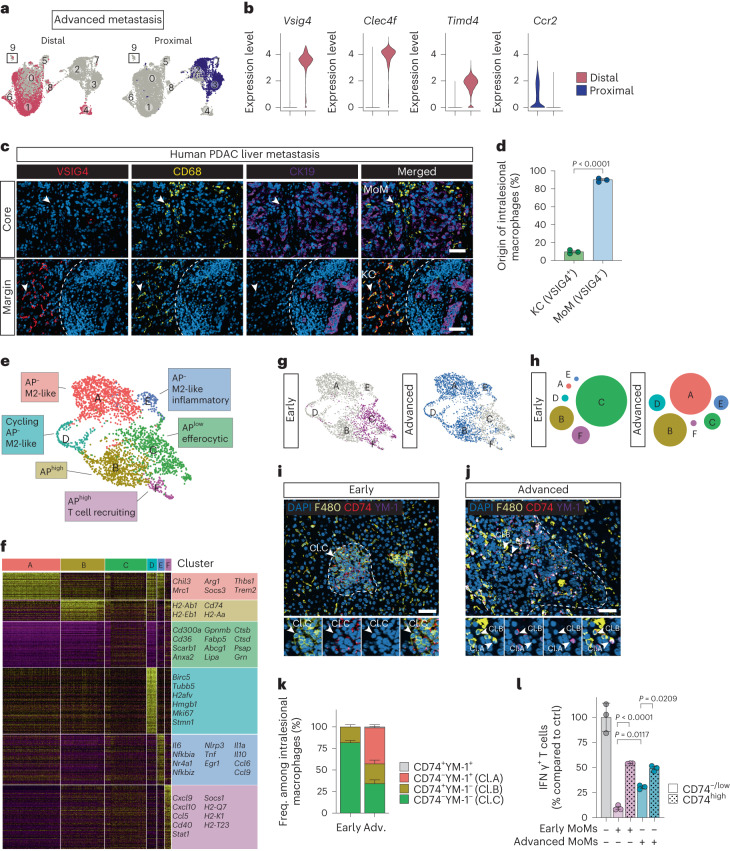
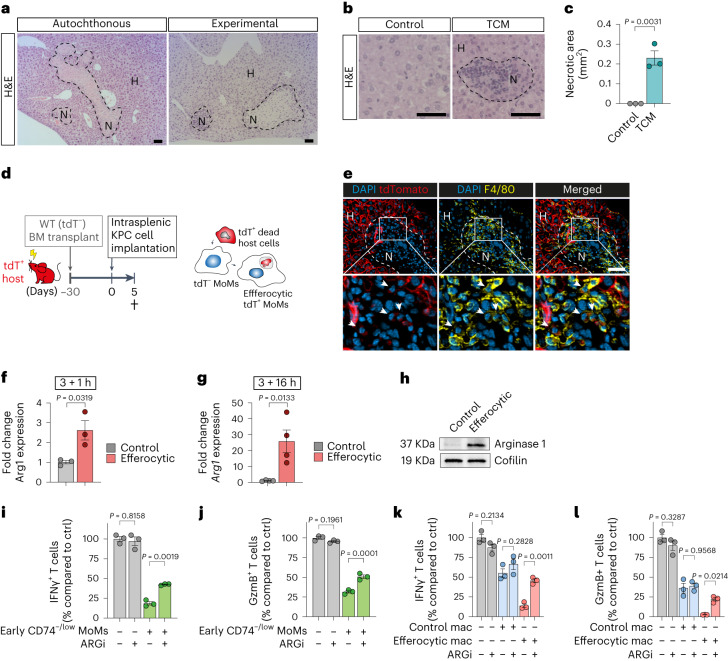
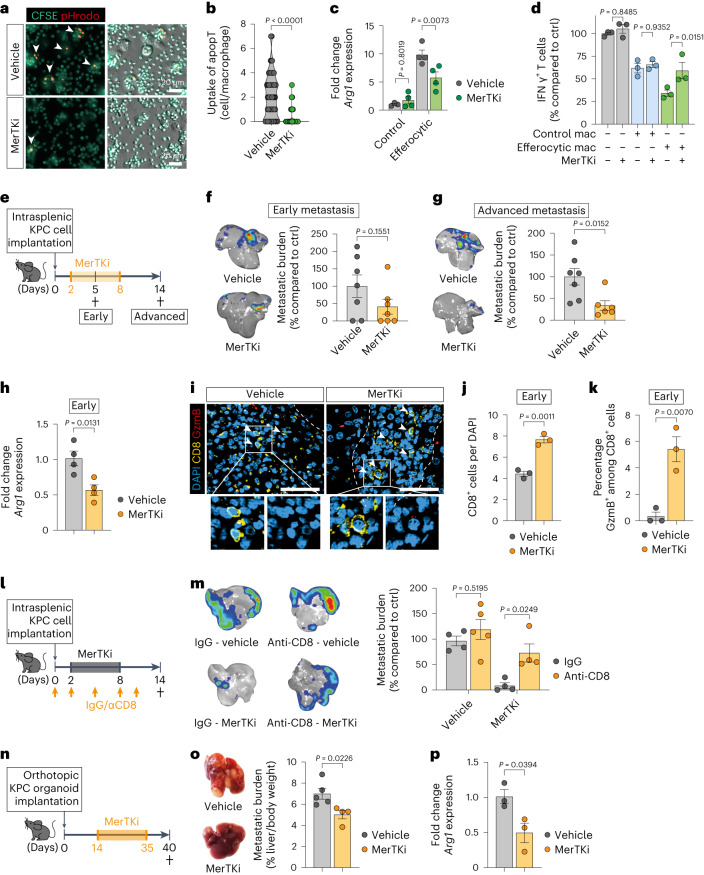
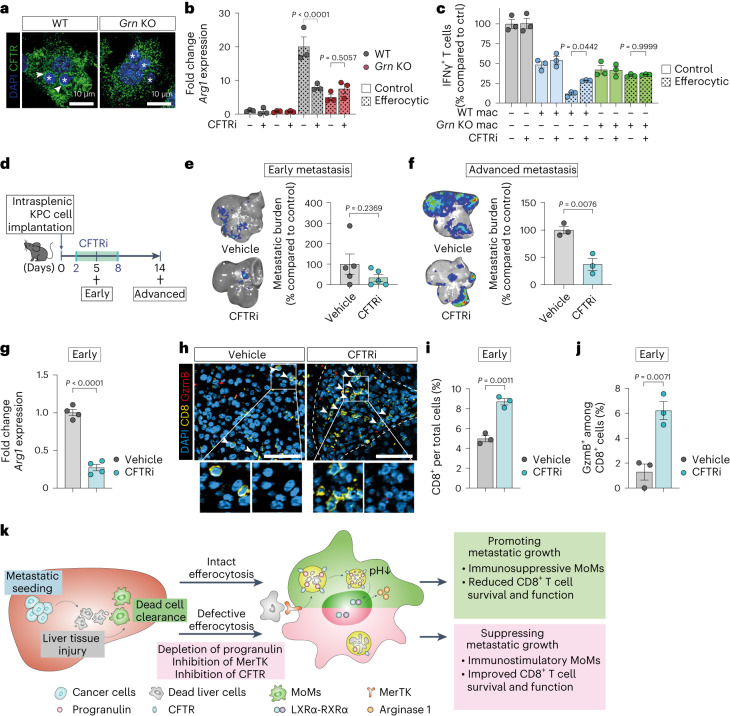
Pancreatic ductal adenocarcinoma is a highly metastatic disease and macrophages support liver metastases. Efferocytosis, or engulfment of apoptotic cells by macrophages, is an essential process in tissue homeostasis and wound healing, but its role in metastasis is less well understood. Here, we found that the colonization of the hepatic metastatic site is accompanied by low-grade tissue injury and that efferocytosis-mediated clearance of parenchymal dead cells promotes macrophage reprogramming and liver metastasis. Mechanistically, progranulin expression in macrophages is necessary for efficient efferocytosis by controlling lysosomal acidification via cystic fibrosis transmembrane conductance regulator and the degradation of lysosomal cargo, resulting in LXRα/RXRα-mediated macrophage conversion and upregulation of arginase 1. Pharmacological blockade of efferocytosis or macrophage-specific genetic depletion of progranulin impairs macrophage conversion, improves CD8+ T cell functions, and reduces liver metastasis. Our findings reveal how hard-wired functions of macrophages in tissue repair contribute to liver metastasis and identify potential targets for prevention of pancreatic ductal adenocarcinoma liver metastasis.


Conflict of interest statement

The authors declare no competing interests.

Figures

Fig. 1
Fig. 1. Identification of MAM populations in metastatic PDAC livers by single-cell RNA sequencing combined with spatial in situ labeling.
a, Schematic of bulk RNA sequencing on fresh liver metastasis biopsies from chemotherapy-naive patients with PDAC (n = 5) (top) and heat map showing scores (normalized enrichment score (NES); single-sample gene set enrichment analysis (ssGSEA)) for immune signatures (bottom). NK, natural killer. bd, Representative immunofluorescence images (b) and quantification of CD8+ T cells (c) and macrophages (CD68+) (d) in the tumor margin and core of human PDAC liver metastasis (n = 3 patients). Cancer cells were indicated by CK19+ staining. Arrowheads indicate CD8+ T cells. Scale bars, 50 µm. Error bars, mean ± s.e.m. P values, two-tailed unpaired t-test. DAPI, 4,6-diamidino-2-phenylindole. e, Uniform Manifold Approximation and Projection (UMAP) plot identifying ten clusters within macrophages (F4/80+) isolated by flow cytometry from healthy liver, early metastatic livers (d5) and advanced metastatic livers (d10) induced by intra-portal implantation of KPC-derived cells into mice with established orthotopic PDAC tumors (n = 3 mice per group). f,g, UMAP plots (f) and violin plots (g) depicting expression of common markers of KCs (Clec4f, Vsig4 and Timd4) and MoMs (Ccr2) in the scRNA-seq dataset. h,i, UMAP plots (h) and bar chart (i) depicting distribution of different macrophage clusters in healthy livers, early metastatic livers (d5) and advanced metastatic livers (d10). j, Heat map depicting relative average expression of the top upregulated differentially expressed genes in each macrophage cluster compared to all other clusters in the scRNA-seq dataset. Representative genes are labeled for each cluster. k, Enriched Gene Ontology (GO) biological processes (BP) in major MAM clusters derived from KCs (cluster 1 and 4) and monocytes (cluster 2 and 3). Statistical enrichment analyses were performed using Fisher’s exact test on g:Profiler. LPS, lipopolysaccharide; pp, processing and presentation; MHC, major histocompatibility complex; IL, interleukin. l, Heat map showing signature scores (NES; ssGSEA) of major KC-MAM and Mo-MAM clusters in human PDAC liver metastasis samples (n = 5 patients). Source data
Fig. 2
Fig. 2. CD74neg/low MoMs display potent immunosuppressive functions at an early metastatic stage.
a, UMAP plots showing distribution of pMAMs and dMAMs in advanced metastatic tumors (d10) based on in situ labeling. b, Violin plots depicting expression levels of KC (Vsig4, Clec4f and Timd4) and MoM (Ccr2) genes in pMAMs and dMAMs. c, Representative immunofluorescent images showing distributions of KCs (CD68+VSIG4+) and MoMs (CD68+VSIG4) in tumor core (top) and margin areas (bottom, dashed line) of liver metastasis derived from patients with PDAC (n = 3 patients). Metastatic cancer cells were indicated by CK19+ staining. Scale bar, 50 µm. d, Quantification of KCs and MoMs among intralesional/core macrophages as shown in c. Error bars, mean ± s.e.m. P value, two-tailed unpaired t-test. e, UMAP plot identifying six clusters of MoMs derived from cluster 2, 3 and 7 in the original UMAP (Fig. 1c). f, Heat map depicting relative expression of upregulated DEGs in each MoM cluster compared to all other MoM clusters in the RNA-seq dataset. Representative genes are labeled for each cluster. g, UMAP plots depicting distribution of MoM clusters in early (d5) and advanced metastatic livers (d10). h, Diagram showing distribution of MoM clusters in early (d5) and advanced metastatic livers (d10). ik, Representative immunofluorescent images of different macrophages (F4/80+) expressing antigen presentation marker CD74 or M2 marker YM-1 in early (i) and advanced (j) liver metastasis derived from experimental intrasplenic model (n = 3 mice per group, from one experiment). Scale bars, 50 µm. Quantification of staining showing percentages of intralesional macrophages resembling major MoM clusters: cluster C-like (Cl.C) (CD74YM-1), cluster B-like (Cl.B) (CD74+YM-1) and cluster A-like (Cl.A) (CD74YM-1+) (k). Error bars, mean ± s.e.m. l, Relative CD8+ T cell activation measured by percentages of interferon (IFN)γ+CD8+ T cells following stimulation with anti-CD3/CD28-coupled Dynabeads and co-culture with FACS-sorted early or advanced MoMs (F4/80+TIM4) from an experimental intrasplenic model compared to a Dynabead-only control (ctrl) (n = 3 biological replicates per group from one experiment). Error bars, mean ± s.e.m. P values, one-way analysis of variance (ANOVA) with Sidak’s post-test. Source data
Fig. 3
Fig. 3. Tissue-resident cell death triggers efferocytosis-mediated immunosuppressive conversion in MoMs.
a, Representative hematoxylin and eosin (H&E) images of hepatic necroses in autochthonous KPC mice with pre-metastatic PDAC (left) and 48 h post-intrasplenic implantation of KPC cells in WT mice (right). Dotted lines demarcate necrotic areas (N, necrotic; H, healthy) (n = 3 mice per group, from one experiment). Scale bars, 50 µm. b,c, Mice were given KPC TCM or control DMEM once daily for 3 d. Livers were collected 24 h after the last injection. Representative H&E images of livers (b) and quantification of hepatic necroses areas (c) in the livers (n = 3 mice per group, from one experiment). Dotted line demarcates the necrotic area. Scale bars, 50 µm. Error bars, mean ± s.e.m. P value, two-tailed unpaired t-test. d, Schematic of chimeric mice generation via transplantation of non-labeled (tdT) donor BM cells into tdT+ hosts (n = 3 mice). e, Representative immunofluorescent images of efferocytic MoMs (arrowheads, tdT+ debris-containing F4/80+tdT cells) in healing necrotic areas (n = 3 mice, from one experiment). Scale bar, 50 µm. f,g, qPCR analysis of Arg1 in BMMs co-cultured for 3 h with apoptotic thymocytes at 1 h (f) or 16 h (g) after washout. BMM, bone marrow-derived macrophages. Error bars, mean ± s.e.m. (n = 3 biological replicates per group). P value, two-tailed unpaired t-test. h, Representative western blot image of arginase 1 and loading control cofilin levels in BMMs (3 + 16 h, experiment was performed three times with similar results). i,j, Relative activation levels of CD8+ T cells, measured as percentages of IFNγ+ (i) or granzyme B (GzmB)+ (j), stimulated with anti-CD3/CD28-coupled Dynabeads and co-cultured with CD74−/low MoMs (F4/80+TIM4) from d5 livers compared to Dynabead-only control (n = 3 biological replicates per group from one experiment). Error bars, mean ± s.e.m. P values, one-way ANOVA with Sidak’s post-test. k,l, Relative activation levels of CD8+ T cells, measured as percentages of IFNγ+ (k) or granzyme B (GzmB)+ cells (l), stimulated with anti-CD3/CD28-coupled Dynabeads and co-cultured with BMMs compared to Dynabead-only control (n = 3 biological replicates per group). Error bars, mean ± s.e.m. P values, one-way ANOVA with Sidak’s post-test. Source data
Fig. 4
Fig. 4. Inhibition of efferocytosis prevents MoM conversion and PDAC metastasis.
a,b, Representative fluorescence image (a) and quantification of engulfed CSFE/pHrodo-labeled apoptotic thymocytes in BMMs (b) (vehicle n = 65 cells; MerTKi n = 112 cells, experiment was performed twice with similar results). CFSE, carboxyfluorescein succinimidyl ester. Error bars, mean ± s.e.m. P value, two-tailed unpaired t-test. c, qPCR analysis of Arg1 in BMMs (20 h). Error bars, mean ± s.e.m. (control/vehicle n = 3, control/MerTKi n = 4, efferocytic/vehicle n = 4, efferocytic/MerTKi n = 4 biological replicates). P values, two-way ANOVA with Sidak’s post-test. d, Relative activation level of CD8+ T cell, measured as percentages of IFNγ+ cells, stimulated with anti-CD3/CD28-coupled Dynabeads and co-cultured BMMs compared to Dynabead-only control (n = 3 biological replicates per group). Error bars, mean ± s.e.m. P values, two-way ANOVA with Sidak’s post-test. e, Schematic illustrating the MerTKi experiment timeline. f,g, Representative bioluminescence imaging (BLI) images (left) and relative tumor burden (right) of d5 (n = 7 mice per group, from one experiment) (f) or d14 livers (g) (control n = 7 mice, MerTKi n = 6 mice, from two experiments). Error bars, mean ± s.e.m. P values, two-tailed unpaired t-test. h, qPCR analysis of Arg1 in MoMs (F4/80+TIM4) from d5 livers (n = 4 mice per group). Error bars, mean ± s.e.m. P value, two-tailed unpaired t-test. ik, Representative immunofluorescence images (i) and quantification of total (j) and cytotoxic GzmB+ (k) CD8+ T cells in d5 livers. Arrowheads indicate CD8+ T cells (n = 3 mice per group, from one experiment). Scale bars, 50 µm. Error bars, mean ± s.e.m. P values, two-tailed unpaired t-test. l, Schematic illustrating the CD8+ T cell depletion experiment timeline. m, Representative ex vivo BLI images (left) and relative tumor burden (right) of d14 livers (vehicle/IgG n = 4 mice, vehicle/anti-CD8 n = 5 mice, MerTKi/IgG n = 4 mice, MerTKi/anti-CD8 n = 4 mice, from one experiment). Error bars, mean ± s.e.m. P values, two-way ANOVA with Sidak’s post-test. n, Schematic diagram illustrating the MerTKi experiment in spontaneous liver metastasis model. o, Representative liver photographs (left) and d40 tumor burden from indicated treatment groups (control n = 5 mice, MerTKi n = 4 mice, from one experiment). Error bars, mean ± s.e.m. P value, two-tailed unpaired t-test. p, qPCR analysis of Arg1 in MoMs (F4/80+TIM4) from d40 livers (n = 3 mice per group). Error bars, mean ± s.e.m. P value, two-tailed unpaired t-test. Source data
Fig. 5
Fig. 5. Depletion of progranulin prevents macrophage conversion and reduces PDAC liver metastasis.
a, Schematic illustrating experiment to track progranulin localization in efferocytic mCherry-PGRN-expressing macrophages. PGRN, progranulin. b, Representative immunofluorescence image of mCherry-PGRN in efferosomes (asterisks) of murine BMMs (n = 33 cells, experiment was performed twice with similar results). Scale bar, 50 µm. c, Representative fluorescence image of mCherry-PGRN in efferosome (arrowhead) of human MoMs over time as assessed by live-cell imaging (experiment was performed twice with similar results). d, qPCR analysis of Arg1 in BMMs (20 h, n = 4 biological replicates per group). Error bars, mean ± s.e.m. P values, two-way ANOVA with Sidak’s post-test. e, Representative western blot image of arginase 1 and loading control cofilin levels in BMMs (3 + 16 h, experiment was performed three times with similar results). f,g, Relative activation of CD8+ T cell, measured by percentages of IFNγ+ (f) or granzyme B (GzmB)+ (g) T cells, stimulated with anti-CD3/CD28-coupled Dynabeads and co-cultured with BMMs compared to Dynabead-only control (n = 3 biological replicates per group from one experiment). Error bars, mean ± s.e.m. P values, one-way ANOVA with Sidak’s post-test. h, Schematic illustrating the Grn KO experiment timeline. i,j, Representative ex vivo BLI images (left) and relative tumor burden (right) of d5 (n = 8 mice per group, from two experiments) (i) and d14 (WT, n = 6 mice; KO, n = 8 mice, from two experiments) (j) livers. Error bars, mean ± s.e.m. P values, two-tailed unpaired t-test. k, qPCR analysis of Arg1 in MoMs (F4/80+TIM4) from d5 livers (n = 4 mice per group). Error bars, mean ± s.e.m. P values, two-tailed unpaired t-test. ln, Representative immunofluorescence images (l) and quantification of total (m) and cytotoxic GzmB+ (n) CD8+ T cells in d5 livers (n = 3 mice per group, from one experiment). Arrowheads indicate CD8+ T cells. Scale bars, 50 µm. Error bars, mean ± s.e.m. P values, two-tailed unpaired t-test. o, Schematic illustrating the Grn KO experiment in a spontaneous liver metastasis model. p, Representative liver photographs (left) and tumor burden (WT, n = 6 mice; KO, n = 4 mice, from one experiment). Error bars, mean ± s.e.m. P values, two-tailed unpaired t-test. q, qPCR analysis of Arg1 in MoMs (F4/80+TIM4) from d5 livers (n = 3 mice per group). Error bars, mean ± s.e.m. P values, two-tailed unpaired t-test. Source data
Fig. 6
Fig. 6. Progranulin deficiency impairs lysosomal acidification and cargo degradation during efferocytosis.
a,b, Representative fluorescence images (a) and quantification (b) of uptake of CellTrace-labeled apoptotic thymocytes (ApopT) in BMMs (WT, n = 223 cells; Grn KO, n = 240 cells; experiment was performed twice with similar results). Error bars, mean ± s.e.m. P value, two-tailed unpaired t-test. Scale bars, 50 µm. AU, arbitrary unit. c, Representative images of efferocytic BMMs (WT, 0/16 h n = 167/200 cells; Grn KO, 0/16 h n = 220/256 cells; experiment was performed twice with similar results) 16 h after washout of CellTrace-labeled apoptotic thymocytes (ApopT). Scale bars, 50 µm. d, Quantification of apoptotic thymocyte cargo degradation in efferocytic BMMs depicted in c. Error bars, mean ± s.e.m. P value, two-tailed unpaired t-test. e,f, Representative fluorescence images (e) and quantification (f) of peak pHrodo intensity in BMMs incubated with CFSE/pHrodo-labeled apoptotic thymocytes (WT, n = 115 cells; Grn KO, n = 164 cells; experiment was performed three times with similar results). Error bars, mean ± s.e.m. P value, two-tailed unpaired t-test. g, qPCR analysis of Arg1 in BMMs (20 h). Error bars, mean ± s.e.m. (n = 4 biological replicates per group). P values, two-way ANOVA with Sidak’s post-test. h, qPCR analysis of LXRα target gene Abca1 in BMMs (20 h). Error bars, mean ± s.e.m. (n = 6 biological replicates per group). P values, two-way ANOVA with Tukey’s post-test. i, Schematic of proximity ligation assay (PLA) for LXRα and RXRα (left) and representative fluorescence images (right) of PLA probe-bound fluorophore (PLA) in BMMs after incubation with CFSE-labeled apoptotic thymocytes (ApopT, green). Asterisks indicate phagocytosed apoptotic cells. j, Quantification of PLA foci (arrowhead) in WT or Grn KO BMMs as depicted in i (control WT, n = 24 cells; control Grn KO, n = 32 cells; efferocytic WT, n = 22 cells; efferocytic Grn KO, n = 22 cells; experiment was repeated three times with similar results). Error bars, mean ± s.e.m. P values, two-way ANOVA with Sidak’s post-test. Source data
Fig. 7
Fig. 7. Inhibition of progranulin-regulated CFTR impairs efferocytosis-induced macrophage polarization.
a, Representative immunofluorescence images of CFTR in efferocytic BMMs (experiment was performed twice with similar results). Asterisks indicate engulfed apoptotic thymocytes. b, qPCR analysis of Arg1 in efferocytic BMMs (20 h). Error bars, mean ± s.e.m. (n = 3 biological replicates/group). P values, two-way ANOVA with Sidak’s post-test. c, Relative activation level of CD8+ T cells, measured as percentages of IFNγ+ cells, stimulated with anti-CD3/CD28-coupled Dynabeads and co-cultured with BMMs compared to Dynabead-only control (n = 3 biological replicates per group from one experiment). Error bars, mean ± s.e.m. P values, one-way ANOVA with Sidak’s post-test. d, Schematic illustrating the CFTRi experiment timeline. e,f, Representative ex vivo BLI images (left) and relative tumor burden (right) of d5 (n = 5 mice per group, from one experiment) (e) and d14 (f) livers (n = 5 mice per group, from two experiments). Error bars, mean ± s.e.m. P values, two-tailed unpaired t-test. g, qPCR analysis of Arg1 in MoMs (F4/80+TIM4) from d5 livers (n = 4 mice per group). Error bars, mean ± s.e.m. P value, two-tailed unpaired t-test. hj, Representative immunofluorescence images (h) and quantification of total (i) and cytotoxic GzmB+ (j) CD8+ T cells in d5 livers (n = 3 mice per group, from one experiment). Arrowheads indicate CD8+ T cell. Scale bars, 50 µm. Error bars, mean ± s.e.m. P value, two-tailed unpaired t-test. k, Graphical schematic summarizing the role of efferocytic macrophages in PDAC liver metastasis. During early stage of metastasis, seeding of cancer cells induces liver injury leading to clearance of dead cell debris by monocyte-derived macrophages (MoMs) via receptor MerTK. Engulfed dead cells are degraded in acidic phagolysosome lumen, a process that is dependent on lysosomal acidification by progranulin (PGRN) and CFTR. Following efficient lysosomal degradation of the dead cell cargo, LXRα is activated and induces expression of the T cell inhibitory factor, arginase 1. Arginase 1-mediated reduction in T cell numbers and activation eventually facilitates metastatic outgrowth. Impairment in these processes and suppression of tumor growth can be achieved via depletion of progranulin or blockade of MerTK or CFTR functions. Source data
Extended Data Fig. 1
Extended Data Fig. 1. Single cell analysis with spatial in-situ labeling identifies heterogeneity in metastasis-associated macrophages.
(a-b) Representative immunofluorescence images (a) and quantification (b) of cytotoxic GzmB+ CD8+ T cells in human PDAC liver metastasis (n = 3 patients). Cancer cells were indicated by CK19+ staining. Scale bars, 50 µm. Error bars, mean ± SEM. P-value, two-tailed unpaired t-test. (c) Schematic of the scRNA sequencing approach combined with a spatial in-situ labeling strategy. MAMs=metastasis associated macrophages. (d,e) Representative immunofluorescence images of healthy livers (d) and advanced stage (d10) (e) of liver metastasis following in situ labeling with FITC-conjugated F4/80 antibody (n = 3 mice/group, from one experiment) via retrograde perfusion, followed by ex vivo staining with pan-macrophage marker CD68. Scale bars, 50 µm. (f) Quantification of double-labeled macrophages (F4/80FITC+/CD68+) in healthy and tumor bearing livers (healthy n = 4 mice, metastasis n = 3 mice) as shown in (d, e). Error bars, mean ± SEM. P-value, two-tailed unpaired t-test. (g) FACS gating strategy for sorting of proximal (pMAMs; F4/80APC+F4/80FITC−) and distal metastasis-associated macrophages (dMAMs; F4/80APC+F4/80FITC+). (h) Heatmap depicting expressions of the most enriched genes in KC vs MoM clusters in the scRNAseq dataset. (i) Proportions of each macrophage cluster identified in the scRNAseq in healthy liver, early metastasis, and advanced metastasis. (j) Expression values of the genes in the cluster 1-4 signatures from scRNAseq analyses versus all genes in the human samples (cluster 1 n = 751 genes; cluster 4 n = 291 genes; cluster 2 n = 255 genes; cluster 3 n = 310 genes). Boxplots indicate the median, first and third quartiles (hinges), and outlier points extend beyond 1.5× interquartile ranges from either hinge (whiskers). Source data
Extended Data Fig. 2
Extended Data Fig. 2. MoMs are proximally located and similar MoM phenotypes are shared in both experimental and spontaneous models of PDAC liver metastasis.
(a) Representative immunofluorescent images of Kupffer cells (KCs; F4/80+VSIG4+) and monocyte-derived macrophages (MoMs; F4/80+VSIG4) in PDAC liver metastasis from autochthonous KPC model (n = 3 mice, from one experiment). Cancer cells were indicated by CK19+ staining. Scale bars, 50 µm. (b) Quantification of KCs and MoMs among intralesional/core macrophages (F4/80+) in autochthonous KPC model as shown in (a). Error bars, mean ± SEM. P-value, two-tailed unpaired t-test. (c) Representative immunofluorescent images of KCs (F4/80+VSIG4+) and MoMs (F4/80+VSIG4) in PDAC liver metastasis from experimental intrasplenic KPC model (n = 3 mice, from one experiment). Cancer cells were indicated by CK19+ staining. Scale bars, 50 µm. (d) Quantification of KCs and MoMs among intralesional/core macrophages (F4/80+) in experimental KPC model as shown in (c). Error bars, mean ± SEM. P-value, two-tailed unpaired t-test. (e) Enriched biological processes (Gene Ontology; GOBP) in MoM clusters identified by g:profiler. (f) Diffusion pseudotime graphs of MoM clusters. (g) Schematic of generations of pre-metastatic and spontaneous advanced metastatic livers from which MoMs were isolated before subjected to single cell RNA sequencing. (h) UMAP plot identifying 7 MoM clusters isolated by flow cytometry from pre-metastatic and advanced metastatic livers induced by orthotopic implantation of KPC-derived cells and organoid, respectively. (i) UMAP plots depicting distribution of MoM clusters in pre-metastatic and spontaneous advanced metastatic livers. (j) Diagrams showing distribution of MoM clusters in pre-metastatic and spontaneous advanced metastatic livers. (k) UMAP plots depicting signature scores of the MoM clusters from experimental liver metastasis models in pre-metastatic and spontaneous advanced metastatic livers. (l) Tumor burden of advanced liver metastasis induced by intraportal (d10) or intrasplenic (d14) injections of KPC-derived cells (n = 10 mice/group). Error bars, mean ± SEM. P-value, two-tailed unpaired t-test. Source data
Extended Data Fig. 3
Extended Data Fig. 3. Efferocytosis induces immunosuppressive activity in macrophages that is mediated by Arginase 1.
(a) Representative H&E image of dead hepatocytes in pre-metastatic liver at d10 post pancreatic implantation of KPC-derived cells (n = 3 mice, from one experiment). Scale bar, 50 µm. (b) Heatmap depicting relative expression of T cell-stimulatory (red) or repressive genes (blue) in MoM clusters. (c) UMAP plots depicting Arg1 expression levels in MoMs isolated from pre-metastatic and spontaneous advanced metastatic livers. (d) Schematic of efferocytosis assay in primary bone marrow-derived macrophages (BMMs). (e) FACS plot (left) and quantification (right) of apoptotic thymocytes post staurosporine treatment (n = 3 biological replicates/group). Error bars, mean ± SEM. (f) qPCR analysis of ARG1 in human primary MoMs (n = 3 biological replicates/group). Error bars, mean ± SEM. P-value, two-tailed unpaired t-test. (g,h) Relative activation levels of CD8+ T cell, measured as percentages of IFNγ+ (g) or GzmB+ (h) cells, stimulated with anti-CD3/CD28-coupled Dynabeads and co-cultured with MoMs from advanced metastatic livers compared to Dynabeads-only control (n = 3 biological replicates/group from one experiment). Error bars, mean ± SEM. P-values, one-way ANOVA with Sidak’s post-test. (i) Percentages of apoptotic (Apotracker+) CD8+ T-cells, following stimulation with anti-CD3/CD28-coupled Dynabeads and co-culture with BMMs (n = 3 biological replicates/group). Error bars, mean ± SEM. P-values, one-way ANOVA with Sidak’s post-test. Source data
Extended Data Fig. 4
Extended Data Fig. 4. Efferocytosis induces immunosuppressive macrophage conversion.
(a) Representative Western blot image of Arginase 1 and loading control Cofilin levels in BMMs (experiment was performed three times with similar results). (b) Relative activation levels of CD8+ T cell, measured as percentages of IFNγ+ cells, stimulated with anti-CD3/CD28-coupled Dynabeads and co-cultured with d5 liver MoMs (F4/80+TIM4) compared to Dynabeads-only control (n = 3 biological replicates/group from one experiment). Error bars, mean ± SEM. P-values, one-way ANOVA with Sidak’s post-test. (c,d) Representative H&E images (c) and quantification (d) of necroses in d5 livers (n = 3 mice/group, from one experiment). Scale bars, 50 µm. Error bars, mean ± SEM. P-value, two-tailed unpaired t-test. (e) Flow cytometry analysis of MerTK+ cells among cancer cells (CD45ZsGreen+) or macrophages (CD45+F4/80+) in d14 livers (n = 6 mice/group). Error bars, mean ± SEM. (f-h) Representative immunofluorescence images (f) and quantification of total (g) and CD74 and/or YM-1-expressing (h) macrophages (F4/80+) in d5 livers (n = 3 mice/group, from one experiment). Scale bars, 50 µm. Error bars, mean ± SEM. P-value, two-tailed unpaired t-test. (i) qPCR analysis of Ifnb in MoMs (F4/80+TIM4) from d5 livers (n = 3 mice/group). Error bars, mean ± SEM. P-value, two-tailed unpaired t-test. (j) Relative activation levels of CD8+ T cells, measured as percentages of IFNγ+ cells, stimulated with anti-CD3/CD28-coupled Dynabeads and co-cultured with d5 liver MoMs (F4/80+TIM4) compared to Dynabeads-only control (n = 3 biological replicates/group from one experiment). Error bars, mean ± SEM. P-values, one-way ANOVA with Sidak’s post-test. (k) Flow cytometry analysis of activated (CD69+) CD8+ T cells in d5 livers (n = 6 mice/group). Error bars, mean ± SEM. P-value, two-tailed unpaired t-test. (l) qPCR analysis of Arg1 in MoMs (F4/80+TIM4) isolated from d14 livers (n = 3 mice/group). Error bars, mean ± SEM. P-value, two-tailed unpaired t-test. (m-o) Representative immunofluorescence images (m) and quantification of total (n) and YM-1+ (o) macrophages (F4/80+) in d14 livers. Arrowheads indicate YM-1+ macrophages (n = 3 mice/group, from one experiment). Scale bars, 50 µm. Error bars, mean ± SEM. P-value, two-tailed unpaired t-test. (p) Organoid-derived primary tumor burden at d40. Error bars, mean ± SEM. P-value, two-tailed unpaired t-test. (q) Flow cytometry analysis of MerTK+ cells among cancer cells (CD45Epcam+) or macrophages (CD45+F4/80+) in d40 livers (n = 6 mice/group). Error bars, mean ± SEM. Source data
Extended Data Fig. 5
Extended Data Fig. 5. Liver injury facilitates liver metastasis and induces immunosuppressive macrophage conversion.
(a) Schematic diagram illustrating the APAP experiment timeline. (b) Representative H&E images of hepatic necroses at 24 hours post vehicle or APAP injection (n = 3 mice/group, from one experiment). Scale bars, 50 µm. (c,d) Representative ex vivo bioluminescence imaging (BLI) images (left) and relative tumor burden (right) of d5 (c) and d14 (d) livers (d5 n = 3 mice/group, from one experiment; d14 control n = 6 mice; APAP n = 5 mice, from two experiments). Error bars, mean ± SEM. P-value, two-tailed unpaired t-test. (e-g) Representative immunofluorescence images (e) and quantification of total (f) and CD74 and/or YM-1-expressing (g) macrophages (F4/80+) in d5 livers (n = 3 mice/group). Scale bars, 50 µm. Error bars, mean ± SEM. P-value, two-tailed unpaired t-test. (h) qPCR analysis of Arg1 in MoMs (F4/80+TIM4) from d5 livers (n = 3 mice/group). Error bars, mean ± SEM. P-value, two-tailed unpaired t-test. (i-k) Representative immunofluorescence images (i) and quantification of total (j) and cytotoxic granzyme B+ (k) CD8+ T-cells in d5 livers (n = 3 mice/group). Arrowheads indicate CD8+ T cells. Scale bars, 50 µm. Error bars, mean ± SEM. P-value, two-tailed unpaired t-test. (l) Flow cytometry analysis of activated (CD69+) CD8+ T cells in d5 livers (n = 3 mice/group). Error bars, mean ± SEM. P-value, two-tailed unpaired t-test. (m) qPCR analysis of Arg1 in MoMs (F4/80+TIM4) from d14 livers (n = 3 mice/group). Error bars, mean ± SEM. P-value, two-tailed unpaired t-test. (n-p) Representative immunofluorescence images (n) and quantification of total (o) and YM-1+ (p) macrophages (F4/80+) (n = 3 mice/group). Arrowheads indicate YM-1+ macrophages. Scale bars, 50 µm. Error bars, mean ± SEM. P-value, two-tailed unpaired t-test. Source data
Extended Data Fig. 6
Extended Data Fig. 6. Progranulin mediates efferocytosis-induced macrophage conversion.
(a) Violin plot depicting expression of Grn in MoM clusters from the scRNAseq dataset. (b) qPCR analysis of GRN in THP-1-derived macrophages (20hrs). Error bars, mean ± SEM (n = 3 independent experiments). P-value, two-tailed unpaired t-test. (c) qPCR analysis of Grn in murine primary BMMs (20hrs). Error bars, mean ± SEM (n = 4 biological replicates/group). P-value, two-tailed unpaired t-test. (d) qPCR analysis of Grn gene copy number in MoMs (F4/80+TIM4) (n = 3 mice/group). Error bars, mean ± SEM. P-value, two-tailed unpaired t-test. (e) qPCR analysis of Arg1 in MoMs (F4/80+TIM4) from d14 livers (n = 3 mice/group). Error bars, mean ± SEM. P-value, two-tailed unpaired t-test. (f-h) Representative immunofluorescence images (f) and quantification of total (g) and YM-1+ (h) macrophages (F4/80+) in d14 livers. Arrowheads indicate YM-1+ macrophages (n = 3 mice/group, from one experiment). Scale bars, 50 µm. Error bars, mean ± SEM. P-value, two-tailed unpaired t-test. (i) Flow cytometry analysis of (CD69+) CD8+ T-cells in d5 livers (n = 3 mice/group). Error bars, mean ± SEM. P-value, two-tailed unpaired t-test. (j) Organoid-derived primary tumor burden at d40. Error bars, mean ± SEM. P-value, two-tailed unpaired t-test. Source data
Extended Data Fig. 7
Extended Data Fig. 7. Progranulin deficiency impairs lysosomal acidification.
(a) Schematic of mCherry-mPGRN constructs (upper) and representative fluorescence images (lower) of transduced, LysoSensor-labeled HEK293T cells (WT n = 58 cells; GRN KO n = 60 cells, experiment was performed twice with similar results). Scale bars, 50 µm. (b) Quantification of LysoSensor intensity as depicted in (a). Error bars, mean ± SEM. P-values, one-way ANOVA with Dunnet’s post-hoc test. (c) qPCR analysis of LXRα-encoding gene Nr1h3 in BMMs (20hrs). Error bars, mean ± SEM (n = 3 biological replicates/group). P-values, two-way ANOVA with Sidak’s post-test. (d) Schematic diagram illustrating the LXRi experiment timeline. (e) Representative ex vivo bioluminescence imaging (BLI) images (left) and relative tumor burden (right) of d14 livers (n = 7 mice/group, from one experiment). Error bars, mean ± SEM. P-value, two-tailed unpaired t-test. (f) Representative Western blot image of IRF3 and loading control Histone H3 levels in nuclear fractions of BMMs following 4hour incubation with apoptotic thymocytes (experiment was performed three times with similar results). (g) qPCR analysis of Ifnb1 in BMMs following 4-hour incubation with apoptotic thymocytes (n = 3 biological replicates/group). Error bars, mean ± SEM. P-value, two-way ANOVA with Sidak’s post-test. Source data
Extended Data Fig. 8
Extended Data Fig. 8. CFTR blockade impairs efferocytosis-induced macrophage conversion.
(a) Schematic of proximity ligation assay (PLA) for mCherry and CFTR (left) and representative fluorescence images (right) of PLA probe-bound fluorophore (PLA, green) in BMMs transduced with mCherry-tagged PGRN (experiment was performed three times with similar results). (b) qPCR analysis of Cftr in BMMs (20hrs). Error bars, mean ± SEM (n = 3 biological replicates/group). P-values, two-way ANOVA with Sidak’s post-test. (c) Representative fluorescence images of LysoSensor-labeled BMMs (n = 38-44 cells/group, experiment was performed twice with similar results) incubated with CellTrace-labeled apoptotic thymocytes (ApopT). (d) Quantification of LysoSensor intensity as depicted in (c). Error bars, mean ± SEM from one experiment. P-value, two-tailed unpaired t-test. (e) Representative Western blot image of Arginase 1 and loading control Cofilin levels in BMMs (3+16hrs, experiment was performed three times with similar results). (f) Relative activation level of CD8 + T cells, measured as percentages of GzmB+ cells, stimulated with anti-CD3/CD28-coupled Dynabeads and co-cultured with BMMs compared to Dynabeads-only control (n = 3 biological replicates/group from one experiment). Error bars, mean ± SEM. P-values, one-way ANOVA with Sidak’s post-test. (g) Flow cytometry analysis of activated (CD69+) CD8 + T-cells in d5 livers (n = 4 mice/group). Error bars, mean ± SEM. P-value, two-tailed unpaired t-test. (h) qPCR analysis of Arg1 in MoMs (F4/80 + TIM4–) from d14 livers (n = 3 mice/group). Error bars, mean ± SEM. P-value, two-tailed unpaired t-test. (i-k) Representative immunofluorescence images (i) and quantification of total (j) and YM-1+ (k) macrophages (F4/80+) in d14 livers. Arrowheads indicate YM-1+ macrophages (n = 3 mice/group, from one experiment). Scale bars, 50 µm. Error bars, mean ± SEM. P-value, two-tailed unpaired t-test. Source data

References

    1. Allemani C, et al. Global surveillance of trends in cancer survival 2000–14 (CONCORD-3): analysis of individual records for 37 513 025 patients diagnosed with one of 18 cancers from 322 population-based registries in 71 countries. Lancet. 2018;391:1023–1075. - PMC - PubMed
    1. Ryan DP, Hong TS, Bardeesy N. Pancreatic adenocarcinoma. N. Engl. J. Med. 2014;371:1039–1049. - PubMed
    1. Vincent A, Herman J, Schulick R, Hruban RH, Goggins M. Pancreatic cancer. Lancet. 2011;378:607–620. - PMC - PubMed
    1. Conroy T, et al. FOLFIRINOX or gemcitabine as adjuvant therapy for pancreatic cancer. N. Engl. J. Med. 2018;379:2395–2406. - PubMed
    1. Doran AC. Efferocytosis in health and disease. Nat. Rev. Immunol. 2020;20:254–267. - PMC - PubMed

Publication types

MeSH terms