

doi: 10.1016/s0079-6123(08)61981-0.
Heterogeneous distribution of hydrogen and bicarbonate ions during complete brain ischemia
- PMID: 3835578
- PMCID: PMC3070383
- DOI: 10.1016/s0079-6123(08)61981-0
Item in Clipboard
Heterogeneous distribution of hydrogen and bicarbonate ions during complete brain ischemia
Prog Brain Res.
1985.
No abstract available
Figures
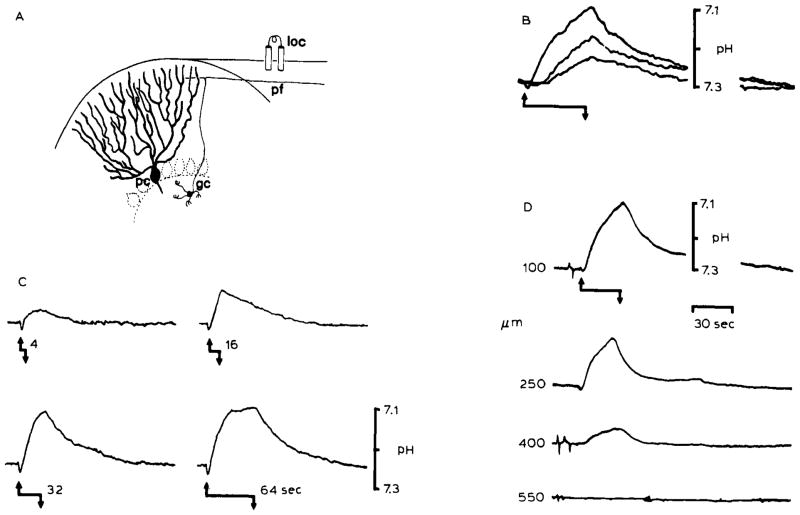
Changes in pHo associated with repetitive surface stimulation in the rat cerebellar cortex. The records show that heterogeneous levels of [H+] can be produced in the brain interstitial space which depend on the magnitude of brain excitation. (A) Local stimulation (loc) of the cerebellar surface excites a beam of parallel fibers (pf), which are axons of granule cells (gc), that in turn induce synaptic depolarization of Purkinje cell dendrites (pc) and interneurons. The cerebellar cortex is a highly ordered and well-defined laminar brain structure. Therefore, synchronous activation of a local population of parallel fibers and Purkinje cell dendrites produces well-defined changes in interstitial electrical potentials which can be used to accurately monitor microelectrode recording positions. Field potential analyses were used to determinepHo recording depth in (B), (C), and (D). (B) Repetitive surface stimulation produced an alkaline then acid going response. Acidification of the interstitial space was proportional to the stimulus train rate. Records showpHo transients 100 μm down in the cerebellar molecular layer in response to 5 Hz (lower record), 10 Hz (middle record), and 20 Hz (upper record) bipolar surface stimulation for 30 seconds. The stimulus began at the upward arrow and stopped at the downward arrow. The effect of increasing the duration of the stimulus train at 20 Hz is shown in (C). pHo records again show an initial alkaline shift with initiation of the stimulus train (upward arrow). The subsequent acid shift increased in magnitude with the stimulus duration (4, 16, 32, and 64 seconds) untilpHo began to reach a steady-state after 64 seconds. (D) Acidification of the interstitial space was also directly proportional to the density of activated neural tissue. pHo changes diminished in depth away from the beam of parallel fibers activated for 30 seconds at 20 Hz beginning at the upward arrow and stopping at the downward arrow. The H+ selective microelectrode was advanced in increments of 150 μm vertically through a folium before each stimulus train (B), (C), and (D) are modified from Kraig et al., 1983.
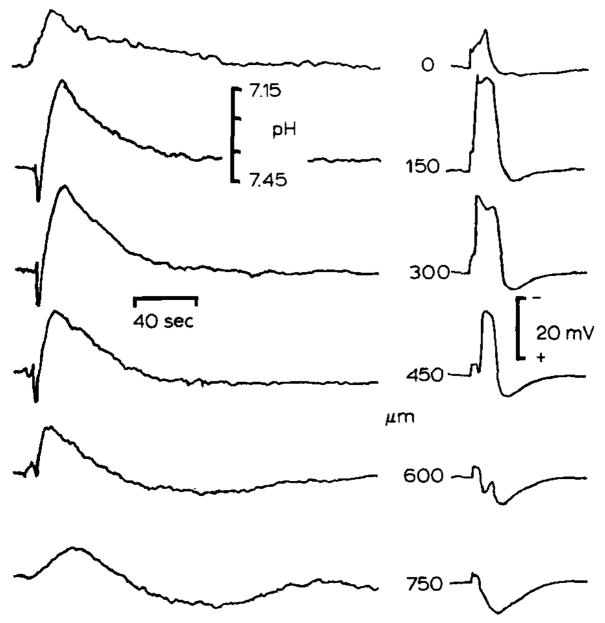
Heterogeneous changes in pHo associated with spreading depression. Spreading depression is a pathological response of synaptically dense brain regions which consist of a cessation of spontaneous and evoked electrical activity, depolarization of brain cells, interstitial large negative d.c. signal, and massive deterioration of trans-membrane ion gradients which propagates through susceptible brain regions (see Nicholson and Kraig, 1981). pHo and slow d.c. potentials are shown from double barrelled H+ selective microelectrodes. Spreading depression was evoked by 100 Hz surface stimulation for 1–5 seconds in cerebellum conditioned by exposure to proprionate Ringer solution (see Nicholson and Kraig, 1981). pHo shifted alkaline then acid during spreading depression and reached a higher peak acid level than during repetitive surface stimulation because of more intense metabolic stimulation during spreading depression, d.c. potential records show that spreading depression was localized to 150–300 μm below the pial surface. Maximum pHo changes occurred at this depth. Spreading depression did not propagate to 600 μm since the slow d.c. potential was positive there. Note that pHo changes at 600 and 750 μm swing acid first and then alkaline in a damped oscillation which may suggest that pHo changes at these depths occurred by diffusion from more superficially activated areas. (Results modified from Nicholson et al., 1985.)
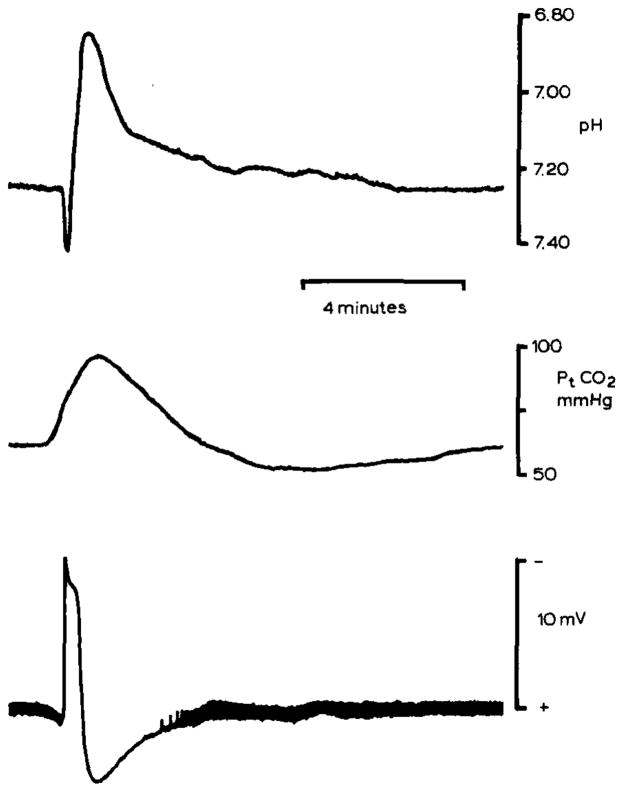
pHo and Pt(CO2) changes during spreading depression in rat neocortex. pHo (upper record) was recorded 500–600 μm below the pial surface in parietal neocortex with a double-barrelled H+ selective microelectrode. pHo shifted initially alkaline and then acid as in the cerebellum. However, the peak acid shift reached 6.90 pH which may reflect enhanced lactic acidosis since blood glucose had been elevated to 17 mmol/l by previous intraperitoneal injection of dextrose. Spreading depression occurred spontaneously. Middle record shows simultaneous recording of Pt(CO2) from a surface carbon dioxide microelectrode. Since the time constant of the carbon dioxide microelectrode is greater than about 30 seconds, peak Pt(CO2) may be artifactually low. Nonetheless, these Pt(CO2) changes show that brain activity can crease local inhomogeneities in tissue CO2 tension as well as [H+]o. Lower record shows the slow d.c. potential negative shift associated with spreading depression. Note that the thickness of the baseline reflects spontaneous electrical activity of the cortex which stops during spreading depression and then progressively returns. These data were recorded during experiments described in Kraig et al., 1984b, .
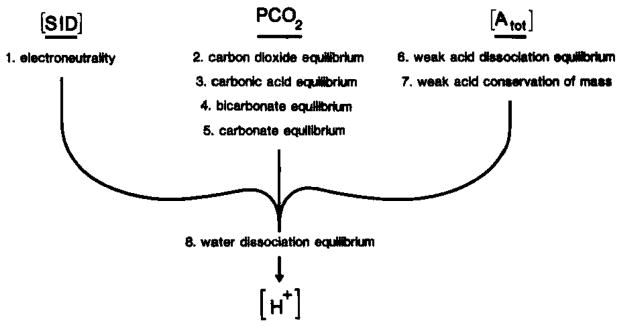
Determinants of [H+] in brain compartments. The putative pathogenesis of excessive acidosis during brain ischemia may be more readily defined if the [H+] and how it is established can be understood in important brain compartments such as the interstitial space or glia and neuronal intracellular space. In biological fluids [H+] is completely determined by the strong ion difference ([SID]), PCO2, and total weak acid concentration ([Atot]) (Stewart, 1981, 1983). It is important to recognize that [SID], PCO2, and [Atot] are three independent variables that completely define [H+] and other dependent variables, [OH−], [
], [A−], [HA], and [
]. In brain trans-membrane ion fluxes influence [H+] in a brain compartment through changes in [SID] while physicochemical H+ buffers which are thought to remain confined to viable cells influence [H+] through changes in [Atot]. To accurately describe [H+] in a given compartment, equations 1 through 8 must be solved simultaneously.
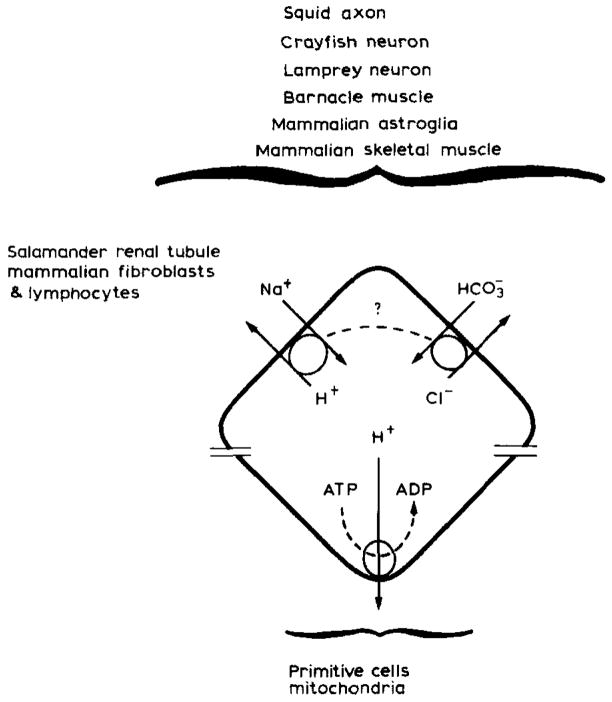
[H+] homeostasis in animal cells. Primitive cells may have used a proton gradient as a power source to energize vital cell activities. Today bacteria and mitochondria continue to so use proton gradients while eukaryotic cells have evolved to substitute the plasma membrane Na+ gradient for similar cell requirements (Wilson and Maloney, 1976). In so doing eukaryotic cells gained improved [H+] homeostasis which is likely to be more important to these latter cells because of their more numerous and complex enzyme systems and subcellular organelles. Today we know that excess intracellular H+ are ultimately removed from a number of different animal cell types through two ion antiport systems, Na+/H+ and
. The plasma membrane Na+ gradient drives Na+H+ antiport while the power source for
antiport remains unclear. In squid
antiport requires ATP. In barnacle muscle, squid axon, and snail or crayfish neurons
antiport may be driven by the Na+ gradient through a variable coupling ratio (dotted line) (adapted from Thomas, 1984). For simplicity though one can regard plasma membrane H+ regulation as some combination of Na+/H+ and
antiport.
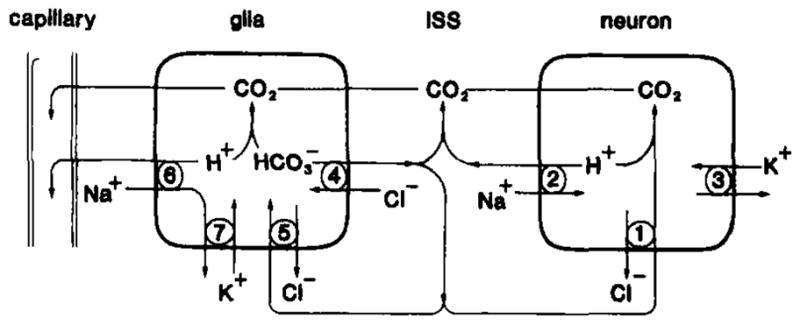
Model of plasma membrane antiport systems for brain H+ homeostasis under normal conditions. Excess neuronal H+ could be neutralized to CO2 by intracellular
or
that entered through
antiport (1). Otherwise, excess neuronal H+ could be removed to the interstitial space (ISS) by Na+/H+ antiport (2) powered by the transmembrane Na+ gradient created by Na+/K+ ATPase (3). Astroglia could manage excess H+ similarly (adapted from Kimelberg et al., 1982). Na+/H+ antiport (6) would preferentially occur at the capillary-glia border so as to create a directional flux of H + toward blood while
antiport would be directed as needed to provide
to the ISS (4) and neurons (1) or buffer excess intraglial H+ (5). Na+/K+ ATPase would maintain the glial Na+ gradient (modified from Kraig et al., 1985a).
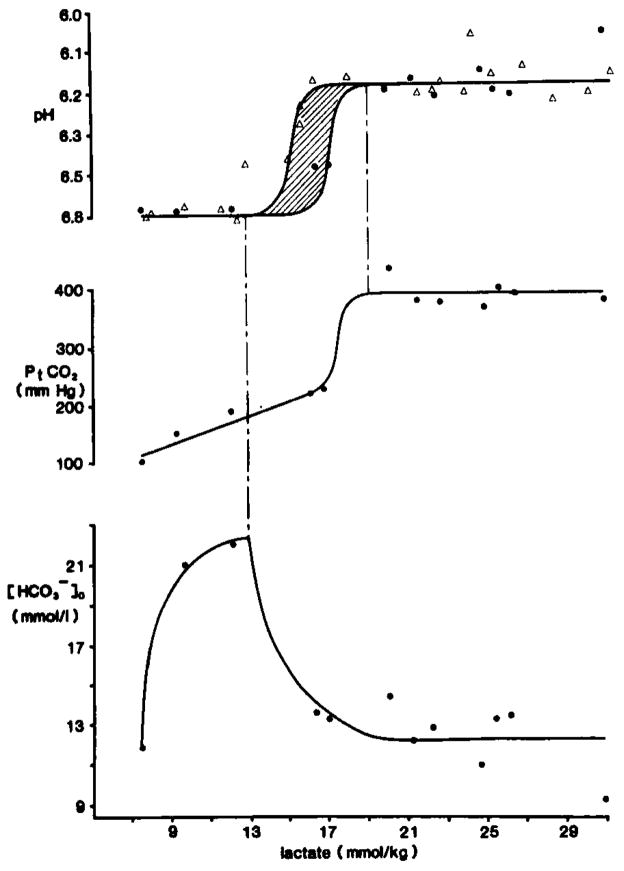
Carbonic acid buffer peak changes after complete ischemia. pHo recordings were made with double barrelled H+ selective microelectrodes placed 800 μm down in parietal cortex of anesthetized rats. Pt(CO2) was measured with a surface microelectrode. Brain carbohydrate stores were modulated by pretreatment with intraperitoneal dextrose or intravenous insulin injections. Ischemia was induced by cardiac arrest caused by intravenous injection of KCl. When changes in pHo and Pt(CO2)reached a peak, animals were decapitated and their heads frozen in liquid nitrogen for subsequent enzyme fluorometric analysis of neocortical lactate content. Upper graph shows peak pHo compared to tissue lactate. Triangles show data from Kraig et al., 1985a and dots represent data from Kraig et al., 1984b, . The zone between 15–17 mmol/kg lactate is shaded with diagonal lines to reflect the variability in peak pHo there. The constant peak level of pHo between 8–13 and 16–31 mmol/kg lactate implies that [H+]o is at a steady-state, but not equilibrium, with respect to [H+] in other brain compartments during complete ischemia. The middle graphs shows concomitant changes in Pt(CO2). Pt(CO2) initially rises linearly with increasing lactate up to about 17 mmol/kg. Then Pt(CO2) rises abruptly and remains constant at 389 ± 9 mmHg after 19 mmol/kg lactate. The constancy of peak Pt(CO2) above 19 mmol/kg lactate implies that
stores were exhausted from acid producing cells. If [H+]o continues to be determined by [SID] and Pt(CO2) (see equation 1) during complete ischemia, then the lower graph shows the concomitant changes in
which would be expected from the measured changes in pHo and Pt(CO2). Notice that
rises from 8–13 mmol/kg lactate, when pHo is constant at 6.81 pH and then begins to fall when pHo and Pt(CO2) change abruptly between 13–19 mmol/kg lactate.
then remains constant at about 12.3 mmol/l above 19 mmol/kg lactate. Thus
and H+ both remain heterogeneously distributed between the interstitial space and acid producing cells during complete ischemia.
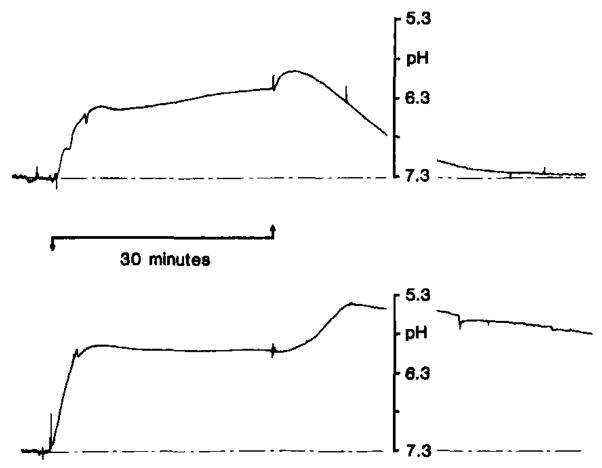
pHo changes with severe forebrain ischemia under hyperglycemic conditions. pHo was recorded as described in Fig. 7. Ischemia was induced by occlusion of four cervical arteries as outlined in Pulsinelli and duffy (1983). Rats were pre-treated with intravenous dextrose to raise brain carbohydrate stores. Pre-ischemic blood glucose was 17 mmol/l (upper record) and 57 mmol/l (lower record) from two representative animals. pHo rose as soon as carotid arteries were reversibly closed (upward arrow) and reached a peak between 6.1–6.2 pH under both conditions. With the release of the carotid artery clamps and reperfusion though, pHo reached a secondary peak acid level which was directly proportional with pre-ischemic the pre-ischemic blood glucose level. When pre-ischemic blood glucose was as high as 57 mmol/l, pHo fell as low as 5.4–5.5 pH during reperfusion. Astroglia swell and brain becomes edematous after reperfusion from severe incomplete ischemia under hyperglycemic conditions. Plasma membranes in general may increase their permeabilities to H+ or their determinants under such conditions. If so, pHo may accurately reflect brain H+ content and suggest that maximum deterioration of brain H+ buffering mechanisms occurs at this time after severe hyperglycemic ischemia (data from Kraig et al., 1985b).
References
-
- Alberti KGMM, Cuthbert C. The hydrogen ion in normal metabolism: a review. In: Porter R, Lawrenson G, editors. Metabolic Acidosis; Ciba Foundation Symposium; Pitman, London. 1982. pp. 1–15. - PubMed
-
- Astrup J, Symon L, Branston NM, Lassen NA. Cortical evoked potential and extracellular K+ and H+ at critical levels of brain ischemia. Stroke. 1977;8:51–57. - PubMed
-
- Boron WF, DeWeer P. Active proton transport stimulated by , blocked by cyanide. Nature (Lond) 1976;259:240–241. - PubMed
-
- Bull HB. An Introduction to Physical Biochemistry. Davis; Philadelphia: 1964.
-
- Bureš J, Bureesšva O, Krivánek J. The Mechanism and Application of Leao’s Spreading Depression of Electroen-cephalographic Activity. Academic Press; New York: 1974.
Publication types
MeSH terms
Substances
Grants and funding
LinkOut - more resources
Full Text Sources
