. 2024 Feb;626(8000):827-835.
doi: 10.1038/s41586-023-06968-8. Epub 2024 Feb 14.

Smoking changes adaptive immunity with persistent effects

Collaborators, Affiliations

Smoking changes adaptive immunity with persistent effects

Violaine Saint-André et al. Nature. 2024 Feb.

Abstract

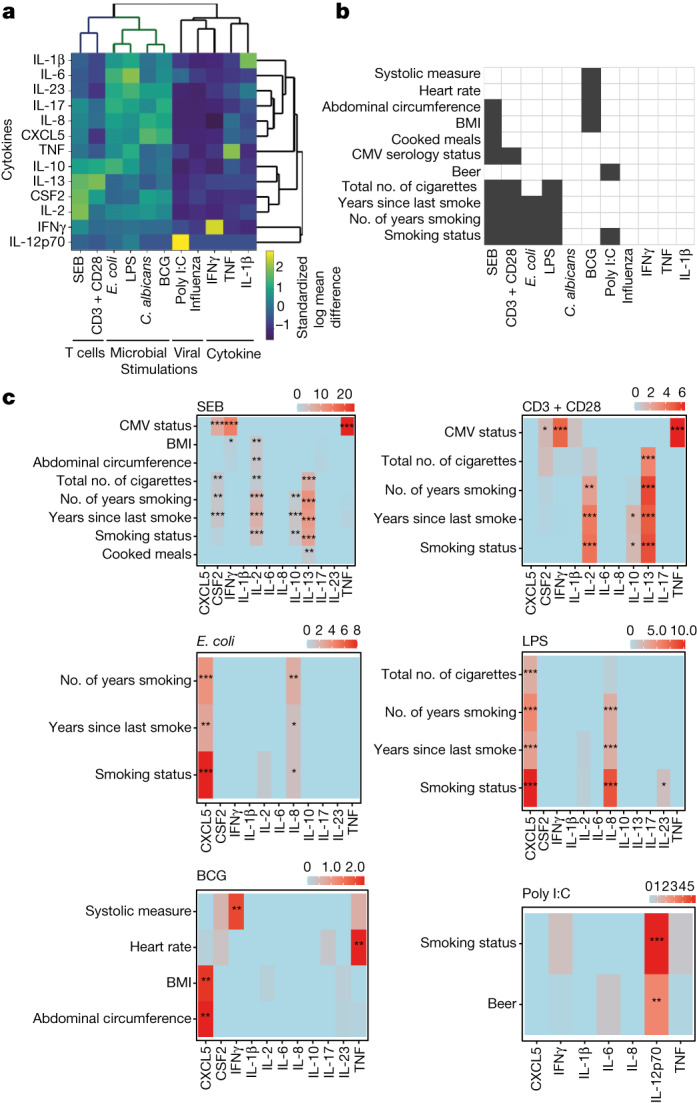
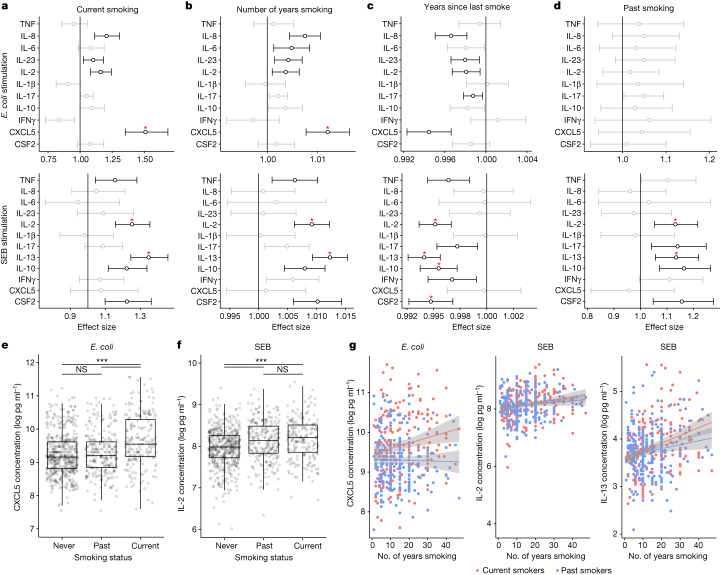
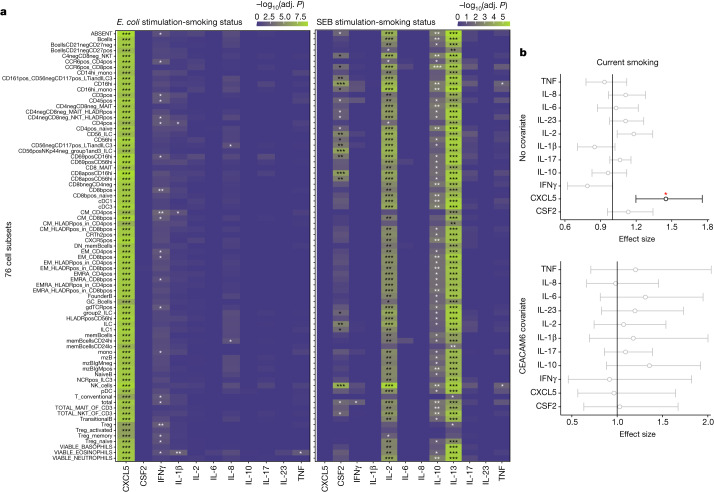
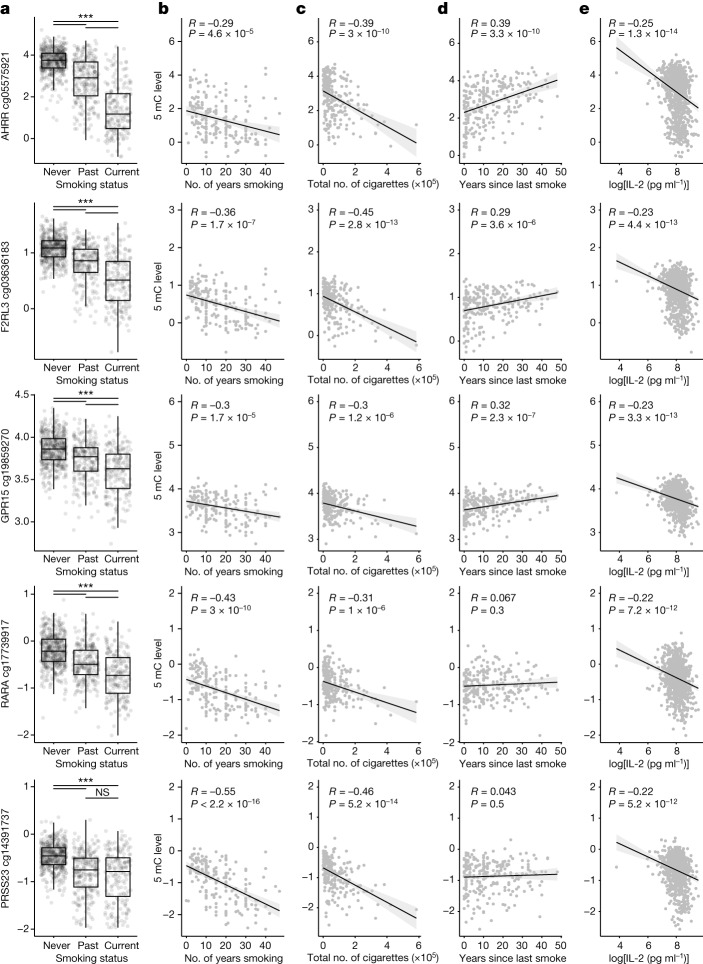
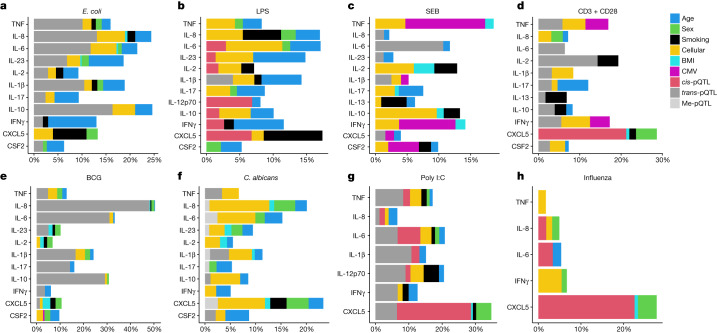
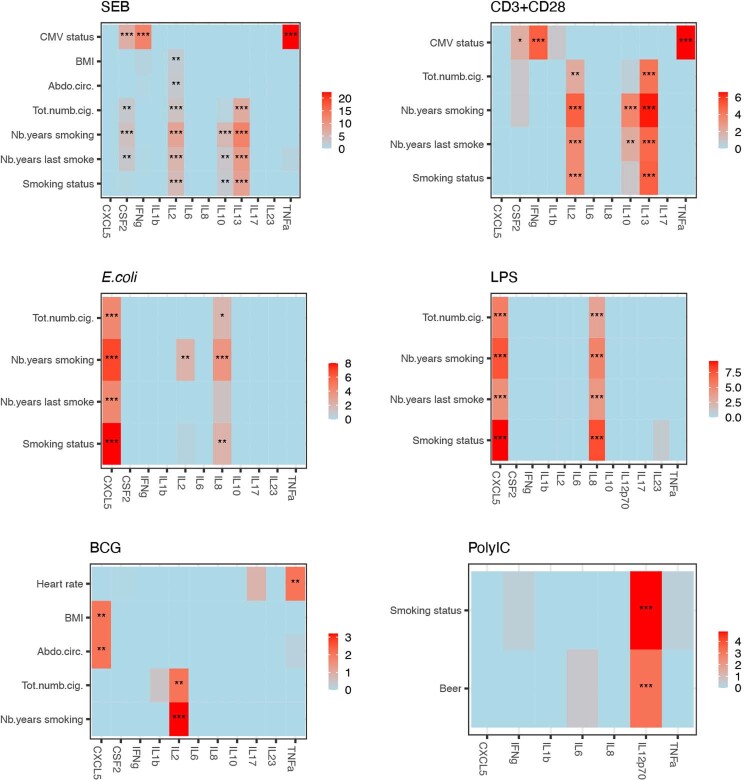
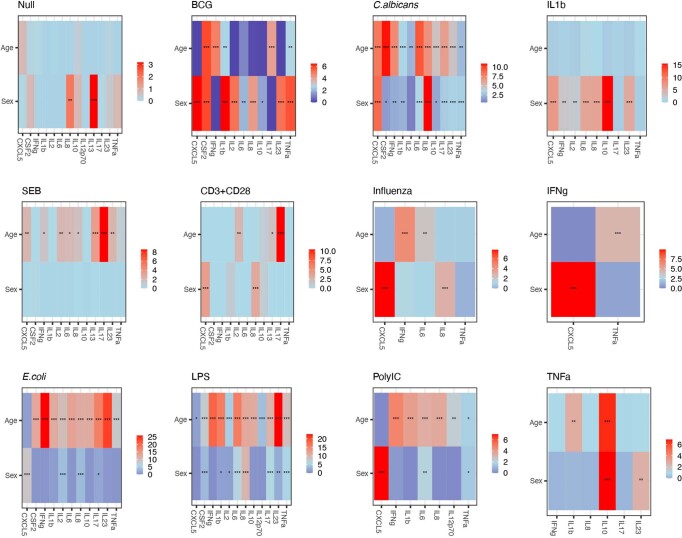
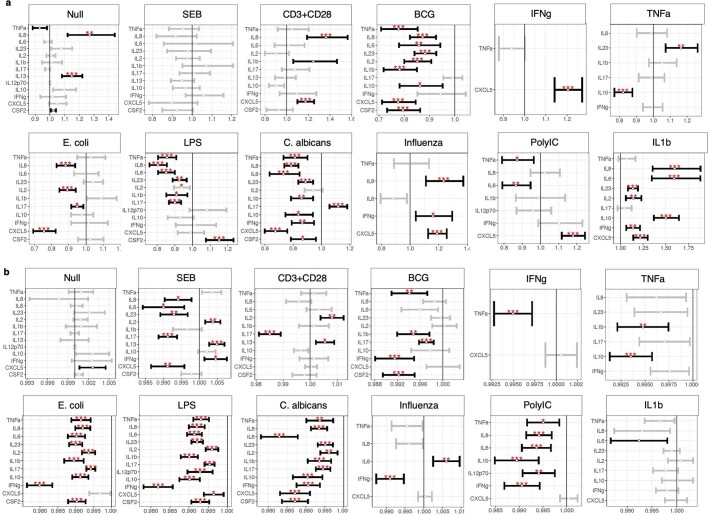
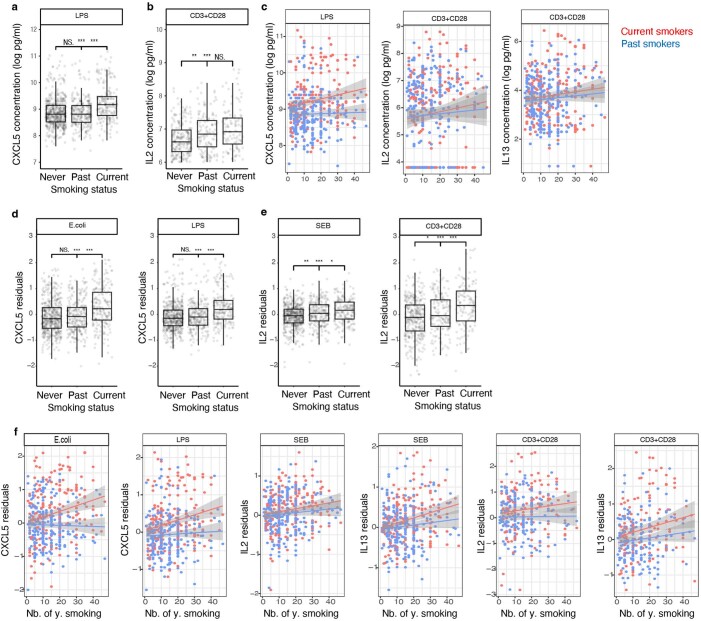
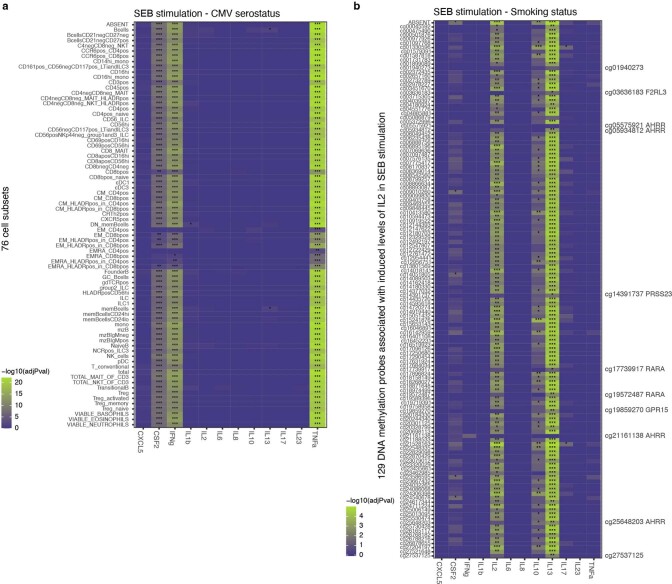
Individuals differ widely in their immune responses, with age, sex and genetic factors having major roles in this inherent variability1-6. However, the variables that drive such differences in cytokine secretion-a crucial component of the host response to immune challenges-remain poorly defined. Here we investigated 136 variables and identified smoking, cytomegalovirus latent infection and body mass index as major contributors to variability in cytokine response, with effects of comparable magnitudes with age, sex and genetics. We find that smoking influences both innate and adaptive immune responses. Notably, its effect on innate responses is quickly lost after smoking cessation and is specifically associated with plasma levels of CEACAM6, whereas its effect on adaptive responses persists long after individuals quit smoking and is associated with epigenetic memory. This is supported by the association of the past smoking effect on cytokine responses with DNA methylation at specific signal trans-activators and regulators of metabolism. Our findings identify three novel variables associated with cytokine secretion variability and reveal roles for smoking in the short- and long-term regulation of immune responses. These results have potential clinical implications for the risk of developing infections, cancers or autoimmune diseases.


Conflict of interest statement

M.L.A. is an employee of Octant Biosciences, CA, USA. D.D. previously received grant support from Rules Based Medicine. The other authors declare no competing interests.

Figures

Fig. 1
Fig. 1. Variables associated with cytokine levels in diverse immune stimulations.
a, Standardized log mean differences of 13 cytokines in 12 immune stimulations. b, Significant associations (Benjamini–Yekutieli adjusted P value of likelihood ratio test (LRT) < 0.01) of variables with at least one induced cytokine for each immune stimulation are coloured in black. c, Heat maps showing −log10(Benjamini–Yekutieli adjusted P value of LRT) for the eCRF variables associated with at least one cytokine in each stimulation (Benjamini–Yekutieli adjusted P value of LRT < 0.01). *P < 0.05, **P < 0.01, ***P < 0.001. Source Data
Fig. 2
Fig. 2. Smoking effects on innate and adaptive immune responses, represented by E. coli and SEB stimulations, respectively.
ad, Two-sided effect size plots representing effect on each induced cytokine using n = 955 independent individuals with 0.95 confidence interval for current smoking compared with non-smoking (a), for number of years smoking (b), for years since last smoke (c), and for past smoking (d) in E. coli or SEB stimulation. Significant effect sizes (P < 0.01) are in black, others are in grey. Those that also have Benjamini–Yekutieli adjusted P value of LRT < 0.01 are labelled with a red star. Exact P values are provided in the Source Data. e,f, CXCL5 concentration following E. coli stimulation (e) and IL-2 concentration following SEB stimulation (f) for never, past and current smokers. Box plots represent n = 955 independent individuals. The centre line shows the median, hinges represent the 25th and 75th percentiles and whiskers extend from the hinge to the largest or smallest values no further than 1.5 interquartile range. Two-sided Wilcoxon rank sum tests adjusting for multiple comparisons are shown. P values (left to right): 0.18, 7.3 × 10−12 and 2.1 × 10−7 (e); 1.1 × 10−5, 1.3 × 10−7 and 0.32 (f). g, CXCL5 concentration following E. coli stimulation and IL-2 and IL-13 concentration following SEB stimulation versus numbers of years smoking for current or past smokers. Grey areas depict the 0.95 confidence intervals of the linear regression lines. Source Data
Fig. 3
Fig. 3. Effects of smoking on induced cytokines is modified by blood cell subsets and plasma proteins.
a, Heat maps showing associations (−log10(Benjamini–Yekutieli adjusted P value of LRT (adj. P))) of the smoking status with induced cytokines in E. coli and SEB stimulations with either no cell subset count covariate (top line) or each of 76 cell subset counts passed as covariates in the models. b, Two-sided effect size plots representing n = 955 independent individuals with 0.95 confidence interval for current smokers compared with non-smokers in E. coli stimulation when no plasma protein (top) or CEACAM6 (bottom) is passed as a covariate in the models. Significant (P < 0.01) effect sizes are in black and others are in grey. The red star indicates a Benjamini–Yekutieli adjusted P value of LRT < 0.001. Source Data
Fig. 4
Fig. 4. Persistent effect of smoking on adaptive immune responses correlates with DNA methylation at signal trans-activators and metabolism regulators.
a, DNA methylation levels for the top probe that removes association of smoking status with IL-2 in SEB stimulation, when passed as a covariate in the models, for the indicated genes and for never, past and current smokers. The centre line shows the median, hinges represent the 25th and 75th percentiles and whiskers extend from the hinge to the largest or smallest values no further than 1.5 interquartile range and n = 955. Two-sided Wilcoxon rank sum tests adjusting for multiple comparisons. Left to right: P < 2.22 × 10−16, P < 2.22 × 10−16, P < 2.22 × 10−16 (cg05575921); P < 2.22 × 10−16, P < 2.22 × 10−16, 9 × 10−14 (cg03636183); 7.9 × 10−12, P < 2.22 × 10−16, 2 × 10−7 (cg19859270); P < 2.22 × 10−16, P < 2.22 × 10−16, 9 × 10−9 (cg17739917); P < 2.22 × 10−16, P < 2.22 × 10−16, 0.31 (cg14391737). be, Methylation (5mC level) for each probe depending on the number of years individuals smoked (for current smokers) (b), the total lifetime number of cigarettes smoked (for current smokers) (c), the number of years since last smoke (for past smokers) (d) and IL-2 concentration following SEB stimulation (e) for the indicated genes. R values and two-sided Pearson correlations are shown. Source Data
Fig. 5
Fig. 5. Induced cytokine variance explained.
ah, Percentages of variance explained by each variable associated with at least one induced cytokine in E. coli (a), LPS (b), SEB (c), anti-CD3 + CD28 (d), BCG (e), C. albicans (f), poly I:C (g) and influenza (h) stimulations. R2 contributions averaged over orderings among regressors are represented on each plot. Source Data
Extended Data Fig. 1
Extended Data Fig. 1. Principal component analysis (PCA) of individuals for the 13 cytokines in the 12 stimulation conditions.
Each dot represents one individual in a specified stimulation condition. Contributions of the cytokines to the first two dimensions are represented with arrows.
Extended Data Fig. 2
Extended Data Fig. 2. Heatmaps showing cytokine concentration levels in each stimulation condition for the 1,000 individuals of the Milieu Intérieur cohort.
Hierarchical clustering is performed with Ward method and euclidean distance on both lines and columns.
Extended Data Fig. 3
Extended Data Fig. 3. Heatmaps showing -log10(BY adj. pval of likelihood ratio test) of association for the eCRF variables associated with at least one cytokine in each stimulation considering smoking status and age interactions in the compared models.
These are coloured according to the colour key on the side of each heatmap and stars are shown depending on the strength of association (*P < 0.05; **P < 0.01; ***P < 0.001).
Extended Data Fig. 4
Extended Data Fig. 4. Heatmaps showing associations of age and sex variables corrected for sex or age respectively and for batchId, on induced cytokines in each stimulation condition.
Significance of the BY adj-pval likelihood ratio test is marked with stars (*P < 0.05; **P < 0.01; ***P < 0.001).
Extended Data Fig. 5
Extended Data Fig. 5. Effect of sex and age on on induced cytokines.
Two-sided effect size plots made from n = 955 independent individuals with 0.95 confidence interval for sex (a) and age (b) corrected for age or sex respectively and batchId, on induced cytokines in each stimulation condition for the 1,000 individuals of the Milieu Intérieur cohort. Significant effect sizes are in black, others are in grey. Significance of the BY adj-pval likelihood ratio test is marked with stars (*P < 0.05; **P < 0.01; ***P < 0.001). Source Data
Extended Data Fig. 6
Extended Data Fig. 6. Smoking effect on innate and adaptive immune responses, represented by LPS and CD3 + CD28 stimulations respectively and same plots on residuals, after regression on age, sex and batchId.
a,b, CXCL5 concentration following LPS stimulation (a) and IL-2 concentration following anti-CD3 + CD28 stimulation (b) for never, past and current smokers. Boxplots represent n = 955 independent individuals. The centre line shows the median, hinges represent the 25th and 75th percentiles whiskers extend from the hinge to the largest or smallest value no further than 1.5 interquartile range. Significance of two-sided Wilcoxon rank sum tests adjusting for multiple comparisons is indicated with stars above the boxes on the left (between never and past smokers), in the middle (between never and current smokers) and on the right (between past and current smokers) (N.S, not significant; * P < 0.05, **P < 0.01, ***P < 0.001). P-values are from left to right, for CXCL5 in LPS: 0.74, 4.9e-13 and 4.7e-10 and for IL-2 in anti-CD3 + CD28: 3.8e-03, 2.4e-05 and 0.17. c,CXCL5 concentrations following LPS stimulation or IL-2 and IL-13 concentrations following anti-CD3 + CD28 stimulation versus numbers of years smoking for current smokers (red) or past smokers (blue). Grey areas depict the 0.95 confidence intervals of the linear regression lines. d–f, Residuals of CXCL5 following E. coli and LPS stimulations (d) or of IL-2 and IL-13 following SEB and anti-CD3 + CD28 stimulations (e) after regression on age, sex and batchId variables. Boxplots represent n = 955 independent individuals. The centre line shows the median, hinges represent the 25th and 75th percentiles, and whiskers extend from the hinge to the largest or smallest value no further than the 1.5 interquartile range.Significance of two-sided Wilcoxon Rank Sum tests adjusting for multiple comparisons is indicated with stars above the boxes on the left (between never and past smokers), in the middle (between never and current smokers) and on the right (between past and current smokers) (N.S, not significant; *P < 0.05, **P < 0.01, ***P < 0.001). P-values are from left to right, for CXCL5 in E.coli: 0.38, 7.1e-10 and 9.9e-07; for CXCL5 in LPS: 0.34, 7.5e-12 and 5.6e-08; for IL-2 in SEB: 1.4e-03,1.2e-07 and 4.2e-02 and for IL-2 in anti-CD3 + CD28: 0.026, 6.7e-09 and 9.8e-04. f, CXCL5 residuals following E.coli or LPS stimulation or IL-2 and IL-13 concentrations following SEB or anti-CD3 + CD28 stimulation versus the numbers of years smoking for current smokers (red) or past smokers (blue). Grey areas depict the 0.95 confidence intervals of the linear regression lines.
Extended Data Fig. 7
Extended Data Fig. 7. Effect s of CMV status on induced cytokines is modified by blood cell subsets and effect of smoking on induced cytokines is modified by specific CpGs associated with induced levels of IL2 following SEB stimulation.
a, Heatmap showing associations of the cytomegalovirus (CMV) serostatus with each induced cytokine following SEB stimulation, with either no cellular covariate (top line) or each of 76 cell subsets passed as covariates in the models. Significance of the BY adj-pval likelihood ratio test is marked with stars (*P < 0.05, **P < 0.01, ***P < 0.001). b, Heatmap showing associations of the smoking status with each induced cytokine following SEB stimulation when either no methylation probe (top line) or each individual methylation probe associated with IL-2 concentration levels in SEB stimulation is passed as a covariate in the models. Significance of the BY adj-pval likelihood ratio test is marked with stars (*P < 0.05, **P < 0.01, ***P < 0.001).
Extended Data Fig. 8
Extended Data Fig. 8. Smoking status and SNPs interactions.
a, Heatmaps showing -log10(BY adj.pval of likelihood ratio test) of interactions between genetic variants listed in Table 1 and smoking status for each induced cytokine following BCG stimulation considering age, sex and batchId as covariates. These are colored according to the color key on the side of the heatmap and stars are shown depending on the strength of association.*P < 0.05, **P <0.01, ***P < 0.001. b, Two-sided effect size plot made representing n = 955 independent individuals with 0.95 confidence interval for the interaction of the SNP rs72636686 with the smoking status, corrected for age, sex and batchId, on induced cytokines following BCG stimulation. Significant effect sizes (p-val < 0.01) are in black, others are in grey. Those that also have BY adj.pval of the likelihood ratio test <0.01 are labelled with a red star. c, Boxplot representing n = 955 independent individuals for IL8 levels depending on the genotype for rs72636686 and the smoking status. The centre line shows the median, hinges represent the 25th and 75th percentiles, and whiskers extend from the hinge to the largest or smallest value no further than the 1.5 interquartile range. Significance of two-sided Wilcoxon rank sum tests adjusting for multiple comparisons are indicated above the compared data. Source Data
Extended Data Fig. 9
Extended Data Fig. 9. IL-2 protein levels depending on FcγRIIA polymorphism rs1801274 and genetic PCA showing homogeneity of the genetic background of Milieu Intérieur individuals.
a, Boxplots representing n = 1,000 independent individuals for IL-2 concentration levels depending on the genotype of the donors for the rs1801274 genetic variant before and after K-means clustering (2 groups) selection of responders. The centre line shows the median, hinges represent the 25th and 75th percentiles, and whiskers extend from the hinge to the largest or smallest value no further than the 1.5 interquartile range. Significance of two-sided Wilcoxon rank sum tests adjusting for multiple comparisons is indicated above the boxes (N.S, not significant; *P < 0.05, **P < 0.01, ***P < 0.001). P-values are from left to right on the top boxplot: <2.22e-16, <2.22e-16 and <2.22e-16 and on the bottom boxplot: <2.22e-16, 0.35 and 0.15. b, PCA performed on 261,827 independent SNPs and 1,723 individuals, which include the 1,000 MI donnors together with 723 individuals from a selection of 36 populations from North Africa, the Near East, as well as western and northern Europe. PC1 versus PC2 (top left), PC1 versus PC3 (bottom left) and PC2 versus PC3 (top right) are displayed as well as a barplot (bottom right) of the variance explained by the first 20 components of the PCA.
Extended Data Fig. 10
Extended Data Fig. 10. Association of DNA methylation probes with their cognate cytokines.
a, DNA methylation probes located within 1 Mb of the TSS of each cytokine that show associations (Benjamini-Hochberg false discovery rate adj-pval of likelihood ratio test <0.05) with the concentration levels of these cytokines in the specified stimulation condition (*P < 0.05). b, Plots showing the corresponding concentration levels depending on the methylation levels of the probes. Adj-r2 values of the linear regressions and p-statistics of two-sided Pearson correlations are reported on each graph.

References

    1. Brodin P, et al. Variation in the human immune system is largely driven by non-heritable influences. Cell. 2015;160:37–47. doi: 10.1016/j.cell.2014.12.020. - DOI - PMC - PubMed
    1. Quach H, et al. Genetic adaptation and neandertal admixture shaped the immune system of human populations. Cell. 2016;167:643–656.e17. doi: 10.1016/j.cell.2016.09.024. - DOI - PMC - PubMed
    1. Patin E, et al. Natural variation in the parameters of innate immune cells is preferentially driven by genetic factors. Nat. Immunol. 2018;19:302–314. doi: 10.1038/s41590-018-0049-7. - DOI - PubMed
    1. Piasecka B, et al. Distinctive roles of age, sex, and genetics in shaping transcriptional variation of human immune responses to microbial challenges. Proc. Natl Acad. Sci. USA. 2018;115:E488–E497. doi: 10.1073/pnas.1714765115. - DOI - PMC - PubMed
    1. Bakker OB, et al. Integration of multi-omics data and deep phenotyping enables prediction of cytokine responses. Nat. Immunol. 2018;19:776–786. doi: 10.1038/s41590-018-0121-3. - DOI - PMC - PubMed

MeSH terms