. 2024 Mar;627(8002):130-136.
doi: 10.1038/s41586-023-07009-0. Epub 2024 Feb 14.

Genetic determinants of micronucleus formation in vivo

Collaborators, Affiliations

Genetic determinants of micronucleus formation in vivo

D J Adams et al. Nature. 2024 Mar.

Abstract

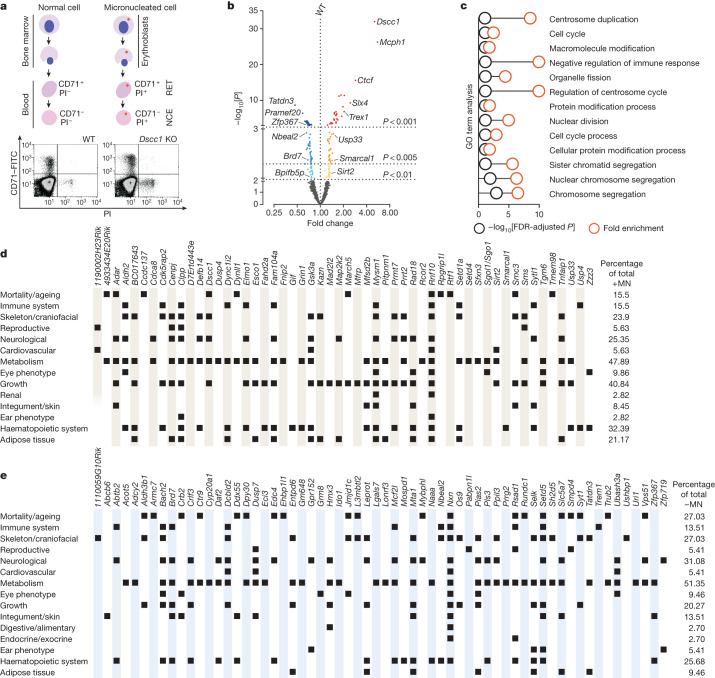
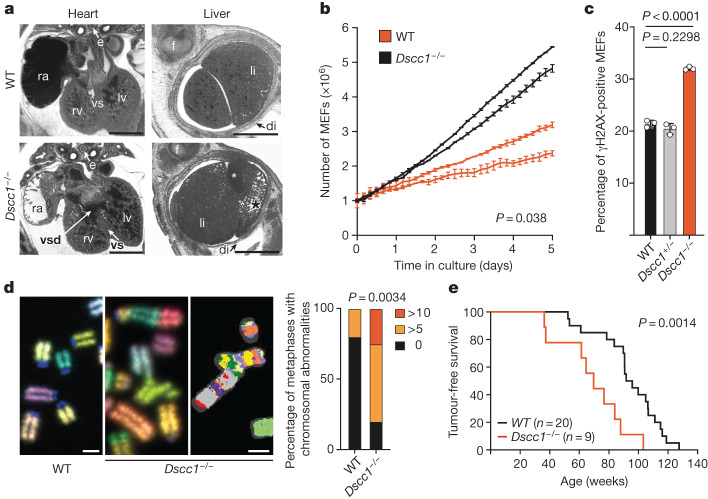
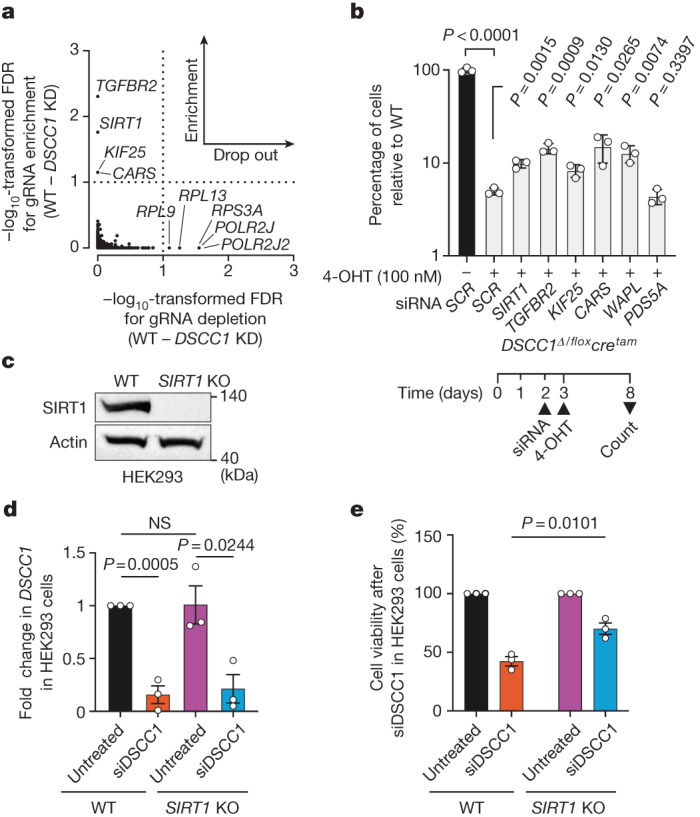
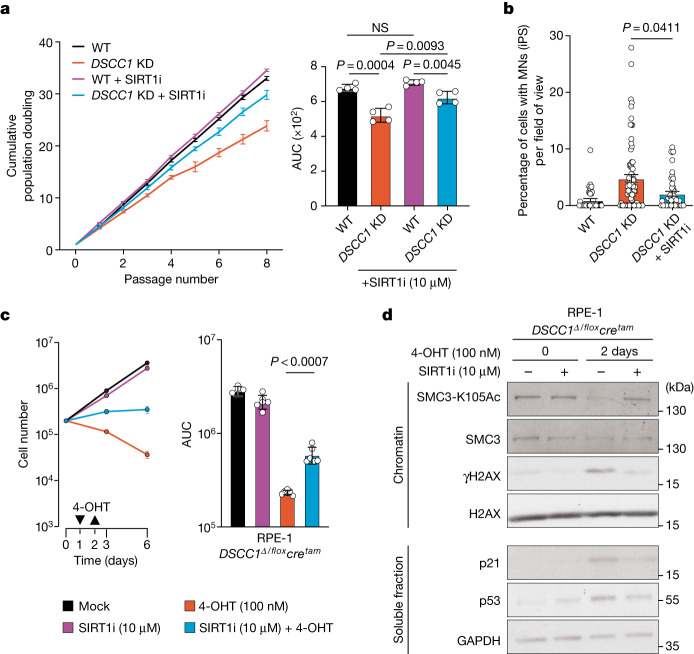
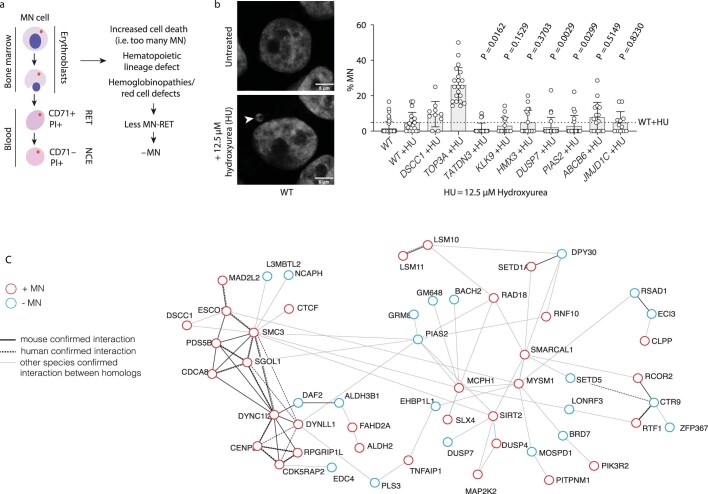
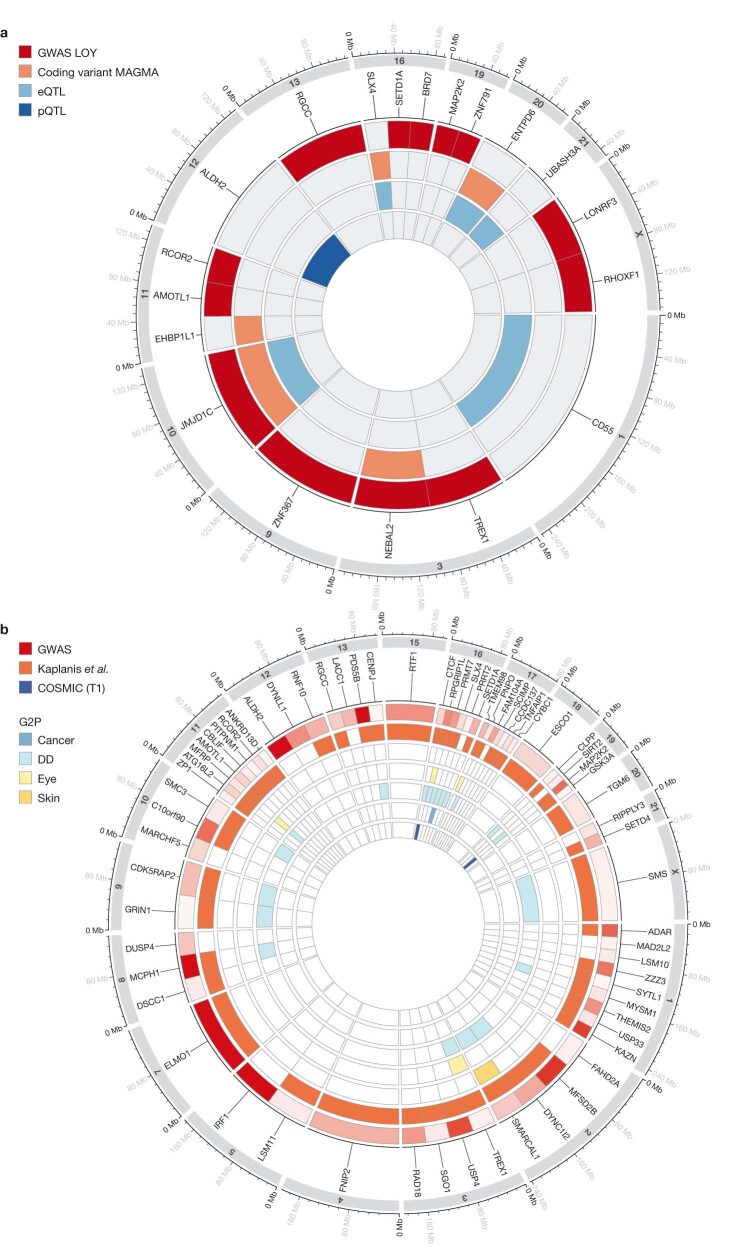
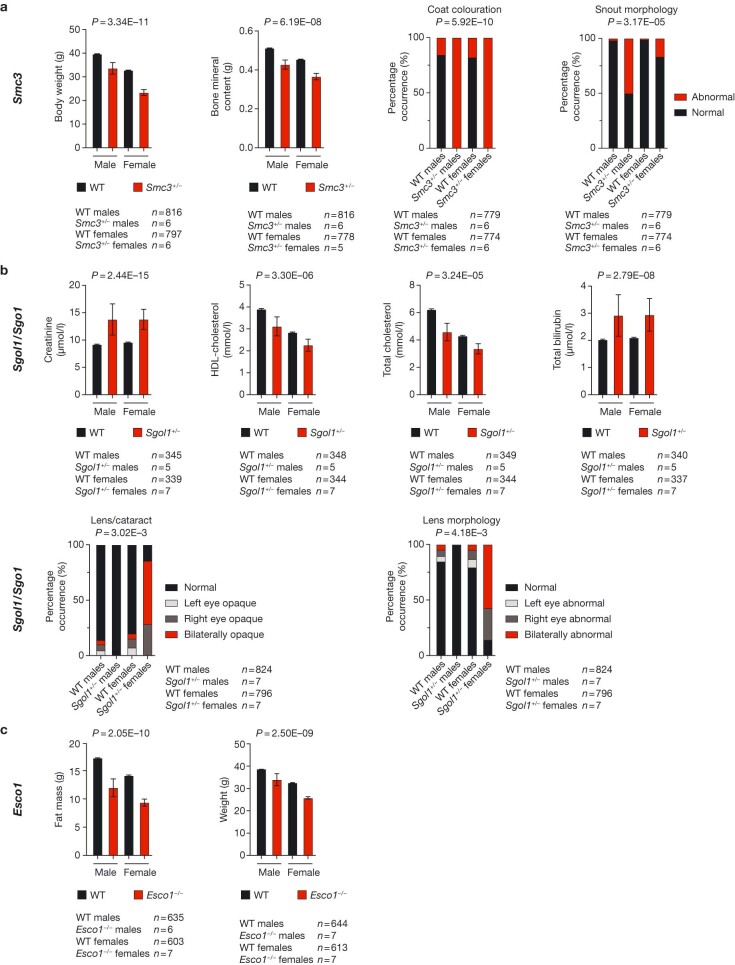
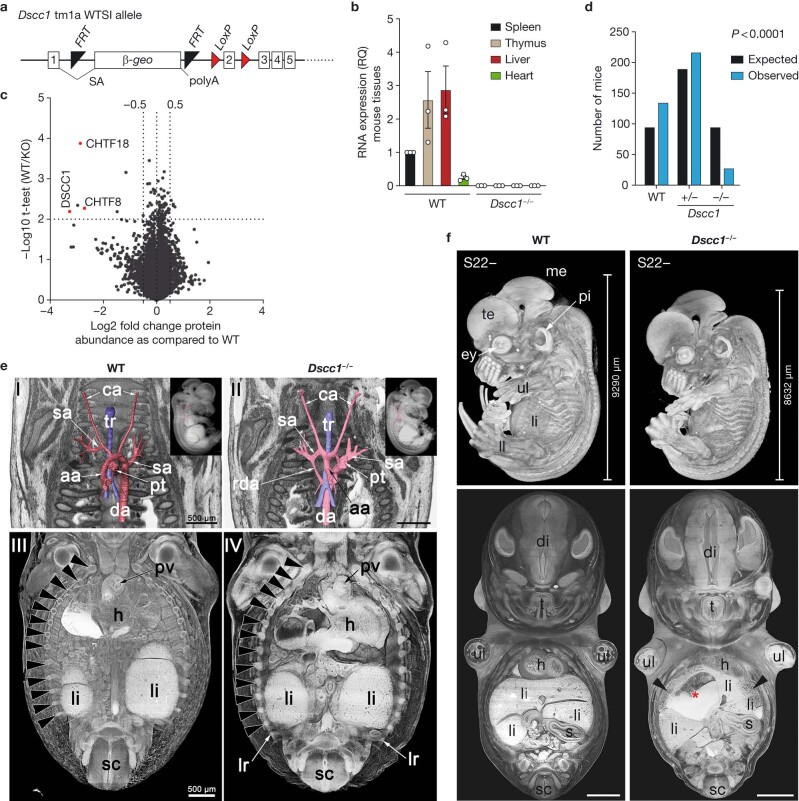
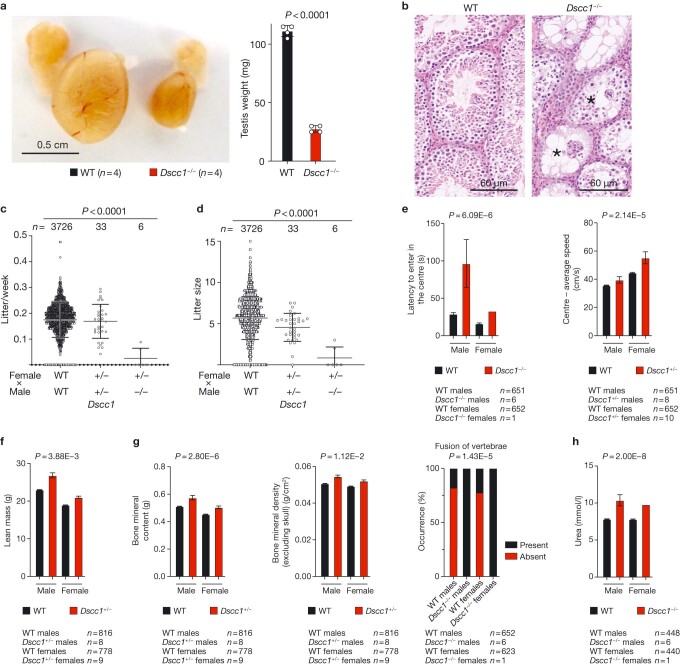
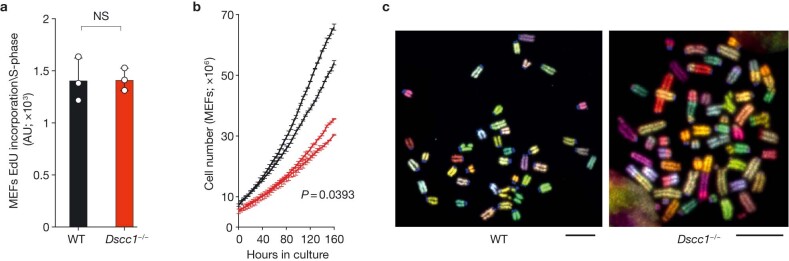
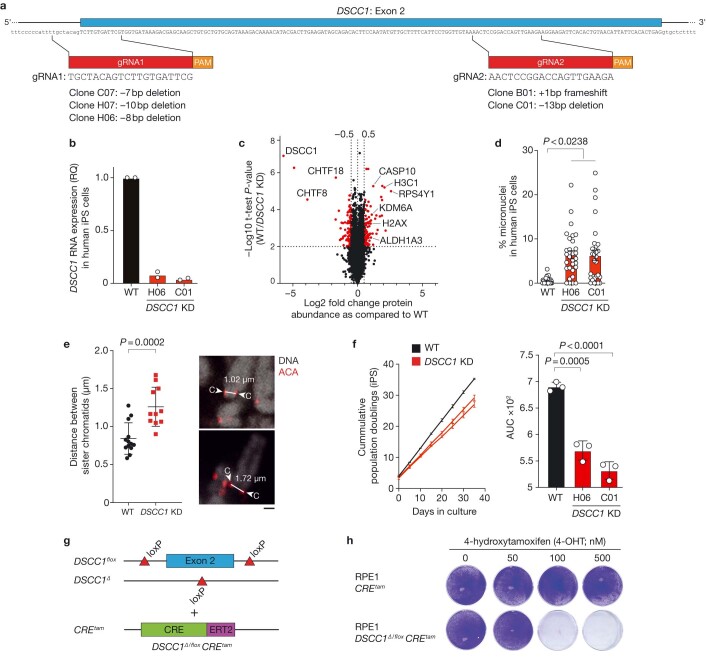
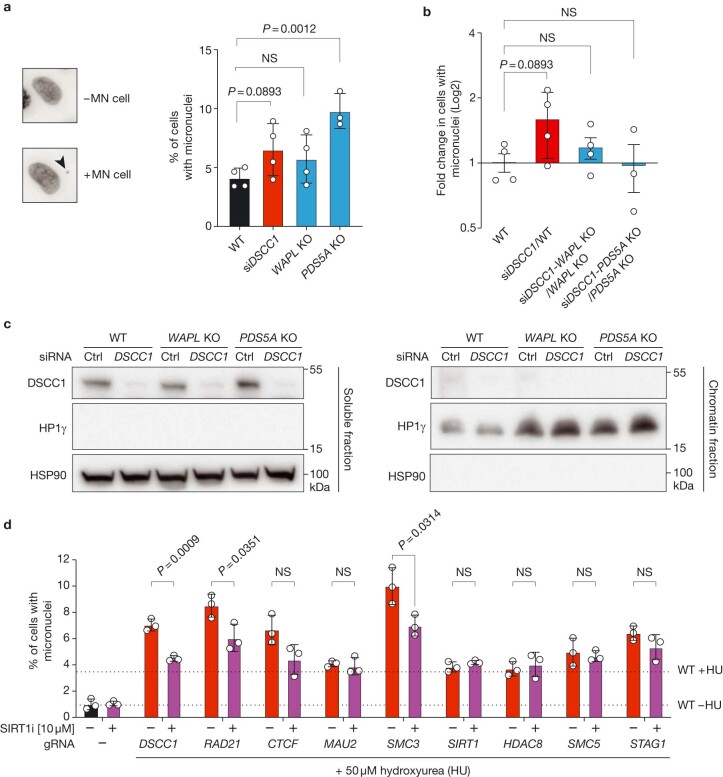
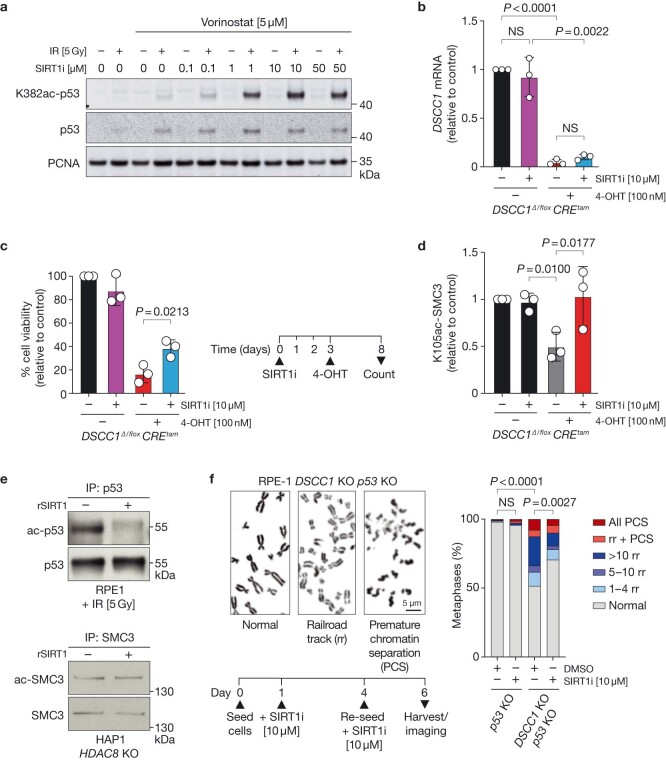
Genomic instability arising from defective responses to DNA damage1 or mitotic chromosomal imbalances2 can lead to the sequestration of DNA in aberrant extranuclear structures called micronuclei (MN). Although MN are a hallmark of ageing and diseases associated with genomic instability, the catalogue of genetic players that regulate the generation of MN remains to be determined. Here we analyse 997 mouse mutant lines, revealing 145 genes whose loss significantly increases (n = 71) or decreases (n = 74) MN formation, including many genes whose orthologues are linked to human disease. We found that mice null for Dscc1, which showed the most significant increase in MN, also displayed a range of phenotypes characteristic of patients with cohesinopathy disorders. After validating the DSCC1-associated MN instability phenotype in human cells, we used genome-wide CRISPR-Cas9 screening to define synthetic lethal and synthetic rescue interactors. We found that the loss of SIRT1 can rescue phenotypes associated with DSCC1 loss in a manner paralleling restoration of protein acetylation of SMC3. Our study reveals factors involved in maintaining genomic stability and shows how this information can be used to identify mechanisms that are relevant to human disease biology1.


Conflict of interest statement

A patent on the repurposing of SIRT1 inhibitors has been filed by the University of Cambridge. The data presented in this patent are included in the main paper and Supplementary Information. D.J.A. is a consultant for Microbiotica and Ono Therapeutics and receives research funding from Astra Zeneca and OpenTargets. M.R. is employed by Artios Pharma and is also a shareholder. J.R.B.P. is an employee of Insmed Innovation UK and holds stock/stock options in Insmed, and also receives research funding from GSK. The other authors declare no competing interests.

Figures

Fig. 1
Fig. 1. An in vivo screen for genetic regulators of MN formation.
a, Schematic of the in vivo micronucleus assay. Full protocol details have been described previously. Data for a Dscc1-KO mouse and a WT littermate control are shown. CD71, transferrin receptor; NCE, normochromatic erythrocyte; PI, propidium iodide; RET, reticulocyte. b, The MN screen results indicating mutants that, compared with the WT, have lower (−MN; left) or higher (+MN; right) MN formation and accumulation. Three statistical tiers are indicated on the basis of P-value cut-offs and false-discovery rates (FDR): tier 1 (P < 0.001; FDR < 0.017; +MN, red dots; −MN, dark blue dots); tier 2 (P < 0.005; FDR < 0.046; +MN, orange dots; −MN, blue dots); and tier 3 (P < 0.01; FDR < 0.068; +MN, yellow dots; −MN, light blue dots). The effect of genotype on the percentage of MN was assessed using a mixed linear effect beta regression model in R with baseline WT mice (n = 285) together with mice of each genotype. A total of n = 6,210 mice were analysed. Multiple testing was managed by adjusting the P values to control the FDR (Methods). The full dataset and statistics are provided in Supplementary Table 1. c, Pathway analysis for +MN screen hits, aligning them with biological processes. GO, Gene Ontology. d,e, Statistically significant phenotypes of mouse lines with increased (+MN; d) or decreased (−MN; e) MN. Out of 71 +MN mutant lines, 54 had additional phenotypes; out of 74 −MN mutant lines, 62 had additional phenotypes. The squares indicate the related organ system affected. The percentage representation of phenotypes within the +MN and −MN genes is shown on the right. The full dataset and statistical methods are available through the International Mouse Phenotyping Consortium (IMPC) (www.mousephenotype.org). The individual mouse was considered to be the experimental unit in these studies. The data presented are a snapshot from September 2023 (Methods). Tabular data are also available at GitHub (https://github.com/team113sanger/Large-scale-analysis-of-genes-that-regulate-micronucleus-formation/tree/main/Mouse_Phenotyping_Data). Source Data
Fig. 2
Fig. 2. Loss of Dscc1 leads to early developmental defects and increased genomic instability.
a, Heart and liver abnormalities in Dscc1−/− E14.5 mouse embryos. The axial section (left; dorsal to the top) and sagittal re-sections (right; ventral to the top) were obtained through high-resolution episcopic microscopy (HREM) analysis of a Dscc1-mutant (bottom) and a WT (top) embryo. Bottom left, a ventricular septal defect (vsd) in a Dscc1−/− embryo. Bottom right, abnormal liver texture, specifically, a cyst (white asterisk) and abnormally enlarged liver sinusoids combined with a reduced number of hepatocytes (black asterisk) in the liver lobe of a Dscc1−/− embryo. di, diaphragm; e, oesophagus; li, liver; LV, left ventricle; RA, right atrial appendix; RV, right ventricle; VS, ventricle septum. Scale bars, 1 mm. Three embryos per genotype were analysed. b, Growth curves of primary mouse embryonic fibroblasts (MEFs) over 5 days in culture. Two independent WT and two independent Dscc1−/− MEF lines derived from littermate embryos are shown. n = 3 independent replicates each. Data are mean ± s.d. Statistical analysis was performed using two-tailed Student’s t-tests comparing the area under the curve (AUC) values. c, Flow cytometry analysis of MEFs, showing increased genomic instability, as measured by the presence of γH2AX-positive cells, an indicator of the presence of DNA damage. n = 3 biological replicates each. Data are mean ± s.d. Statistical analysis was performed using two-tailed Student’s t-tests. d, Representative images of chromosomal abnormalities seen in primary MEFs of the indicated genotypes at passage 3 (left). Right, the percentage of abnormalities from chromosomal spreads comparing WT with Dscc1−/− MEFs. n = 3 biological replicates measuring n = 10 metaphases per genotype in each experiment. Statistical analysis was performed using two-way analysis of variance. Scale bars, 5 µm. e, Kaplan–Meyer analysis of Dscc−/− mice, showing that they have a decreased latency of tumour formation. Age and sex information are in provided in the Source Data. n = 20 (WT) and n = 9 (Dscc1−/−) mice. Statistical analysis was performed using log-rank (Mantel–Cox) tests. Source Data
Fig. 3
Fig. 3. Genetic rescue of cellular phenotypes associated with DSCC1 loss.
a, Classification of the most enriched/depleted CRISPR-target genes in DSCC1-mutant (KD) iPS cells as compared to isogenic WT controls. The dotted lines separate enriched and depleted hits and indicate the FDR thresholds. The raw data are available in the Source Data (the full analysis is available at GitHub). b, The effect of depleting the genes obtained from the DSCC1-KD CRISPR–Cas9 screen alongside the cohesin genes WAPL and PDS5A. RPE-1 DSCC1 conditional KO cells (DSCC1Δ/floxcretam) were transfected with either scrambled (SCR) siRNAs or siRNAs against the indicated gene in the presence of 100 nM 4-OHT; viability was assessed in comparison to the parental cell line (SCR; 4-OHT). The experiment was repeated n = 3 independent times (biological replicates in technical triplicate). The timeline of siRNA and 4-OHT addition is indicated. Note that the y axis is displayed on a log10 scale. Data are mean ± s.d. Statistical analysis was performed using two-tailed Student’s t-tests. c, Representative western blot analysis of SIRT1 expression in human WT and SIRT1-KO HEK293 cells. The experiment was repeated n = 3 independent times (biological replicates). d, siDSCC1 treatment of HEK293 cells leads to significantly reduced DSCC1 transcript levels as measured using quantitative PCR with Taq-Man DSCC1 probes (Methods). n = 3 independent experiments with n = 5 technical replicates each. Data are mean ± s.e.m. Statistical analysis was performed using two-tailed Student’s t-tests; NS, not significant (P > 0.05). e, SIRT1 KO rescues the siDSCC1 cell proliferation defect in HEK293 cells 3 days after DSCC1 depletion. n = 3 biological replicates with n = 5 technical replicates each. Statistical analysis was performed using two-tailed Student’s t-tests. Data are mean ± s.d. Source Data
Fig. 4
Fig. 4. SIRT1 inhibition rescues DSCC1-associated cellular phenotypes.
a, SIRT1i rescues the proliferation defect of DSCC1-mutant cells and decreases MN formation and accumulation. The proliferation of human iPS cells in which DSCC1 was disrupted (DSCC1 KD) using CRISPR–Cas9 (Extended Data Fig. 7) was compared with control cells (WT; parental line) as well as cells treated with SIRT1i. Statistical analysis was performed using two-tailed Student’s t-tests. n = 4 biological replicates. Data are mean ± s.e.m. b, SIRT1i (10 µM) treatment rescues MN formation in DSCC1-KD cells. Each dot represents an independent field of view. Data are mean ± s.e.m. Three biological replicates were performed. Significance was assessed by comparing the means of these experiments using a two-way Mann–Whitney U-test. c, Proliferation assay (left) and AUC (right) of the RPE-1 DSCC1Δ/floxcretam cell line in the presence of SIRT1i (10 µM) after DSCC1 deletion by 4-OHT treatment (addition and removal indicated by arrows). Data are mean ± s.e.m. Statistical analysis was performed using two-tailed Student’s t-tests, comparing the AUC for cells with and without SIRTi (10 µM) treatment. The experiment was performed three independent times (biological replicates) in duplicate. Significance was assessed by comparing the means of these experiments. d, Representative western blot images (from three independent/biological replicate experiments) showing chromatin fractionation of the RPE-1 DSCC1Δ/floxcretam cell line after the indicated treatments (uncropped images are shown in Supplementary Fig. 2). Source Data
Extended Data Fig. 1
Extended Data Fig. 1. Micronucleus formation in mice links multiple genetic determinants.
a, Wild-type (WT) male mice have, on average, 0.2% erythrocytes containing micronuclei; lines with a significant drop in this % were scored as showing decreased micronuclei (-MN) (see Source Data for raw values). While the +MN category likely denote lines with increased genomic instability, alternative explanations could explain the -MN lines including haemoglobinopathies, haemopoietic lineage defects or a profound increase in genomic instability in the erythroblasts that would not allow such cells to reach the peripheral circulation because of cell death prior to release from the bone marrow. b, Validation of seven -MN Tier 1 genes in human CHIP-212 cells; KO of DSCC1 and TOP3A were used as positive controls. Genes were disrupted using CRISPR-Cas9 gRNAs (Supplementary Table 6). MN levels were induced using 12.5 µM hydroxyurea for 3 days. Left panels show representative DAPI-positive and control nuclei. The arrow points to a MN. Significance was assessed using a Mann-Whitney U (two-sided) test. For each gene, data were collected from 3 independent wells (which were treated as biological replicates) by randomly selecting >200 cells and manually counting micronuclei. Bars represent mean with error bars s.d. c, Interactome analysis using STRING v.11 and BioGRID v. 4.4 showed that 54/145 of the protein products of the genes we identified as affecting MN formation have been reported to interact, thus building a core ‘MN network’. Source Data
Extended Data Fig. 2
Extended Data Fig. 2. Integration of MN hits with human genome-wide association (GWAS) and other genetic studies.
a, Circos plot showing the overlap between the mouse MN genes and human genetic datasets. The outer concentric circle (red) indicates whether the listed gene is proximal to a signal in the loss-of-Y (LOY) GWAS. The orange circle indicates whether there was a significant gene-level association between LOY and gene variants with predicted deleterious effects. Light blue indicates co-localization between GWAS and mRNA levels in the blood for the listed gene and dark blue, equivalently for blood protein levels. Corresponding results can be found in Supplementary Table 2. b, Circos plot showing the overlap between the +MN genes identified in mice and human disease datasets. Corresponding results can be found in Supplementary Table 3. G2P: genes to phenotypes. GWAS: GWAS Catalog. COSMIC (T1): COSMIC Tier 1 cancer genes. Kaplanis et al., ref. ; DD, developmental disorders (see Methods). In the outer ring the “redness” denotes the number of associations with genes in the GWAS catalogue. Where there are multiple genes on a chromosome, we segmented the chromosome into equal bins.
Extended Data Fig. 3
Extended Data Fig. 3. Phenotypic analysis of mouse mutants related to cohesion defects.
Bar graphs showing selected significant phenotypic differences for the cohesin-related mouse lines Smc3 (a), Sgol1/Sgo1 (b) and Esco1 (c). The individual mouse was considered the experimental unit within the studies. The mean is shown with error bars denoting the s.d. The numbers of mice and statistical methods used are detailed on the IMPC website. P values were calculated depending on the data type (continuous or categorical) within the Phenstat Package in R (version 3.18) which deploys linear mixed modelling (10.18129/B9.bioc.PhenStat) or using Fisher’s tests (for categorical data). These statistical methods are available in the phenotyping file on Github/Figshare and are also available on the IPMC database website. The data presented are a snapshot from September 2023 (see Methods) as part of IMPC release 19.
Extended Data Fig. 4
Extended Data Fig. 4. Dscc1 mutant mice show cardiac and vascular anomalies and reduced viability.
a, Diagram shows the targeting of the Dscc1 locus on mouse chromosome 15. A beta-galactosidase gene-trap including a splice acceptor site (SA) and a polyadenylation sequence (polyA) were inserted in intron 1 of the Dscc1 gene. Further elements were inserted to allow the generation of a conditional allele, such as FRT and LoxP sites. b, Bar graph showing quantitative PCR analysis of Dscc1 transcripts in adult mouse tissues. n = 3 mice with n = 5 technical replicates each. Mean is plotted with error bars representing s.e.m. c, Mass-spectrometry analysis of E13.5 embryo heads showing depletion of DSCC1, CHTF8 and CHTF18 proteins (members of the DSCC1-CHTF18-CHTF8 protein complex). The raw files were processed with Proteome Discoverer 2.4 (ThermoFisher) using the Sequest HT search engine and the analysis is presented in Source Data. Proteins/peptides were validated using Percolator. Only unique peptides were used for quantification. Red dots denote key significantly differentially expressed proteins (Student’s two-tailed t-test was used to determine significance). Two embryos of each genotype were analysed in this way. d, Mice born from Dscc1 heterozygous (+/−) intercrosses that survived past post-natal day 10 (P10) were genotyped and a Chi-squared analysis (two-tailed) was performed using the expected versus observed numbers of each genotype. Approximately a third of the expected Dscc1−/− mice survived past P10. e, Skeletal and vascular abnormalities in Dscc1−/− (right panels) embryos and for comparison control (left panels) embryos. Great intrathoracic arteries at developmental stage S22- (upper panels) are shown. Abnormal persistence of right dorsal aorta (rda) in a Dscc1−/− embryo. Surface models of the arteries in front of a coronal section through HREM data from anterior. Inlay shows the surface models inside a semitransparent volume model from right. Coronally sectioned semi-transparent volume models of thorax and abdomen from ventral (lower panels). The regular 13 ribs are indicated with arrowheads. Note the lumbar rib (lr) in the Dscc1−/− embryo. f, Growth delay and liver abnormalities in Dscc1−/− embryos. Control/wild-type (left panels) and Dscc1−/− (right panels) embryos are shown. Upper row: Growth and developmental delay can be seen in a E14.5 Dscc1−/− embryo relative to WT embryo. In addition, the developmental stage (S22-) of Dscc1−/− mutants is earlier than of wild-type littermates and as expected from reference data. Lower row: Abnormal liver. Coronally sectioned semi-transparent volume models of thorax and abdomen from ventral. Blood filled cyst (red asterisk) and enlarged liver sinusoids (arrowheads). te, telencephalon; me, mesencephalon; ey, eye; pi, pinna; ul, upper limb; ll, lower limb; li, liver; tr, trachea; ca, common carotid artery; h, heart; pv, pulmonary valve; sa, subclavian artery; aa, ascending aorta; da, descending aorta; pt, pulmonary trunk; rda, right descending aorta, di, diencephalon; t, tongue; s, spleen; sc, spinal cord. For this experiment, n = 3 embryos/genotype were analysed. Source Data
Extended Data Fig. 5
Extended Data Fig. 5. Surviving Dscc1 mutant mice show phenotypes affecting several major organ systems.
a,b, Dscc1−/− male mice have smaller testes than wild-type (WT) littermates. a, Macroscopic image for comparison is shown (left). Scale bar shows size estimate. Testis weight (right). Significance was assessed using a Student’s two-tailed t-test. Data are from four mice (37 weeks old) with average weight per mouse testis shown. Bars and whiskers are mean and s.d. b, Dscc1−/− testis showed complete agenesis of seminiferous tubules (asterisk) following haematoxylin and eosin staining. Scale bar shows size estimate. In this experiment, n = 3 animals per genotype were analysed. c,d, Breeding using Dscc1 mutant mice and WT controls and quantification of the number and size of litters produced showed that Dscc1−/− male mice are sub-fertile. Significance was assessed using a student’s two-tailed t-test. Bars represent mean with s.d. The n numbers are shown in the figure. Limited matings were performed with Dscc1−/− female mice but these animals produced live born pups. Owing to the reduced penetrance of Dscc1−/− mice, elements of the phenotyping were performed using Dscc1+/− mice (as indicated). eh, Dscc1 mutant mice show significant differences in lean mass, skeletal structure and development, behaviour and metabolism. Bars represent mean with s.d. P values were calculated depending on the data type (continuous or categorical) within the Phenstat Package in R (version 3.18) which deploys linear mixed modelling (10.18129/B9.bioc.PhenStat) or using Fisher’s tests (for categorical data). These statistical methods are available in the phenotyping file on Github/Figshare and are also available on the IPMC database website. The data presented are a snapshot from September 2023 (see Methods) as part of IMPC release 19. Source Data
Extended Data Fig. 6
Extended Data Fig. 6. Dscc1 mouse embryonic fibroblasts (MEFs) grow slower and show increased genomic instability.
a, Bar graph quantifying the incorporation of 5-Ethynyl-2’-deoxyuridine (EdU) in MEFs of the indicated genotypes shows no difference in the S-phase cell cycle fraction. Significance was assessed using a Student’s two-tailed t-test. Experiment performed three independent times (n = 3 biological replicates). Mean is shown with the error bars denoting s.d. b, Cell growth profiles (left) for cell lines derived from the same E13.5 litter show that Dscc1−/− MEFs grow significantly slower than wild-type (WT) controls. For a,b, two independent WT and two independent Dscc1−/− MEF lines were derived from littermate embryos; n = 3 independent wells/replicates each. Bars represent mean with s.e.m. Significance was assessed using an Student’s two-tailed t-test comparing the area under the curve (AUC). c, Fluorescent in-situ hybridization (FISH) images of metaphases from MEFs derived from littermates showing increased chromosomal aberrations characteristic in Dscc1−/− cells. This experiment was replicated three independent times. Size bar 10 µm. This image is a lower magnification of the image shown in Fig. 2d. Source Data
Extended Data Fig. 7
Extended Data Fig. 7. DSCC1 mutant induced pluripotent stem (iPS) cells show increased micronucleus formation.
a, Diagram showing the targeting of the DSCC1 locus on human chromosome 8. Two different guide RNAs (gRNA) were used to generate clones. The position of these gRNAs is shown. After transfection, individual clones were picked and genotyped (see Methods). b, Bar graph of the DSCC1 transcript levels in two independent iPS cell lines by quantitative PCR analysis using TaqMan probes shows effective gene knock-down (KD) and transcript truncation. n = 2 independent experiments with n = 5 technical replicates each. c, Mass-spectrometry analysis of DSCC1 KD iPS cells showing depletion of DSCC1 levels as well as disruption of other DSCC1-CHTF18-CHTF8 complex proteins. Red dots denote peptides that are significantly changed in abundance compared to wild-type (WT) (see Methods). Raw data are presented in Source Data. Significance was assessed by one sample T-test, two-tailed, Benjamini-Hochberg FDR = 0.05. The data are from one mass-spec run comparing a reference proteome of the parental “BOB” iPS line to 5 proteomes from independently cultured DSCC1 KD clones. d, Quantification of the micronucleus levels in two independent iPS DSCC1 KD clones and isogenic (WT) control cells. MN were measured as DAPI positive structures present outside of the nuclear envelope. n = 3 independent experiments/biological replicates with each dot equalling an independent field of view with >50 cells; Bars represent mean, error bars are s.e.m. Analysis was performed using a Mann-Whitney U (two-sided) test. e, Quantification of the inter-centromere (c) distance by use of anti-centromere antibodies (ACA) shows that loss of DSCC1 leads to a significant increase in the distance between the two sister chromatids. Each data point is an independent measure randomly selected from across three independent cultures (see Source Data). Bars represent mean with error bars denoting the s.d. Significance was assessed using a Student’s two-tailed t-test. Scale bar 1 µm. f, Cumulative population doubling analysis over 40 days in culture shows that DSCC1 KD iPS cells grow significantly slower than isogenic WT control cells (area under the curve, AUC). Data were generated with n = 2 independent lines (H06 [upper] and C01 [lower]) with n = 3 biological replicates each. Bars are means with error bars denoting s.d. Significance was assessed using Student’s two-tailed t-test on AUC values. g, TERT RPE-1 DSCC1Δ/flox conditional cells were imported as a gift from the Jallepalli Laboratory. In these cells, one allele of DSCC1 has been disrupted (Δ; delta), while the other allele is flanked by loxP sites (flox). To create an inducible system, we stably integrated a tamoxifen inducible CRE recombinase (CRE) construct (where the CRE recombinase is fused to a mutant oestrogen ligand-binding domain (ERT2) that requires the presence of 4-hydroxytamoxifen (4-OHT) for activity; CREtam). h, Optimal 4-hydroxytamoxifen dose determination by crystal violet staining of hTERT RPE-1 DSCC1Δ/floxCREtam cells treated for three days with different 4-hydroxytamoxifen (4-OHT) concentrations. The dose that killed all DSCC1Δ/floxCREtam cells, but did not affect their parental hTERT RPE-1 CREtam counterpart, was used in subsequent experiments (100 nM). This experiment was performed n = 3 times (biological replicates). Source Data
Extended Data Fig. 8
Extended Data Fig. 8. Validation of the DSCC1 suppressor CRISPR screen.
a, Quantification of the % of cells with micronuclei (MN) in HAP1 cells. Depletion of DSCC1 (siDSCC1) or PDS5A (KO), but not WAPL (KO), resulted in a significant increase in %MN. Each point on the graph represents and independent experiment where more than 50 cells were counted. Representative images are presented on the left hand side; arrow head points at DAPI positive MN. Significance was assessed using a two-tailed Student’s t-test. n = 3 biological replicates with n ≥ 50 cells counted each. Bars represent mean with s.d. b, Quantification of the fold-change in MN formation in siDSCC1/WT as compared to siDSCC1-WAPL KO and siDSCC1-PDS5A KO relative to WAPL KO and PDS5A KO alone, respectively (HAP1 background). Significance was assessed using a two-tailed Student’s t-test (NS, not significant; P > 0.05). n = 3 biological replicates with n ≥ 50 cells counted per replicate. Bars represent mean with s.d. c, Representative western blot images from soluble and chromatin fraction extracts from HAP1 cells depicting siRNA depletion of DSCC1. This experiment was repeated three times and the uncropped images are presented in Supplementary Fig. 2. d, Quantification of the effect of SIRT1 inhibition with Selisistat (EX 527; SIRT1i; 10 µM) on the MN formation when the cohesion-associated genes RAD21, CTCF, MAU2, SMC3, HDAC8, SMC5 and STAG1 were disrupted using CRISPR-Cas9 (see Methods) in RPE-1 cells. DSCC1 KO and SIRT1 KO were used as controls. To increase the dynamic range, MN were induced by a 3-day chronic treatment with 50 µM hydroxyurea (HU) (see HU titration for the different cell lines in Supplementary Table 7). Significance was assessed using Student’s two-tailed t-test (NS, not significant; P > 0.05). n = 3 biological replicates with n ≥ 50 cells per replicate counted. Bars represent mean with s.d. Source Data
Extended Data Fig. 9
Extended Data Fig. 9. SIRT1 inhibition rescues the DSCC1 cohesion defect independent of p53 and not via direct SMC3 deacetylation.
a, Representative images of immunoblots showing the effect of increasing concentrations of SIRT1 inhibitor on the p53-K382 acetylation levels in the RPE-1 DSCC1Δ/flox CREtam cell line upon gamma irradiation in the presence of the HDAC1 inhibitor, vorinostat. Uncropped western images are presented in Supplementary Fig. 2. This experiment was performed once. b, DSCC1 mRNA quantification by RT-qPCR in the RPE-1 DSCC1Δ/flox CREtam cell line after the indicated treatments show that DSCC1 can be depleted by the addition of 100 nM 4-OHT. Note that SIRT1 inhibition (SIRT1i) does not significantly affect DSCC1 levels. n = 3 independent experiments/biological replicates with n = 5 technical replicates each. Bars represent mean with s.d. Significance was assessed by a Student’s two-tailed t-test (NS, not significant; P > 0.05). c, Independent experiment in the RPE-1 DSCC1Δ/flox CREtam cell line in the presence of SIRT1 inhibitor upon DSCC1 depletion by 4-OHT treatment shows that SIRT1i can significantly rescue cell viability. Significance calculated using a two-tailed Student’s t-test. The experiment was repeated three independent times (biological replicates) with three technical replicates each. Mean is plotted with the error bars denoting the s.d. d, Quantification of the western blots for which representative images are presented in Fig. 4d showing SMC3 acetylation at K105 is significantly restored in the DSCC1Δ/flox CREtam cells upon SIRT1i. Statistical analysis was performed using a two-tailed Student’s t-test; bars represent mean with s.d. The experiment was performed three times independently. e, Representative immunoprecipitation (IP) followed by immunoblotting from a SIRT1 in vitro deacetylation assay performed by using recombinant SIRT1 protein (rSIRT1). The rSIRT1 can deacetylate p53 at K382 (upper panels) but cannot deacetylate SMC3 even in absence of HDAC8 (lower panels). n = 3 independent repeats (biological replicates). f, On the left, representative images of metaphase chromosomes from three independent experiments/biological replicates illustrating normal, railroad (RR) chromosomes as well as chromosomes with premature sister chromatid separation (PCS) in different stages from TERT-RPE-1-p53 KO cells as compared to TERT-RPE-1 p53 KO DSCC1 KO with and without SIRT1i. Size bar 5 µm. Below is represented the timeline for the experimental setup. On the right, quantification of the different RR and PCS events in the metaphasis from RPE-1 p53 KO vs. RPE-1 p53 KO DSCC1 KO with and without SIRT1i. The experiment was repeated n = 3 independent times (biological replicates). More than 50 metaphases/genotype were analysed. Statistical analysis comparing the proportions of normal cell metaphases and cell-defect metaphases was performed with a logistic regression model; NS, not significant; P > 0.05. Source Data

References

    1. Jackson SP, Bartek J. The DNA-damage response in human biology and disease. Nature. 2009;461:1071–1078. doi: 10.1038/nature08467. - DOI - PMC - PubMed
    1. Leibowitz ML, Zhang C-Z, Pellman D. Chromothripsis: a new mechanism for rapid karyotype evolution. Annu. Rev. Genet. 2015;49:183–211. doi: 10.1146/annurev-genet-120213-092228. - DOI - PubMed
    1. Campbell PJ, et al. Pan-cancer analysis of whole genomes. Nature. 2020;578:82–93. doi: 10.1038/s41586-020-1969-6. - DOI - PMC - PubMed
    1. Mackenzie KJ, et al. cGAS surveillance of micronuclei links genome instability to innate immunity. Nature. 2017;548:461–465. doi: 10.1038/nature23449. - DOI - PMC - PubMed
    1. Harding SM, et al. Mitotic progression following DNA damage enables pattern recognition within micronuclei. Nature. 2017;548:466–470. doi: 10.1038/nature23470. - DOI - PMC - PubMed