. 2024 Feb;626(8001):1102-1107.
doi: 10.1038/s41586-024-07047-2. Epub 2024 Feb 14.

Bone marrow plasma cells require P2RX4 to sense extracellular ATP

Affiliations

Bone marrow plasma cells require P2RX4 to sense extracellular ATP

Masaki Ishikawa et al. Nature. 2024 Feb.

Abstract

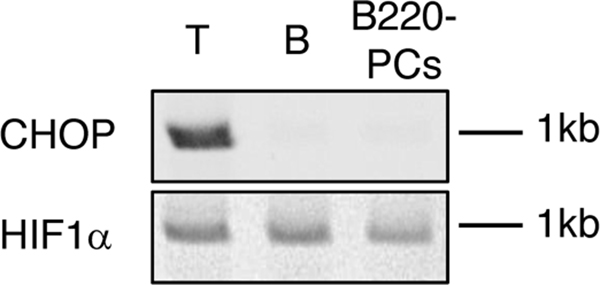
Plasma cells produce large quantities of antibodies and so play essential roles in immune protection1. Plasma cells, including a long-lived subset, reside in the bone marrow where they depend on poorly defined microenvironment-linked survival signals1. We show that bone marrow plasma cells use the ligand-gated purinergic ion channel P2RX4 to sense extracellular ATP released by bone marrow osteoblasts through the gap-junction protein pannexin 3 (PANX3). Mutation of Panx3 or P2rx4 each caused decreased serum antibodies and selective loss of bone marrow plasma cells. Compared to their wild-type counterparts, PANX3-null osteoblasts secreted less extracellular ATP and failed to support plasma cells in vitro. The P2RX4-specific inhibitor 5-BDBD abrogated the impact of extracellular ATP on bone marrow plasma cells in vitro, depleted bone marrow plasma cells in vivo and reduced pre-induced antigen-specific serum antibody titre with little posttreatment rebound. P2RX4 blockade also reduced autoantibody titre and kidney disease in two mouse models of humoral autoimmunity. P2RX4 promotes plasma cell survival by regulating endoplasmic reticulum homeostasis, as short-term P2RX4 blockade caused accumulation of endoplasmic reticulum stress-associated regulatory proteins including ATF4 and B-lineage mutation of the pro-apoptotic ATF4 target Chop prevented bone marrow plasma cell demise on P2RX4 inhibition. Thus, generating mature protective and pathogenic plasma cells requires P2RX4 signalling controlled by PANX3-regulated extracellular ATP release from bone marrow niche cells.


Conflict of interest statement

Competing interests

The authors have no competing financial interests.

Figures

Extended Data Figure 1.
Extended Data Figure 1.. Panx3 mutation does not perturb developing or mature myeloid and lymphoid cell populations.
(a) Numbers of viable BM cells in 16-week-old Panx3+/+ and Panx3−/− mice. (b-e) Evaluation of the indicated BM myeloid and B-lineage cells (b), thymocytes (c), T and B cells in spleen (d) and peritoneal B1 cells (e). (b) Numbers of macrophages (CD115 Gr1 F4/80+), Gr1+ and Gr1 monocytes (CD115+ Gr1high, CD115 Gr1low F4/80+/− respectively), neutrophils (CD115 Gr1high), pro- & pre-B cells (CD19+ IgM CD43+/−), and immature (CD19+ IgM+ IgD) and mature (CD19+ IgM+ IgD+) B cells. (c-e) Numbers of CD4 and CD8 single positive thymocytes (c), splenic CD4 and CD8 T cells and mature (CD19+ IgD+) B cells (d), and peritoneal cavity CD19+ CD43+ B1 B cells (e) in 5-month-old Panx3+/+ and Panx3−/− mice. (See Extended Figs. 2 and 3 for flow cytometry gating strategies for BM and spleen cells). (n=6/grp for panels a-d, n=3/grp for panel e). (f, g) CD138+ Sca-1+ PCs in the BM (f) and spleen (g) in 16-week-old Panx3+/+ and Panx3−/− mice (n=6/grp). Plots in (f) show additional analysis of newly formed (B220+) and mature (B220) PCs. All bar graphs are means. For panels (a,b), *, p = 0.0022. All p values were derived from two-tailed Mann-Whitney tests, without any adjustment for multiple comparisons. The experiments in panels (a-d) and (f-g) were performed at least thrice and the experiments in panel (e) were performed twice.
Extended Data Figure 2.
Extended Data Figure 2.. Gating strategy for BM analysis.
Gating strategy for flow cytometric analysis of BM cells related to Figure 1c, 2b, 2f, 3b, 4a, 4b and Extended Data Figure 1f, 5a, 6a, 6e, 7a, 8a.
Extended Data Figure 3.
Extended Data Figure 3.. Gating strategy for spleen analysis.
Gating strategy for flow cytometric analysis of splenocytes related Extended Data Figure 7d, 8d.
Extended Data Figure 4.
Extended Data Figure 4.. Panx3 and eATP support BM PCs.
(a) Schematic for experiments wherein fresh BM cells were cultured with pre-induced osteoblastic cells for 4 days before ELISPOT analyses. (b) Quantitative RT-PCR for CXCL12, SCF, IL6 and APRIL expression with osteoblastic calvarial cells from Panx3+/+ and Panx3−/− mice after 14 days culture as in (a). Graph shows means for technical replicates; n = 3. A control Panx3+/+ sample was set to 1 for each set of measurements, and the other measurements were recalculated relative to that sample. All p values were derived from two-tailed Mann-Whitney tests, without any adjustment for multiple comparisons. The experiments in panel b were performed twice.
Extended Data Figure 5.
Extended Data Figure 5.. P2rX inhibitors deplete BM PCs.
(a) Representative flow cytometry data for BM PCs in WT mice given DMSO alone (Control) or Suramin (2.0 mg/kg), PPADS (2.5 mg/kg), or both Suramin and PPADS thrice over seven days before analysis. Representative of 3 mice per group and three separate experiments. (b) Expression of P2rX and P2rYfamily members in BM PCs (ImmGen data, see Methods). (c) Annotated UMAP visualizing naïve and memory B cells and plasma cells identified in adult human bone marrow (left) with Heatmap visualizing averaged and gene-wise scaled gene expression for each population (right) (see Methods).
Extended Data Figure 6.
Extended Data Figure 6.. Selective impact of B-lineage P2rX4 mutation on BM PCs.
(a) Flow cytometric analyses for BM B220+/− CD138high PCs, and numbers of splenic PCs (Dump IgD CD138+ Sca-1+) (b, c) Cell numbers for plasma cells in spleen (b) or indicated cell populations in spleen and BM (c) and peritoneal cavity CD19+ CD43+ B1 B cells (d) in 5-month-old WT;Mb1-Cre and P2rX4f/f;Mb1-Cre adults. (For panels (a-c) n=6/group and for panel (d) n=3/group). (e,f) Analysis of B220+/− CD138high BM PCs (e) and all splenic PCs (CD138high Sca-1+) (f) in WT;CD20-TAM-Cre and P2rX4f/f; CD20-TAM-Cre adults. (g) Numbers of the indicated T and B cell subsets in the spleen and developing B cells in BM of the indicated mice. (h) ELISPOT analyses of IgG-secreting BM cells from CD20-TAM-Cre and P2rX4f/f;CD20-TAM-Cre mice fed tamoxifen-laced chow for 4 weeks previously. BM cells from tamoxifen-fed mice were cultured for 2 days with or without adding 100μM ATP prior to addition to ELISPOT assay. For panels (e-h) n=6/grp. All bar graphs are means. For panels (a-h) experiments were performed at least thrice. *, p = 0.0022. All p values were derived from two-tailed Mann-Whitney tests, without any adjustment for multiple comparisons.
Extended Data Figure 7.
Extended Data Figure 7.. Induced B-lineage-restricted P2rX4 mutation in mature BM PCs.
(a) Cre expression in B220 BM LLPCs of CD20-TAM-Cre adults. Data are representative plots of n=3 mice/grp. (b) P2rX4 genomic-PCR for sorted T cells, B cells, and B220 PCs of CD20-TAM-Cre adult mice fed tamoxifen for 1 week (n=3). HIF1α used as a DNA loading control. BM B220 PCs were sorted sequentially twice to ensure purity. For gel source data, see Supplementary Figure 1. (c) NP-specific IgG+ PCs in the spleen of the indicated mice. All mice were given tamoxifen-laced chow for 4 weeks beginning at 5 weeks of age, then immunized with NP-KLH/alum and analyzed by ELISPOT 30 days later. Error bars represent the mean (n = 5/grp). (d) NP-specific GC B cells in separate tamoxifen-fed WT;CD20-TAM-Cre and P2rX4f/f; CD20-TAM-Cre adults immunized 14 days previously. Graph shows means for hapten-binding GC B cells for 3 mice/group. For a comprehensive illustration of parent gates for evaluating NP-specific GC B cells see extended Figure 3. Experiments in every panel including the PCR data in (b) were performed twice. All p values were derived from two-tailed Mann-Whitney tests for all plots, without any adjustment for multiple comparisons.
Extended Data Figure 8.
Extended Data Figure 8.. Differential impact of P2rX4 inhibition on BM PCs versus naïve and GC B cells.
Flow cytometric analysis of BM and spleen cells from B6 adult females given 5-BDBD (4.25 mg/kg) or DMSO alone as control every 2 days i.v. 4 times. All analyses occurred 8 days after the first dose. (a-c) Shown are steady state B-220+/− BM PCs (a), splenic PCs (b), and naïve splenic T and B cells and BM B-lineage cells (c) from unimmunized mice. For panels (a-c) n=6/grp from one of three experiments. (d) NP-specific GC B cells in separate mice immunized 14 days before with NP-KLH (n=3/grp, representative of two separate experiments). For a comprehensive illustration of parent gates for evaluating NP-specific GC B cells see extended Figure 3. (e) Numbers and representative flow cytometric analysis of peritoneal cavity CD19+ IgM+ CD43+ B1 B cells in control and 5-BDBD treated C57BL/6 adults. n=4/group. All bar graphs are means. All p values were derived from two-tailed Mann-Whitney tests for all plots, without any adjustment for multiple comparisons.
Extended Data Figure 9.
Extended Data Figure 9.. Rapid recovery of serum antibody titers and proteinuria following rapamycin.
NZB/W mice were monitored for serum dsDNA-specific IgG titers (a) and urine protein levels (b) over the indicated time frame. Protein scores were graded on a semiquantitative scale: 1, ≥30 mg/dl protein; 2, ≥100 mg/dl; 3, ≥300 mg/dl; and 4, ≥2,000 mg/dl. Twice weekly rapamycin (20 mg/kg) was administered i.v. from 29 to 33 weeks old age. Data represent means and are representative of 2 separate experiments each using 4 mice per group. Treatment windows are shown with gray rectangles.
Extended Data Figure 10.
Extended Data Figure 10.. Induced CHOP mutation in mature BM PCs.
Genomic DNA was prepared from sorted cells harvested from CHOPf/f;CD20-TAM-Cre adults that were fed tamoxifen-laced chow for 4 weeks and evaluated the following day (n=3). Sorted cell populations were mature BM PCs (CD138high Sca-1+ B220) and B (surface IgM+) and T (CD3+) cells that were then subjected to PCR to amplify the CHOP (top) or HIF1a locus. For gel source data, see Supplementary Figure 1.
Figure 1.
Figure 1.. Panx3 mutation ablates BM PCs.
(a) ELISA data for total IgG, IgM and IgA in adult Panx3+/+ and Panx3−/− sera. (b) Representative images and quantification of ELISPOT assays for IgG- and IgM-secreting BM and spleen cells from Panx3+/+ and Panx3−/− mice. (c) Viable BM PCs from Panx3+/+ and Panx3−/− adults. Left-most plot shows representative Dump/IgD gate where the Dump channel is antibodies to CD4, CD8, TER-119 and F4/80. Shown on right are means for BM CD138high Sca-1+ cells in the indicated mice. (d) Representative ELISPOT images and numbers of IgG-secreting BM cells from Panx3+/+ or Panx3−/− mice on day zero or after 4 days after culture with osteoblastic calvarial cells from Panx3+/+ or Panx3−/− mice. Data shown were combined from 2 experiments. (e) eATP in supernatants from sextuplicate cultures of induced osteoblastic cells from Panx3+/+ or Panx3−/− mice. (f) Representative ELISPOT images and numbers of IgG-secreting BM cells on day zero or after addition of 100 μM ATP, ADP or AMP for 48 hours before transfer to ELISPOT wells. For ELISPOT assays 106 total cells/well were added except for assays for IgM-secreting cells in (b) where 5×10⁴ cells/well were evaluated. n=6/grp for panels (a,c-f); *, p=0.0022. n=9/grp for panel (b); *, p<0.0001. All p values were derived from two-tailed Mann-Whitney tests, without any adjustment for multiple comparisons. All experiments were performed at least thrice except ELISPOT assays in (b) that were performed once for splenic IgG and IgM. All ELISPOT assays plated 1×10⁶ cells per well. All bar graphs are means.
Figure 2.
Figure 2.. P2rX4 is required for BM PCs.
(a) ELISA data for total IgG, IgM and IgA in sera from WT;Mb1-Cre and P2rX4f/f;Mb1-Cre adults. (b) BM PCs in WT;Mb1-Cre and P2rX4f/f;Mb1-Cre adults gated on Dump IgD cells as shown in Figure 1. (c) Representative images and quantification of ELISPOT wells for IgG-secreting and IgM-secreting BM and spleen cells from WT;Mb1-Cre and P2rX4f/f;Mb1-Cre mice. (d) Representative images and quantification of ELISPOT wells for IgG-secreting BM cells from the indicated mice cultured for two days with or without ATP addition before transfer to ELISPOT wells with additional ATP where indicated. (e-g) WT;CD20-TAM-Cre and P2rX4f/f;CD20-TAM-Cre mice were given tamoxifen-laced chow for 4 weeks before direct analysis (e, f) or immunization followed by analysis (g). (e) ELISA data for total IgG, IgM and IgA in sera from WT;CD20-TAM-Cre and P2rX4f/f;CD20-TAM-Cre adults immediately after tamoxifen delivery. (f) BM PCs gated as in Figure 1c from WT;CD20-TAM-Cre and P2rX4f/f;CD20-TAM-Cre adults fed tamoxifen-laced chow for 4 weeks beginning at 12 weeks of age. (g) WT;CD20-TAM-Cre and P2rX4f/f;CD20-TAM-Cre mice were fed tamoxifen for 4 weeks beginning at 5 weeks of age, then immunized with NP-KLH in alum. Shown are ELISPOT analyses for NP-specific PCs in spleen and BM on day 7 and 30 post-immunization, respectively. For ELISPOT assays 106 total cells/well were added except for assays for IgM-secreting cells in (c) where 5×10⁴ cells/well were evaluated. n=6/grp for panels (a,b,d-g); *, p=0.0022. n=9/grp for panel (c); *, p<0.0001. All p values were derived from two-tailed Mann-Whitney tests, without any adjustment for multiple comparisons. The experiments in panels (a, b, d-f) were performed at least thrice. The experiments in panel (c) were performed at least twice and the experiment in panel (g) was performed twice. All bar graphs are means.
Figure 3.
Figure 3.. P2rX4 inhibition causes loss of serum antibodies by depleting BM PCs.
(a) ELISPOT analyses for total IgG-secreting cells among B6 BM cells (106 cells/well) first cultured with or without 100 μM ATP and with or without 50 μM 5-BDBD or 50 μM A438079 versus DMSO alone for 2 days. (b) B6 adult females were given four injections of 5-BDBD (4.25 mg/kg) or DMSO i.v. (n=6/grp.) every 2 days and then analyzed on day 8. Dump IgD gate shown in Figure 1. (c) 5-BDBD depletes pre-established serum antibodies. B6 and Panx3−/− females were immunized with NP-KLH/alum. Sixty days later (“day 0”) mice were given DMSO (dotted line) or 5-BDBD (solid line) five times over 10 days (n=3/grp). Shown are optical density (OD) values for NP-binding serum IgG and IgM at each time point.(d-g) NZB/W females were given DMSO (dotted line) or 5-BDBD (solid line) at 29–33 weeks of age (gray rectangles). Shown are anti-dsDNA antibody titers (d), overall proteinuria (e) (see Methods for scoring), urine albumin (f), kidney pigmentation and histological images revealed with PAS staining (g). (d, e) n=6/grp; (f, g) n=3. (h, i) B6 adults previously given B6.H2-Ab1bm12 splenocytes (“day 0”) were given 5-BDBD (solid line) or DMSO (dotted line) (n=3/grp.) at 5–9 weeks post-cell transfer (gray rectangles) and monitored for dsDNA-specific serum IgG (h) and proteinuria (i). Means are shown for all graphs. For panels (a,b), *, p = 0.0022, with p values derived from two-tailed Mann-Whitney tests, without any adjustment for multiple comparisons. For (panels c-f, h, i) *, p < 0.05, **, p < 0.01, ***, p < 0.001., derived from a repeated measures ANOVA (see Methods). The experiments in panels (a-b) were performed at least thrice, and the experiments in panels (c-e) and (g-i) were performed twice.
Figure 4.
Figure 4.. P2rX4 inhibits ER-affiliated apoptosis in BM PCs.
Intracellular XBP1s (a) and ATF4 (b) expression for BM PCs 24 hours after treating mice once with 5-BDBD or DMSO alone (control) (n=6/grp.). (c,d) WT;CD20-TAM-Cre and CHOPf/f;CD20-TAM-Cre adults were fed tamoxifen-laced chow for 4 weeks before immunization with NP-KLH/alum. 4 weeks post-immunization cohorts were given 5-BDBD (4.25 mg/kg) or DMSO thrice i.v. for 7 days before analysis (n=6/grp.). Representative images (c) and quantification (d) of ELISPOT analyses of 106 total cells/well for total (left) and NP-specific BM PCs (right) in indicated mice. All bar graphs are means. Data in (d) are pooled from two experiments with a total of 6/grp. For panels (a,b,d), *, p = 0.0022, with p values derived from two-tailed Mann-Whitney tests without any adjustment for multiple comparisons. All experiments were performed at least twice.

References

    1. Radbruch A. et al. Competence and competition: the challenge of becoming a long-lived plasma cell. Nat Rev Immunol 6, 741–750 (2006). - PubMed
    1. Jarvis MF & Khakh BS ATP-gated P2X cation-channels. Neuropharmacology 56, 208–215 (2009). - PubMed
    1. Borges da Silva H. et al. The purinergic receptor P2RX7 directs metabolic fitness of long-lived memory CD8(+) T cells. Nature 559, 264–268 (2018). - PMC - PubMed
    1. Burnstock G. P2X ion channel receptors and inflammation. Purinergic Signal 12, 59–67 (2016). - PMC - PubMed
    1. Ishikawa M. et al. Pannexin 3 functions as an ER Ca(2+) channel, hemichannel, and gap junction to promote osteoblast differentiation. J Cell Biol 193, 1257–1274 (2011). - PMC - PubMed