. 2024 Feb;626(8001):1116-1124.
doi: 10.1038/s41586-024-07081-0. Epub 2024 Feb 14.

Autonomous transposons tune their sequences to ensure somatic suppression

Affiliations

Autonomous transposons tune their sequences to ensure somatic suppression

İbrahim Avşar Ilık et al. Nature. 2024 Feb.

Abstract

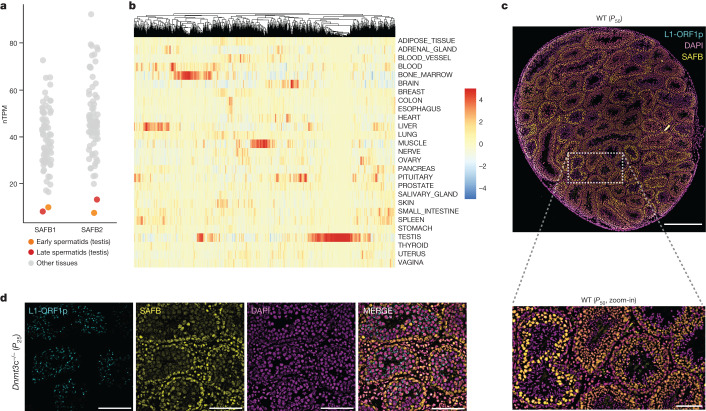
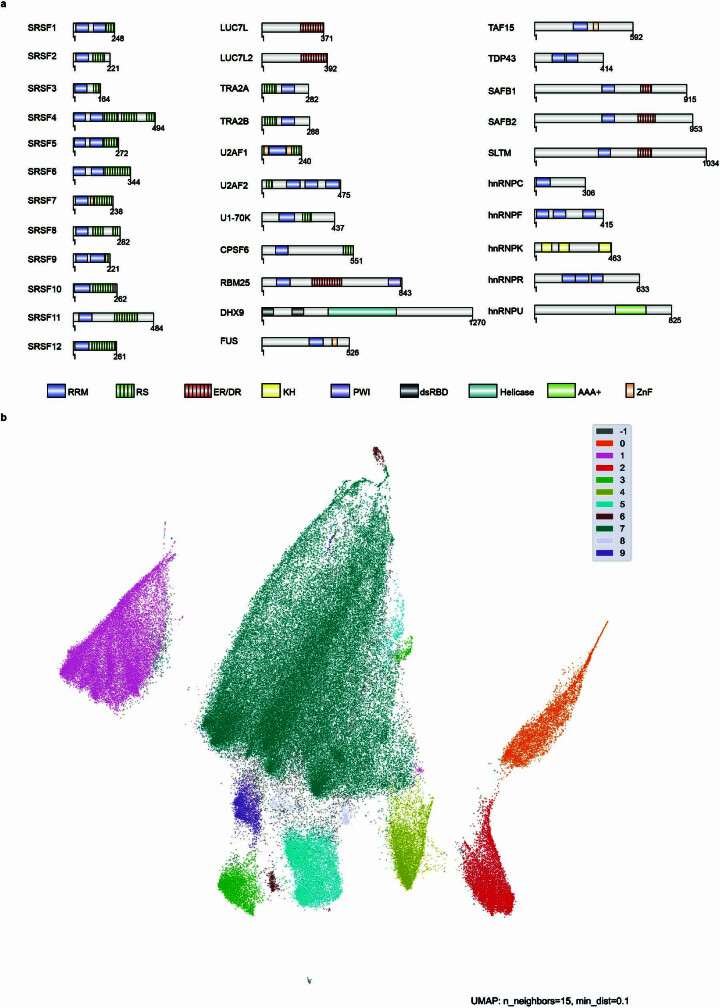
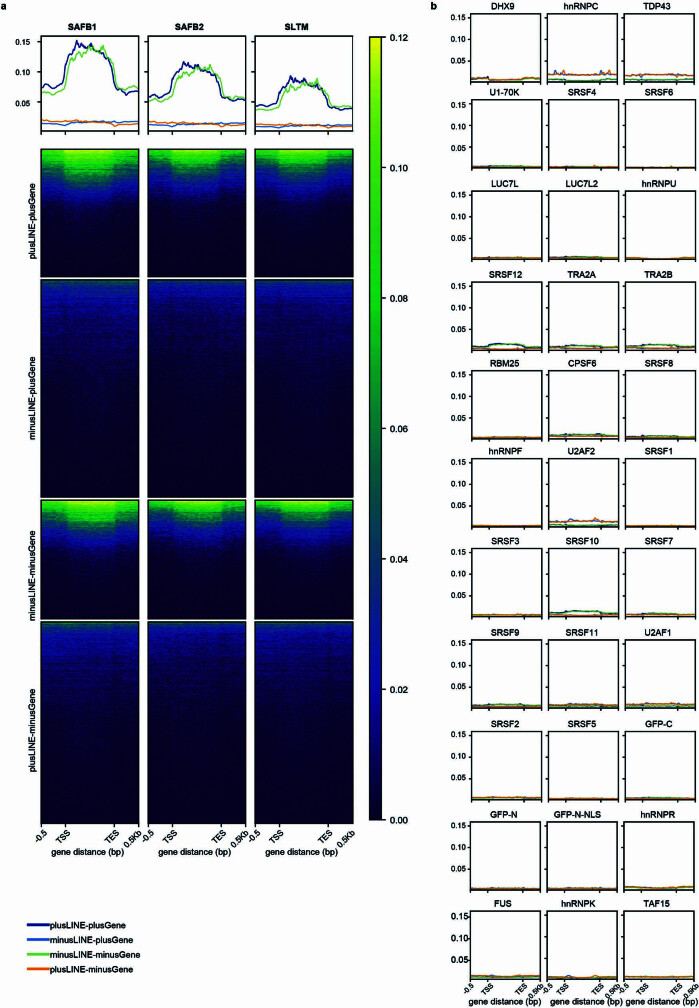
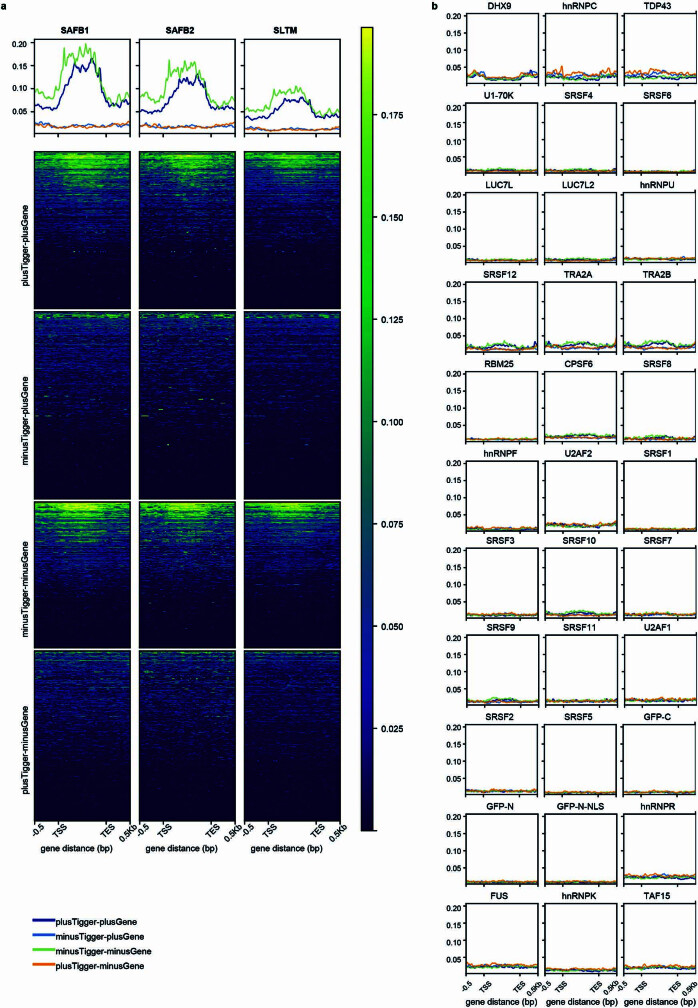
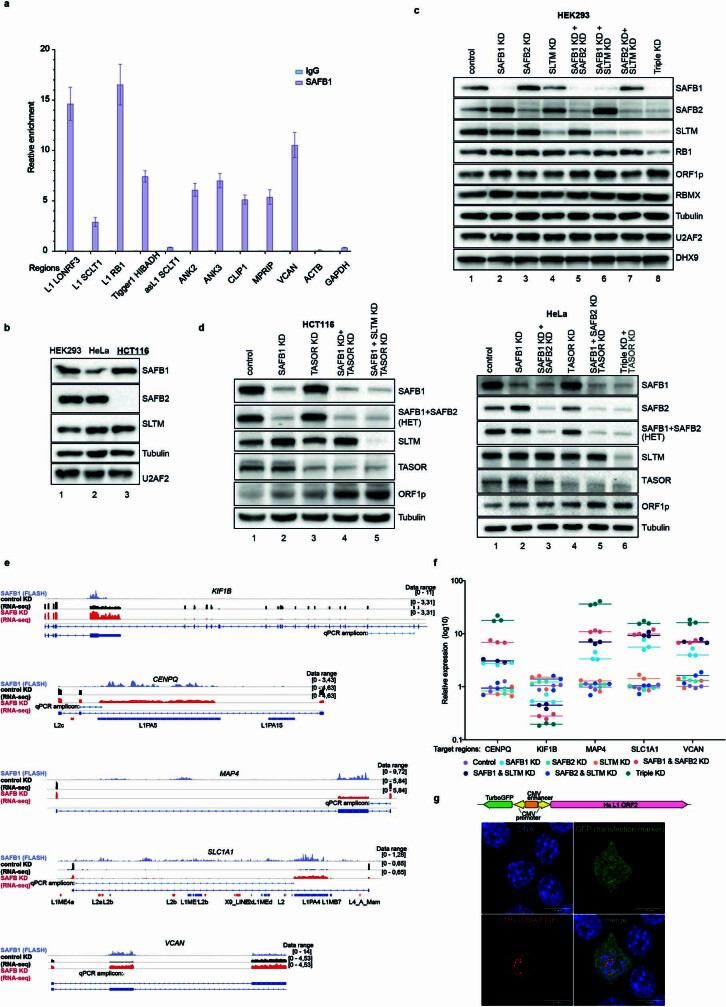
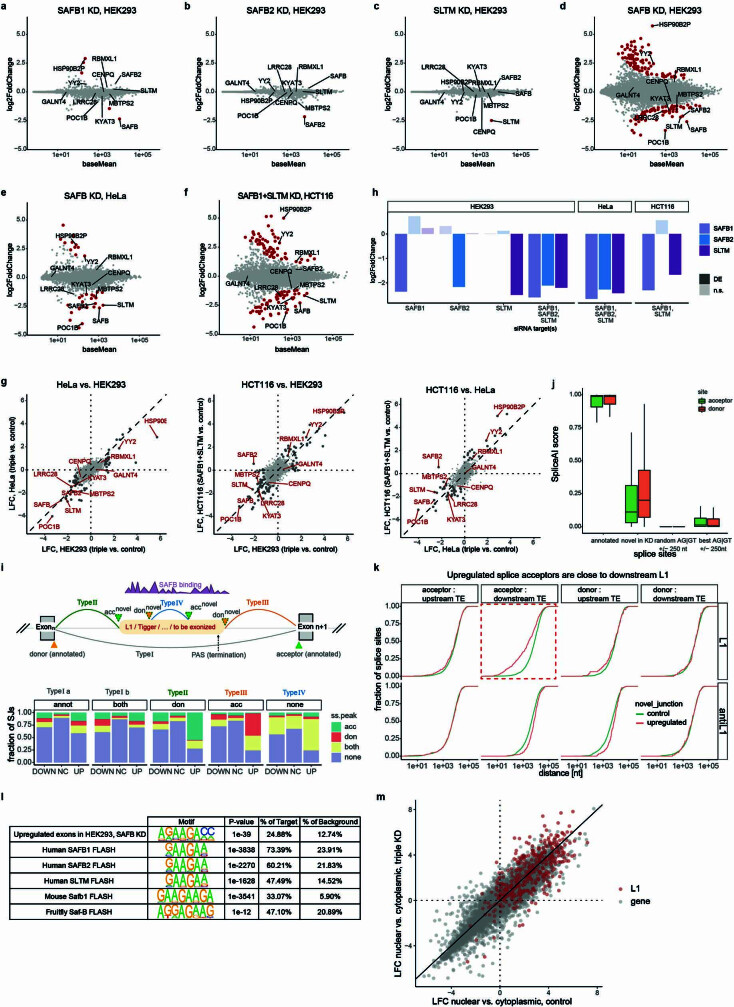
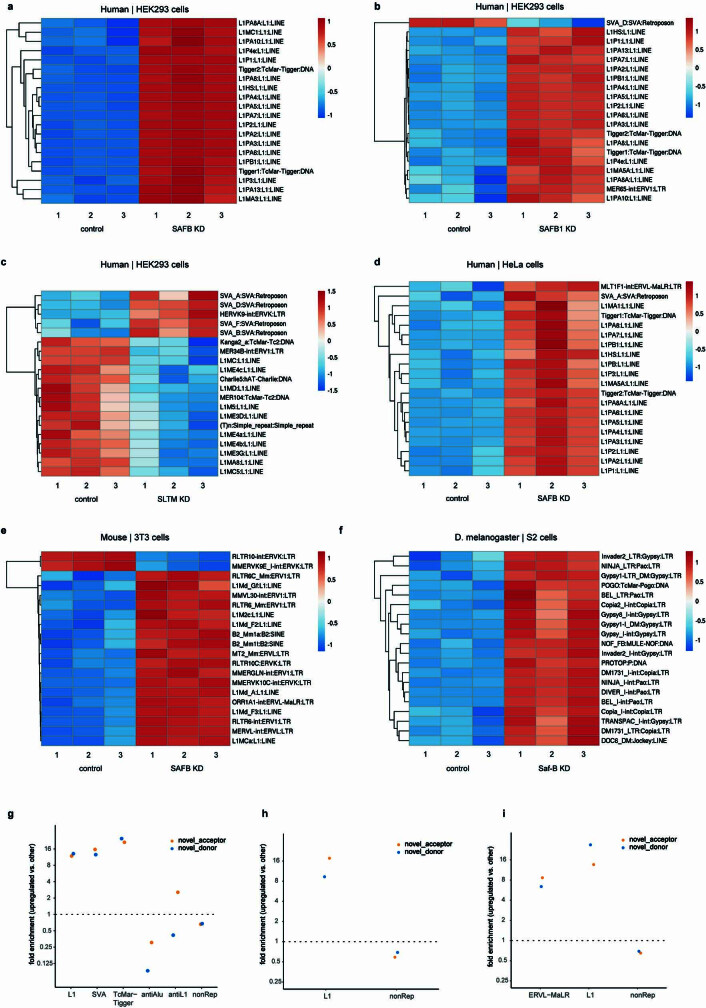
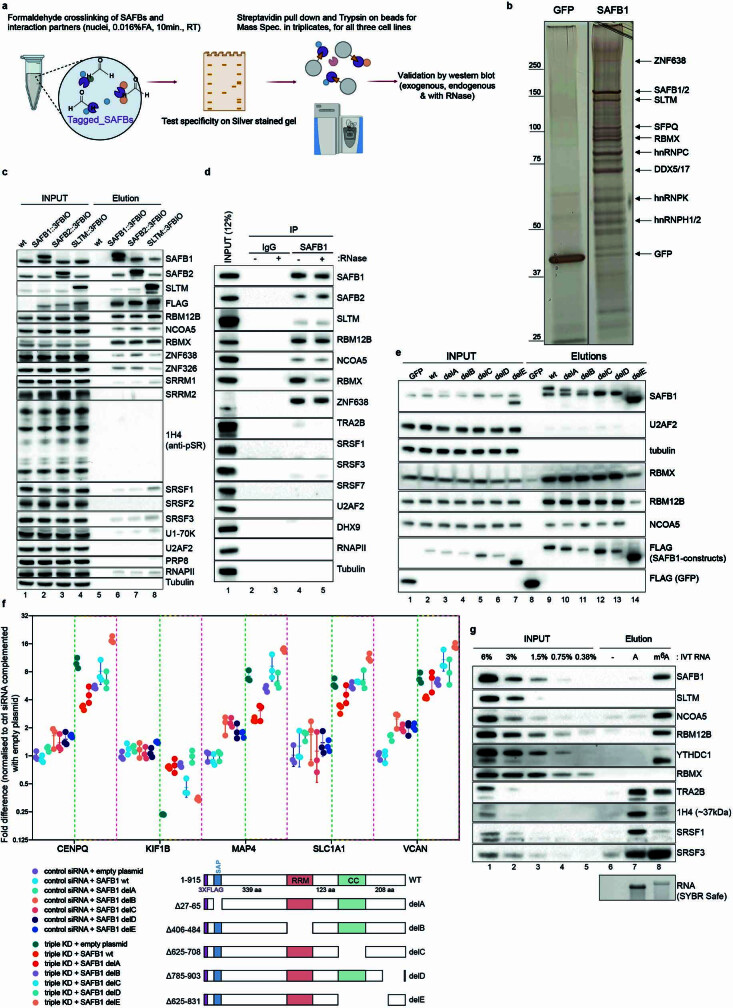
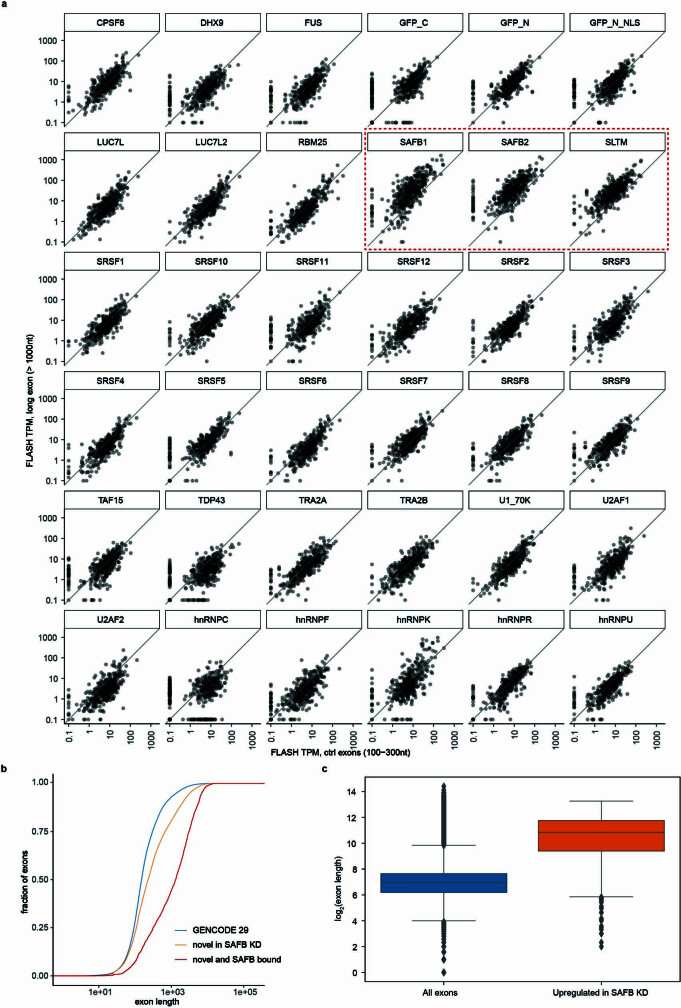
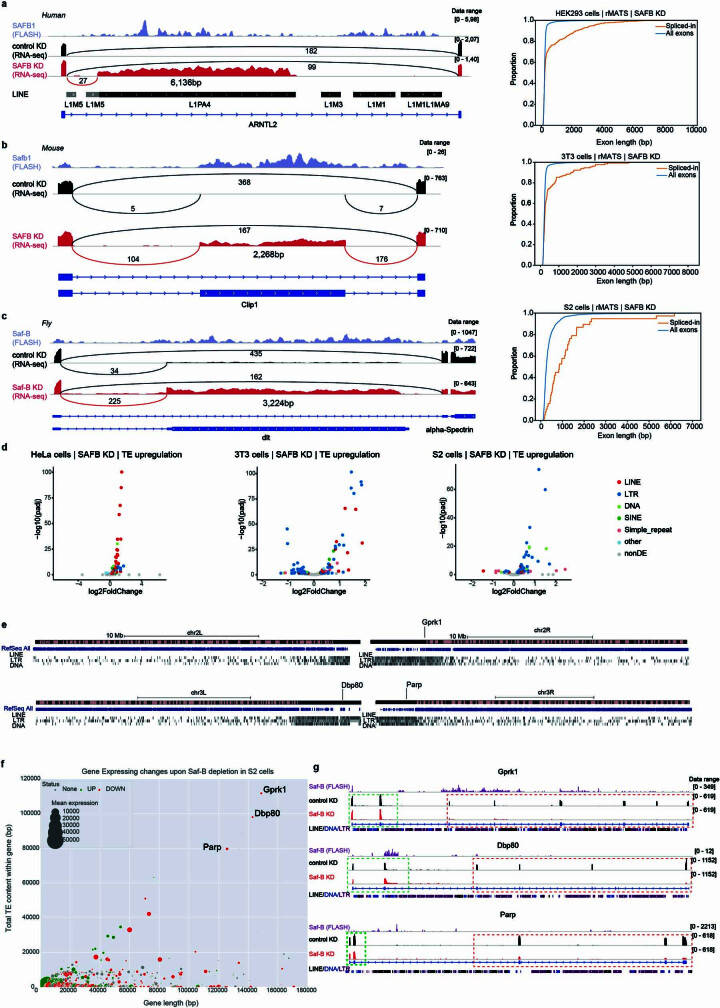
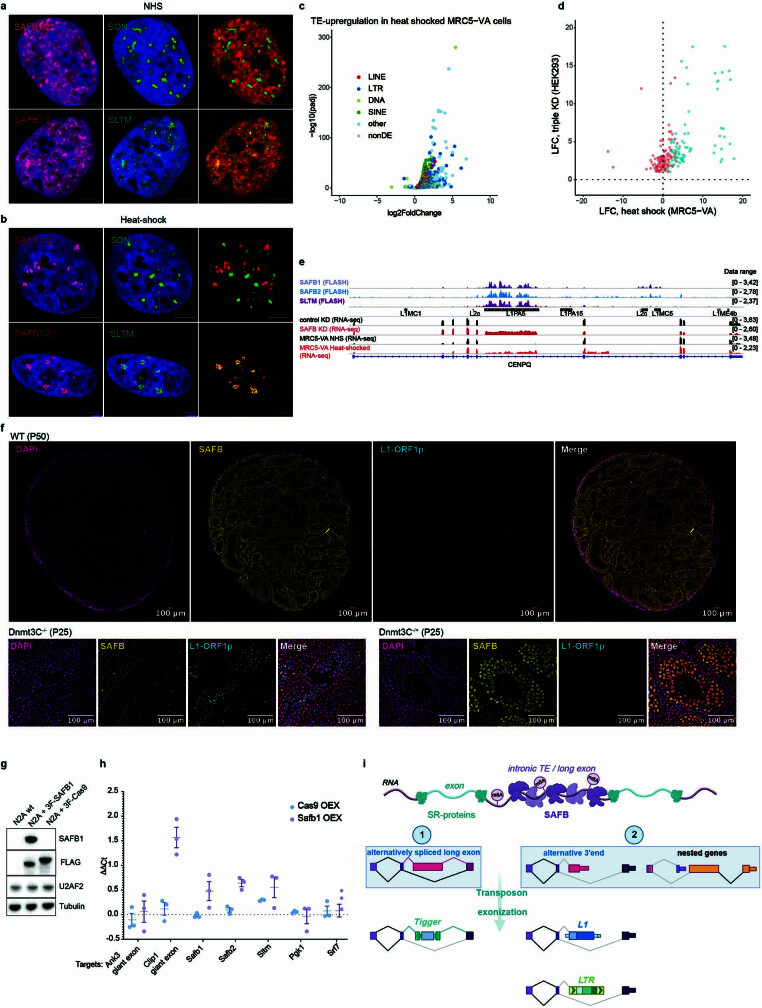
Transposable elements (TEs) are a major constituent of human genes, occupying approximately half of the intronic space. During pre-messenger RNA synthesis, intronic TEs are transcribed along with their host genes but rarely contribute to the final mRNA product because they are spliced out together with the intron and rapidly degraded. Paradoxically, TEs are an abundant source of RNA-processing signals through which they can create new introns1, and also functional2 or non-functional chimeric transcripts3. The rarity of these events implies the existence of a resilient splicing code that is able to suppress TE exonization without compromising host pre-mRNA processing. Here we show that SAFB proteins protect genome integrity by preventing retrotransposition of L1 elements while maintaining splicing integrity, via prevention of the exonization of previously integrated TEs. This unique dual role is possible because of L1's conserved adenosine-rich coding sequences that are bound by SAFB proteins. The suppressive activity of SAFB extends to tissue-specific, giant protein-coding cassette exons, nested genes and Tigger DNA transposons. Moreover, SAFB also suppresses LTR/ERV elements in species in which they are still active, such as mice and flies. A significant subset of splicing events suppressed by SAFB in somatic cells are activated in the testis, coinciding with low SAFB expression in postmeiotic spermatids. Reminiscent of the division of labour between innate and adaptive immune systems that fight external pathogens, our results uncover SAFB proteins as an RNA-based, pattern-guided, non-adaptive defence system against TEs in the soma, complementing the RNA-based, adaptive Piwi-interacting RNA pathway of the germline.


Conflict of interest statement

I.A.I. and T.A. are inventors on a patent application (no. EP3325621B1, European Patent Office) regarding the s-oligo design used in FLASH experiments. Z.D.S. is a cofounder and scientific advisor of Harbinger Health.

Figures

Fig. 1
Fig. 1. FLASH screen of 33 RBPs showing sequence and structure determinants of RNA–protein interactions.
UMAP representation of all FLASH data. Each dot represents a peak identified in one or more proteins profiled by FLASH (total number of peaks, 135,891). UTR, untranslated region.
Fig. 2
Fig. 2. SAFB proteins bind L1 elements and prevent their retrotransposition.
a, Integrated Genomics Viewer (IGV) snapshot of the gene DTL showing extensive binding of SAFB1, SAFB2 and SLTM to a 5,461 bp L1MA4 retrotransposon inserted on the same strand as the host gene. b, IGV snapshot of the gene FNTA showing extensive binding of SAFB1, SAFB2 and SLTM to a 2,307 bp Tigger1 DNA transposon inserted on the same strand as the host gene. c, Enrichment and depletion of TEs in SAFB peaks (n = 23,136) relative to all peak-hosting genes (n = 8,881). obs., observed; exp., expected. d, Length distribution of SAFB-bound L1 elements (orange, n = 28,734) compared with all intronic L1 elements (blue, n = 1,001,410). e, Luciferase-based L1 retrotransposition assay carried out in HeLa cells. The plasmid used for the assay is depicted above. L1 expression is driven by a pCAG promoter. Error bars show s.d. of six data points from two biological replicates carried out in technical triplicates (SAFB KD, simultaneous depletion of SAFB1, SAFB2 and SLTM). f, RNA–FISH in HCT116 cells in control versus SAFB depletion (SAFB KD, simultaneous depletion of SAFB1 and SLTM; HCT116 cells do not express SAFB2). Scale bar, 10 µm. g, Immunoblots showing the extent of wt-L1Hs and L1-ORFeus expression using ORF1p as a reporter in cells depleted of SAFB proteins and/or the HUSH complex. SAFB KD, simultaneous SAFB1 and SLTM depletion (HCT116 cells do not express SAFB2; Extended Data Fig. 4b); HUSH KD, TASOR and MPP8 depletion. h, RNA blot using a DIG-labelled probe against ORF2 in untransfected or wt-L1Hs-transfected (same construct as in Fig. 2g) HCT116 cells depleted of SAFB, HUSH or both, showing highest L1 expression in cells transfected with an L1Hs-transcribing plasmid that are depleted of both HUSH and SAFB proteins. Source Data
Fig. 3
Fig. 3. SAFBs intronize L1 and Tigger transposons to prevent them from acting as gene traps.
a,b, Differential expression of transposable elements (a) and genes (b) following concurrent loss of the three SAFB proteins in HEK293 cells. Non-DE, non-differentially expressed. c, Comparison of expression change in pre- and post-peak gene fragments in genes with exonized (red points, n = 878) and control SAFB peaks (green points, n = 1457). d, IGV snapshot of the gene CENPQ showing extensive binding of SAFB1, SAFB2 and SLTM to a 4,165-bp-long L1PA5 retrotransposon inserted on the same strand as the host gene (top three tracks). Bottom five tracks show RNA-seq coverage of HEK293 cells transfected with control siRNAs or siRNAs against SAFB1, SAFB2, SLTM or all three together (SAFB KD).
Fig. 4
Fig. 4. Competition between SAFB and SR proteins is steered by m6A modification.
a, Left, experimental setup of the FLASH experiment. HEK293 cells were transfected with either control (ctrl) siRNA or siRNAs against SAFB1, SAFB2 and SLTM and ultraviolet (UV) crosslinked. Lysates from these samples were then used to carry out FLASH experiments with an antibody against either p-SR proteins (mAb 1H4) or DHX9, which primarily interacts with inverted Alu repeats and therefore serves as a control. Right, analysis of p-SR FLASH data using intronic repetitive elements, showing robust enrichment of sense-L1 elements (L1) compared to antisense-L1 (a.s.) in SAFB-depleted cells, whereas DHX9 shows minimal changes on its preferred substrates (sense or antisense (a.s.) Alu elements). b, Left, Coomassie-stained acrylamide gel showing the purity of Halo-TRA2BRRM, Halo-SAFB1RRM and Halo used for EMSA. Middle, EMSA using Halo-TRA2BRRM (lanes 2–6), Halo-SAFBRRM (lanes 7–11) and Halo (lane 12) and short RNA probes (24 nt long) that are either completely methylated (bottom) or unmethylated (top). Right, visualization of proteins via OregonGreen that was covalently attached to the Halo moiety. Gel images shown here are representative of two replicates.
Fig. 5
Fig. 5. Evolutionarily conservation of SAFB function.
a, Expression of SAFB1 and SAFB2 in various human tissues (single-cell RNA-seq data from the Human Protein Atlas) shown as normalized transcripts per million (nTPM). b, Enrichment of splice junctions between annotated splice donors and intronic SAFB peaks in human tissues catalogued by the GTEx consortium (n = 1,104). c, Cryosection of a WT mouse testis (P50), costained with antibodies against Safb1 (yellow) and ORF1p (cyan) to show the differential expression of Safb1 at different stages of spermatogenesis. No specific signal for ORF1p was detected; see also Extended Data Fig. 10f, in which the channels are represented separately. Main image scale bar, 500 µm; magnified image scale bar, 100 µm. d, Cryosection of Dnmt3c−/− mouse testis costained with antibodies against Safb1 (yellow) and ORF1p (cyan), showing intense staining of ORF1p towards the lumen where Safb1 expression is low. Scale bars, 100 µm.
Extended Data Fig. 1
Extended Data Fig. 1. RNA-binding proteins profiled using FLASH.
a, Schematics showing the prominent domains of the 33 RBPs profiled using FLASH. Some RRM domains are likely to be quasi-RRM domains, for example the second RRM domain of SRSF1, and all three RRM domains of hnRNPF. b, Clusters identified on the UMAP projection of all FLASH data.
Extended Data Fig. 2
Extended Data Fig. 2. SAFB proteins bind to L1 elements only when they are inserted on the same strand as the host gene.
Cumulative coverage was calculated for all RBPs profiled for FLASH on all intronic L1 insertions +/− 500 bp on each side. Targets are split into four: i) genes on the plus strand, plus strand L1 insertions ii) genes on the plus strand, minus strand L1 insertions iii) genes on the minus strand, minus strand L1 insertions iv) genes on the minus strand, plus strand L1 insertions. a, SAFB1, SAFB2 and SLTM. b, other RBPs, only profiles are shown.
Extended Data Fig. 3
Extended Data Fig. 3. SAFB proteins bind to Tigger elements only when they are inserted on the same strand as the host gene.
Cumulative coverage was calculated for all RBPs profiled for FLASH on all intronic Tigger insertions +/− 500 bp on each side. Targets are split into four: i) genes on the plus strand, plus strand Tigger insertions ii) genes on the plus strand, minus strand Tigger insertions iii) genes on the minus strand, minus strand Tigger insertions iv) genes on the minus strand, plus strand Tigger insertions. a, SAFB1, SAFB2 and SLTM. b, other RBPs, only profiles are shown.
Extended Data Fig. 4
Extended Data Fig. 4. Validation of SAFB transcriptomic data.
a, RT-qPCR of RNA isolated from either SAFB1 immunoprecipitation of IgG control using 0.2% formaldehyde crosslinked HEK293 lysates. The plot shows the average of three replicates, error bars show SD of three replicates. Primers against transposons are designed to be unique to the locus, see Supplementary Table 1 for primer sequences. b, Immunoblots showing expression of SAFB1, SAFB2 and SLTM in HEK293, HeLa and HCT116 cells. c, Immunoblots showing protein levels of SAFB1, SAFB2 and SLTM in single, double and triple siRNA transfections. Note the increase in SAFB2 expression in SAFB1 siRNA transfected cells (lane 2 vs 1) and the increase in SAFB1 expression in SAFB2 siRNA transfected cells (lane 3 vs 1) Also see Supplementary Fig. 5c for the L1PA7 inclusion event that likely attenuates RB1 expression. d, Immunoblots showing increase in SLTM expression in SAFB1 depleted HCT116 cells which do not express SAFB2, and ORF1p expression is highest when HUSH complex and SAFB proteins are co-depleted (also see Fig. 2g,h). e, The amplicons used to interrogate the hierarchy of SAFB proteins on suppressing splicing events that are detected from RNA-seq data. f, Hierarchy of SAFB proteins in regulating splicing of select targets using depletion conditions shown in (c) and amplicons shown in (e). g, Specificity of the L1 RNA probe is shown with RNA FISH in mouse N2A cells transfected with an L1Hs sequence containing plasmid that also harbors a GFP as a transfection marker. Scale bar: 10 µm. Source Data
Extended Data Fig. 5
Extended Data Fig. 5. Gene expression changes and differential splicing in SAFB1, SAFB2, SLTM depleted cells.
MA plots showing gene expression changes upon. a, SAFB1 KD in HEK293 cells, b, SAFB2 KD in HEK293 cells, c, SLTM KD in HEK293 cells, d, SAFB1 + SAFB2 + SLTM (SAFB) KD in HEK293 cells, e, SAFB1 + SAFB2 + SLTM (SAFB) KD in HeLa cells. f, SAFB1 + SLTM (SAFB) KD in HCT116 cells. g, SAFB KD, HeLa vs HEK293 cells, HCT116 vs HEK293 and HCT116 vs HeLa cells. Only genes supported by on average 50 reads per library were plotted to avoid LFC-shrinking artefacts. h, Levels of each SAFB protein in each depletion for each cell line as detected in RNA-seq data. i, Top, schematic describing different categories of splice-junctions in SAFB depleted cells. Type Ia: both splice sites, as well as the splice-junction is annotated; Type Ib: both splice sites are annotated, but junction is novel, Type II: donor splice site is annotated, acceptor is novel; Type III: acceptor splice site is annotated, donor novel; Type IV: both splice acceptor and novel sites are novel. Bottom, fraction of downregulated (DOWN), unchanged (NC) and upregulated (UP) splice-junctions in SAFB depleted cells, split by categories described above. Green: acceptor site is within a SAFB peak, orange: donor site is within a SAFB peak, yellow: both acceptor and donor contained within a SAFB peak, purple: neither acceptor nor donor splice site overlaps with a SAFB peak. j, SpliceAI scores for splice donors and acceptors in annotated splice junctions (random sample, n = 1000), novel donors and acceptors in splice junctions upregulated in triple SAFB KD (DEXSeq, p < 0.05, LFC > 1; 295 acceptors and 142 donor), and control sets of random and best-scoring donor and acceptor dinucleotides in 500 nt windows around the novel sites. k, Empirical cumulative distribution function (ECDF) plot of the distance between splice site (acceptor or donor) to the nearest (upstream or downstream) L1 or anti-sense L1 transposon. Upregulated splice acceptor sites in SAFB depleted cells (orange) are closer to downstream L1 elements compared to control splice sites (green). l, The most significantly enriched sequence motif within upregulated exons in SAFB depleted cells, or in SAFB1, SAFB2, SLTM peaks obtained from data in humans as well as Safb1 and Saf-B FLASH data in mouse and fly cells. Data obtained using HOMER. m, Nuclear-to-cytoplasmic ratio of individual L1 elements (L1) and genes (gene) in control and SAFB-depleted HEK293 cells.
Extended Data Fig. 6
Extended Data Fig. 6. Differential Transposon expression in SAFB1, SAFB2, SLTM depleted cells.
Top 20 most significantly changing repetitive elements, as quantified by the snakePipes non-coding-RNA pipeline (no significant changes were seen in SAFB2-depleted cells). Complete DESeq2 output can be found in Supplementary Data Tables 4–14. Z-scores (calculated between replicates for each sample to show agreement between replicates) are shown for: a, SAFB1 + SAFB2 + SLTM (SAFB) KD in HEK293 cells, b, SAFB1 KD in HEK293 cells, c, SLTM KD in HEK293 cells, d, SAFB1 + SAFB2 + SLTM (SAFB) KD in HeLa cells, e, Safb1 + Safb2 + Sltm (SAFB) KD in 3T3 cells, f, Saf-B KD in S2 cells. Fold enrichment of novel splice sites detected in: g, SAFB-depleted HEK293 cells, h, SAFB-depleted HeLa cells. i, SAFB-depleted 3T3 cells.
Extended Data Fig. 7
Extended Data Fig. 7. Biochemical characterization of SAFB interacting proteins.
a, Scheme of biochemical purifications involving tagged (b,c,e) or endogenous SAFB (d) proteins. b, Silver-stained polyacrylamide gel showing the specificity of the purification for 3xFLAG-Bio-SAFB1. Proteins indicated on the left were determined by mass-spectrometry. c, Verification of the candidate co-interectors determined AP-mass-spectrometry experiments with 3xFLAG-Bio-SAFB1, 3xFLAG-Bio-SAFB2 and 3xFLAG-Bio-SLTM with immunoblotting. These are the same cell lines used for FLASH. Also see Supplementary Table 3 for the results of the MS analysis. d, Verification of the candidate co-interectors determined AP-mass-spectrometry using an antibody against endogenous SAFB1, with or without RNAse treatment to determine whether the interactions are RNA-bridged. e, Interaction of SAFB co-interactors with SAFB1 truncation mutants. See panel f, of this Extended Data Figure for the description of the deletions. f, (left) RT-qPCR results interrogating targets as described in Extended Data Fig. 4e with the description of the deletions (right). g, Interaction specificity of in-vitro transcribed m6A RNA towards SAFB1 and its interaction partners; NCOA5, RBM12B is shown with respect to known m6A reader YTHDC1 or SR/SR-like proteins; TRA2B, SRSF1, SRSF3 by using a nuclear lysate. Source Data
Extended Data Fig. 8
Extended Data Fig. 8. SAFB proteins bind to and suppress long exon splicing.
a, Scatterplots comparing FLASH coverage of all RBPs on average sized exons (100–300nt) on the x-axis, versus long exons (>1000nt) on the y-axis. SAFB1, SAFB2 and SLTM are highlighted. b, Empirical cumulative distribution function (ECDF) plot showing length of exons in GENCODE v.29, compared to novel exons detected in SAFB-depleted HEK293 cells. c, Boxplot showing length distribution of all exons, compared to exons that are upregulated in SAFB-depleted HEK293 cells, which includes novel and previously characterised exons.
Extended Data Fig. 9
Extended Data Fig. 9. Genes at the pericentromeric heterochromatin with high TE content are vulnerable to Saf-B depletion in flies.
a, Left, IGV snapshot of the human gene ARNTL2, with SAFB1 binding and RNA-seq data in control vs SAFB-depleted cells. Lines connecting adjacent exons depict splice-junctions, provided together with the number of reads supporting a given junction. Right, ECDF plot of exon lengths, orange line: exons that spliced-in upon SAFB-depletion, blue line: all exons. b, Left, IGV snapshot of the mouse gene Clip1, with Safb1 binding and RNA-seq data in control vs SAFB-depleted cells. Lines connecting adjacent exons depict splice-junctions, provided together with the number of reads supporting a given junction. Right, ECDF plot of exon lengths, orange line: exons that spliced-in upon SAFB-depletion, blue line: all exons. c, Left, IGV snapshot of the fly same-strand nested pair dlt and alpha-Spectrin, with Saf-B binding and RNA-seq data in control vs Saf-B-depleted cells. Lines connecting adjacent exons depict splice-junctions, provided together with the number of reads supporting a given junction. Right, ECDF plot of exon lengths, orange line: exons that spliced-in upon SAFB-depletion, blue line: all exons. d, Differential expression of transposable elements in human (HeLa, also see Fig. 3a for HEK293 cells), mouse (3T3) and fly (S2) cells. e, Four chromosome arms, 2 L, 2 R, 3 L and 3 R, depicted with genes (blue boxes) as well as transposons (black boxes, separated by class), showing enrichment of the latter at pericentromeric heterochromatin where left and right arms of the chromosome are physically connected. Positions of the genes-of-interest, Gprk1, Parp and Dpb80 are highlighted. f, Scatter plot showing the size (x-axis) vs total transposon contents (y-axis) of all genes in D. melanogaster in base-pairs (the plot is restricted to 180.000 bp on the x-axis). The size of the dots indicates relative gene expression in S2 cells, while the color show if the genes are differentially expressed or not upon Saf-B depletion. g, IGV snapshot showing FLASH coverage of Saf-B, as well as RNA-seq coverage in control vs Saf-B dsRNA treated S2 cells. Green boxes highlight the initial 2 exons of each gene with little to no changes in expression, while red boxes highlight downstream exons which are significantly downregulated, reminiscent of phenotypes observed in mammalian cells (see Fig. 3).
Extended Data Fig. 10
Extended Data Fig. 10. Heat-shock sequesters SAFB proteins at nuclear stress bodies (nSB) and SAFB expression correlates with L1-ORF1p in testis tissue or giant exon exclusion in N2A cells.
SAFB1/2 (HET), SON and SLTM stainings in controls (NHS) vs cells incubated at 42 °C for 90 min (Heat-shock) depicting co-localization of SAFB1/2 and SLTM before, and more clearly after heat-shock at nSBs. SON, a core component of nuclear speckles where splicing factors accumulate, does not overlap with SAFB1/2 under normal conditions (a), and forms nuclear bodies that are completely separate from nSBs after heat-shock (b). a, Stainings under normal conditions (HEK293 cells). b, Stainings after heat-shock conditions (HEK293 cells). c, Volcano plot showing changes in repetitive element expression in heat-shocked MRC5-VA cells. d, Scatter plot showing splice sites that are upregulated in HEK293 cells upon SAFB-depletion (log-fold change against control treatment on the y-axis), compared to changes in heat-shocked MRC5-VA cells (log-fold change against NHS on the y-axis). e, IGV snapshots showing FLASH coverage of SAFB1, SAFB2 and SLTM, as well as RNA-seq coverage in control or SAFB1 + SAFB2 + SLTM (SAFB) siRNA treated HEK293 cells, together with normal (NHS) and heat-shocked MRC5-VA cells on CENPQ gene (also see Fig. 3). f, (left) Cryo-section of a wild-type (P50) testis, co-stained with antibodies against Safb1 (yellow) and ORF1p (cyan) to reveal the differential expression of Safb1 in different stages of spermatogenesis. No specific signal for ORF1p is detected, Scale bar=500 µm. This figure is the same as in Fig. 5g, channels are separated for better visibility. (right) Cryo-section of the Dnmt3c-/- and Dnmt3c-/+ mice co-stained with antibodies against Safb1 (yellow) and ORF1p (cyan) showing intense staining of ORF1p towards the lumen where Safb1 expression is low. Scale bar=100 µm. g, Immunoblot showing expression of 3xFLAG-SAFB1 or 3xFLAG-Cas9 in mouse N2A cells. Wild-type N2A cells are used as a control. h, RT-qPCR experiment interrogating the effect of 3xFLAG-SAFB1 overexpression to the splicing of Ank3 and Clip1’s giant cassette exons. Error bars depict the SD of three replicates. i, Model summarising the findings of this work. SAFB proteins bind to long, adenine-rich RNAs that are likely enriched with m6A modification (top). These characteristics are enriched in autonomous transposons such as L1 elements in humans and mice, but also in other diverse TEs such as Tigger DNA transposons and LTR elements. Similar molecular patterns apparently allow for regulation of giant cassette exons as well as nested genes, pseudogenes and retro-genes. In this model, we categorise the splicing changes upon SAFB depletion into two: (1) cassette exons, where either a coding exon, such as ANK3/Ank3, CLIP1/Clip1 or a TE fragment utilises both an splice-acceptor and and a splice-donor site for exonization or (2) where a splice-acceptor and a polyadenylation site is utilised to generate alternatively spliced 3’-ends, such as KIF1B, KIF16B, which is molecularly similar to nested-genes in Drosophila, as well as L1 and LTR elements that act as gene-traps and form chimeric transcripts with the host mRNA, causing early termination. Source Data

Similar articles

Cited by

References

    1. Huff JT, Zilberman D, Roy SW. Mechanism for DNA transposons to generate introns on genomic scales. Nature. 2016;538:533–536. doi: 10.1038/nature20110. - DOI - PMC - PubMed
    1. Cosby RL, et al. Recurrent evolution of vertebrate transcription factors by transposase capture. Science. 2021;371:eabc6405. doi: 10.1126/science.abc6405. - DOI - PMC - PubMed
    1. Clayton EA, et al. An atlas of transposable element-derived alternative splicing in cancer. Philos. Trans. R. Soc. Lond. B Biol. Sci. 2020;375:20190342. doi: 10.1098/rstb.2019.0342. - DOI - PMC - PubMed
    1. Zimmerly S, Semper C. Evolution of group II introns. Mob. DNA. 2015;6:7. doi: 10.1186/s13100-015-0037-5. - DOI - PMC - PubMed
    1. Babakhani S, Oloomi M. Transposons: the agents of antibiotic resistance in bacteria. J. Basic Microbiol. 2018;58:905–917. doi: 10.1002/jobm.201800204. - DOI - PubMed

MeSH terms