. 2024 Mar;627(8002):174-181.
doi: 10.1038/s41586-024-07084-x. Epub 2024 Feb 14.

Visuo-frontal interactions during social learning in freely moving macaques

Affiliations

Visuo-frontal interactions during social learning in freely moving macaques

Melissa Franch et al. Nature. 2024 Mar.

Erratum in

Abstract

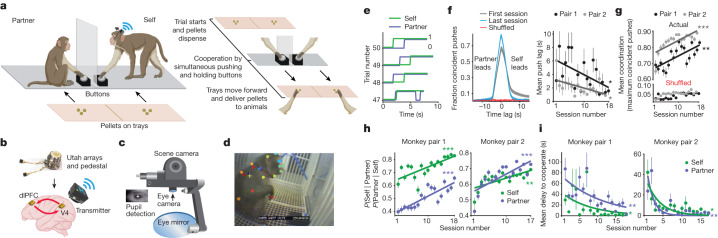
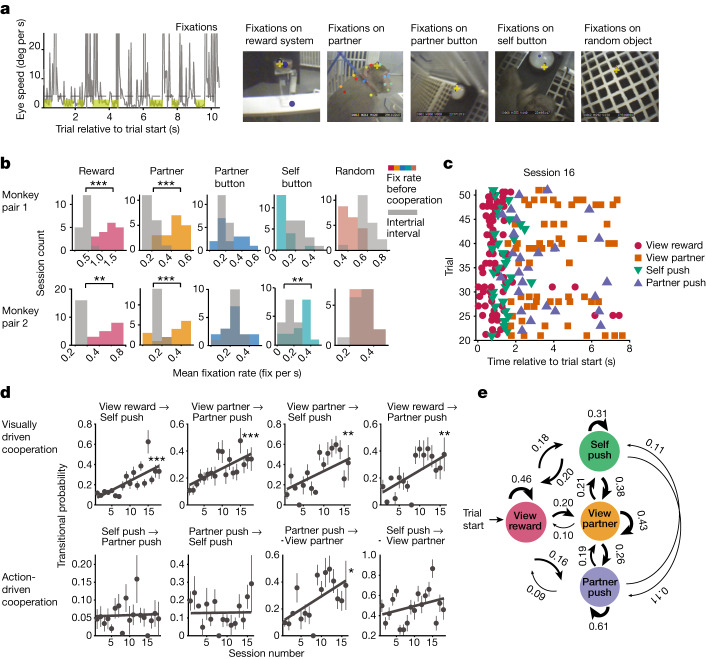
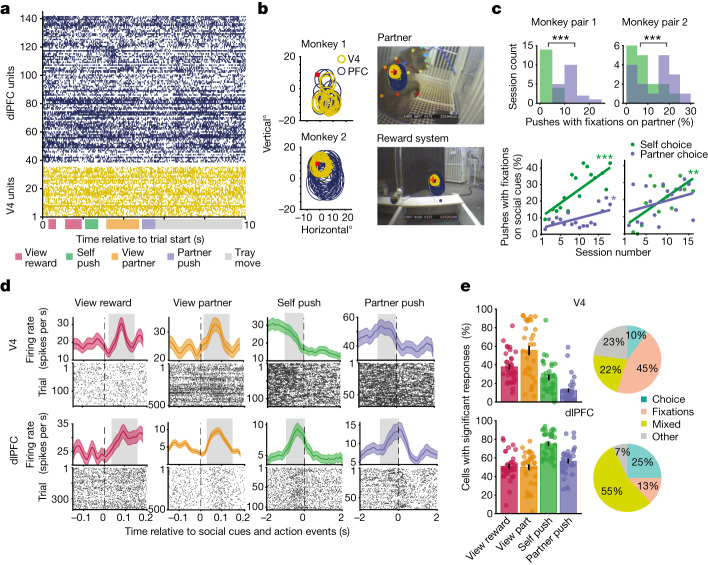
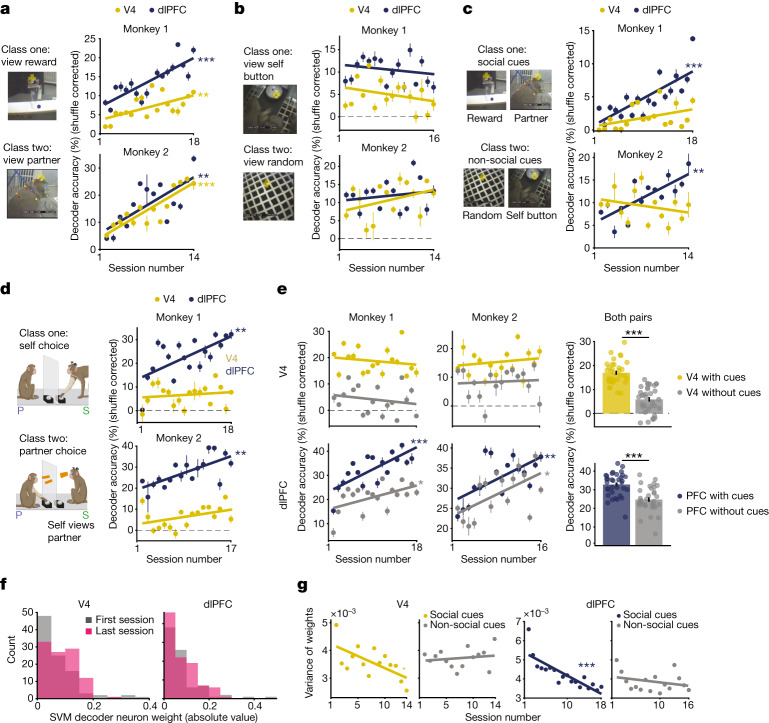
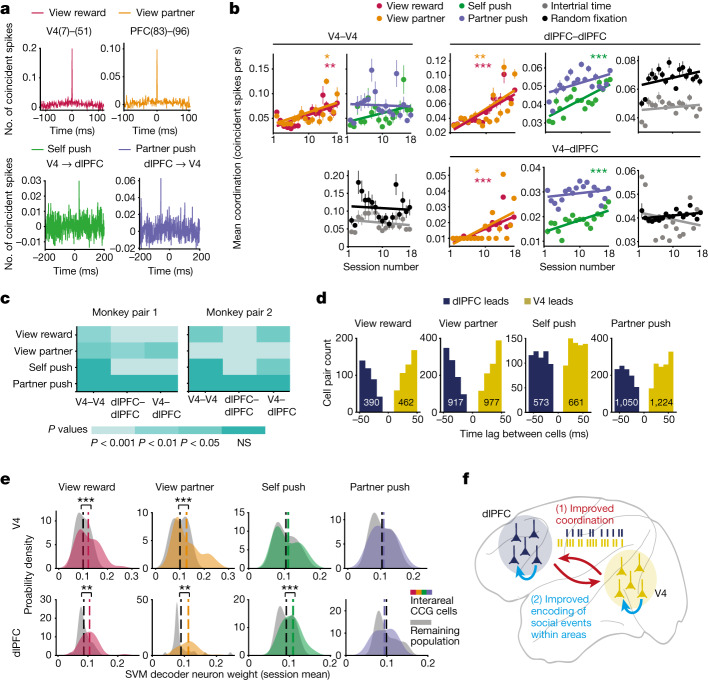
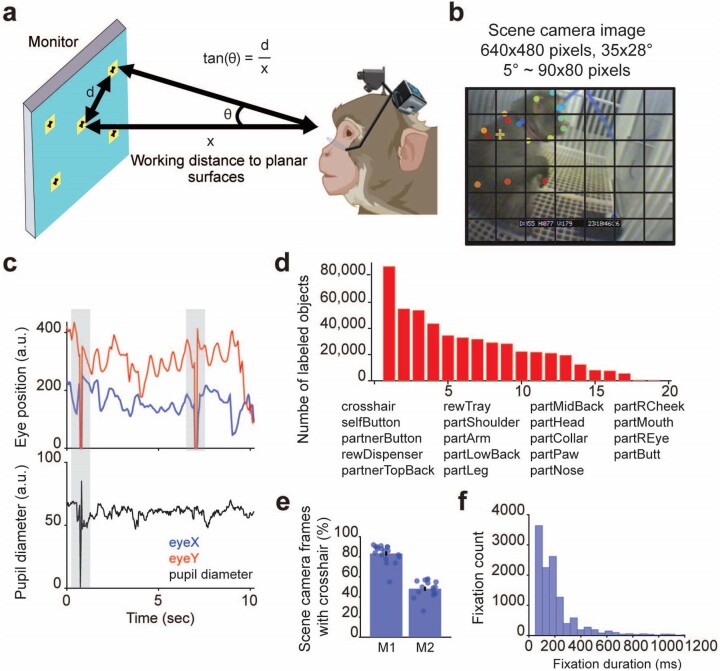
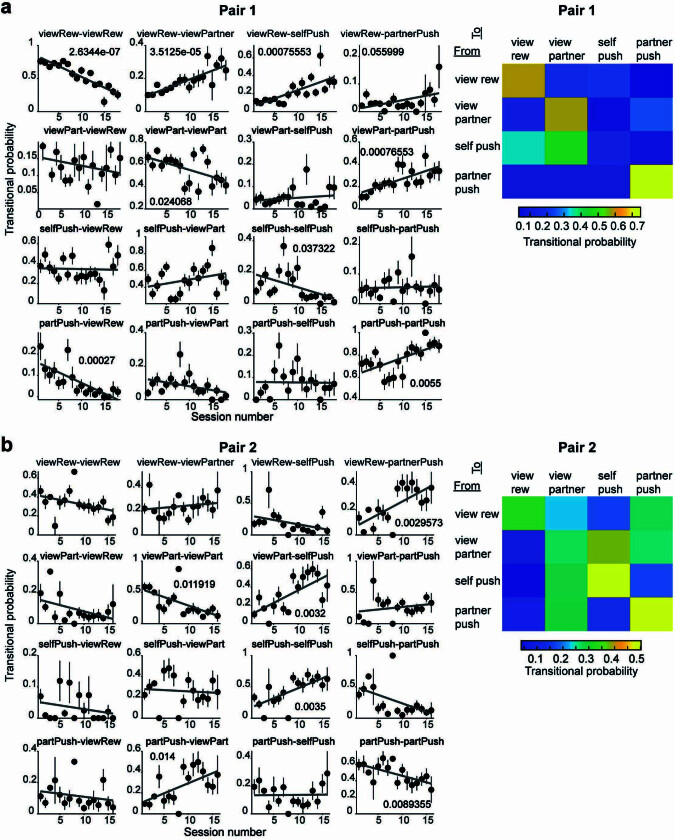
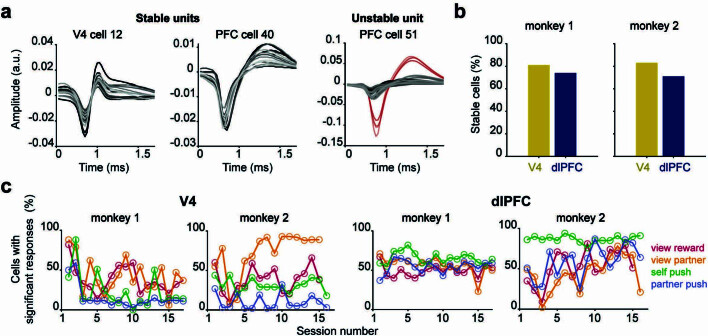
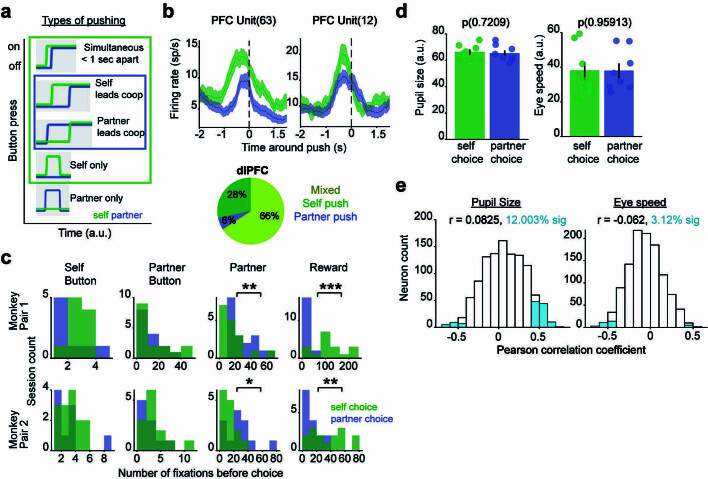
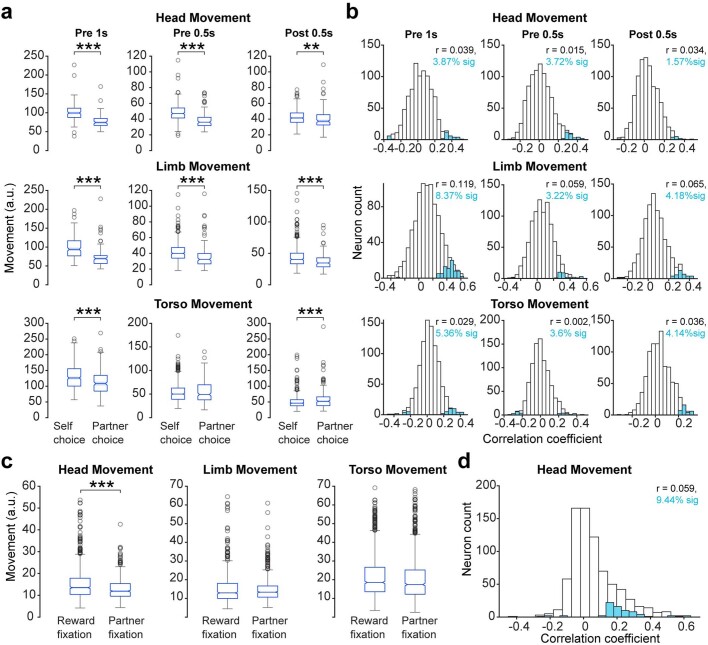
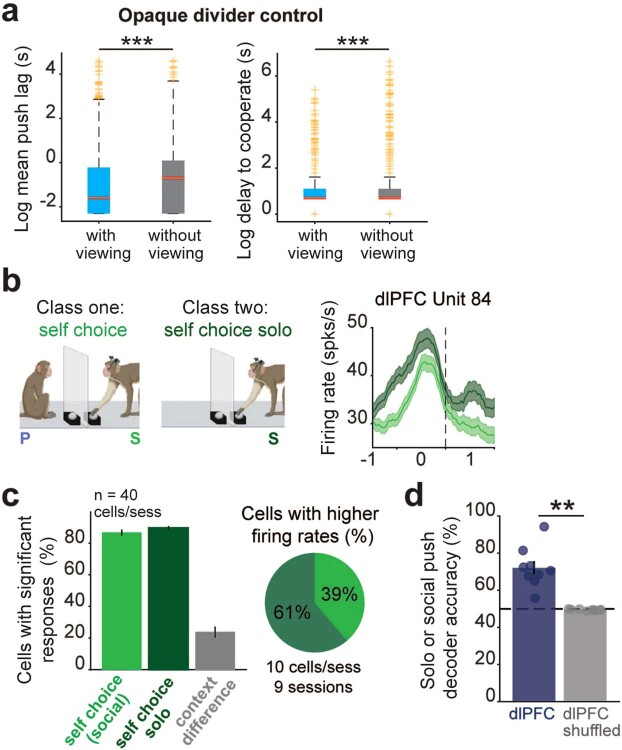
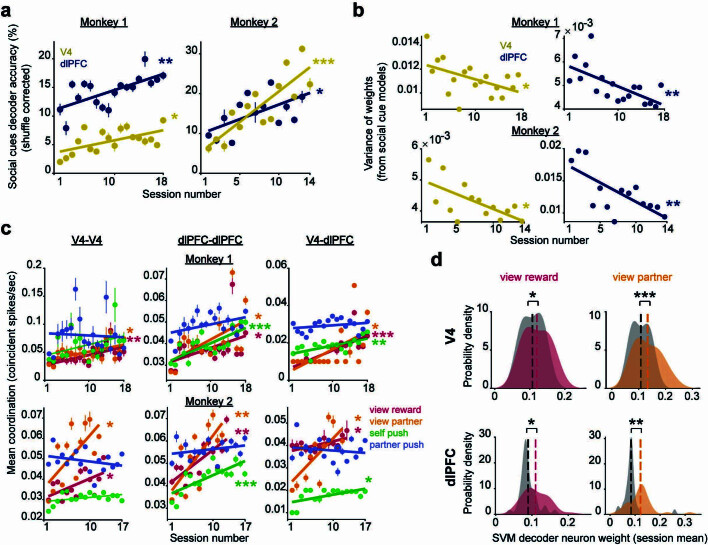
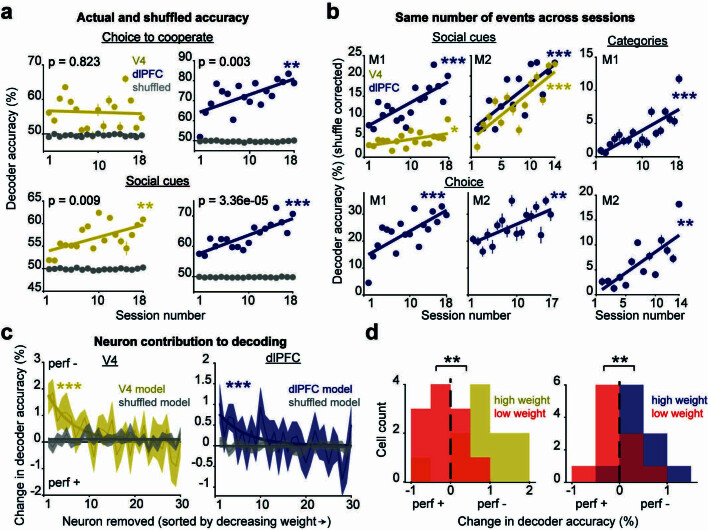
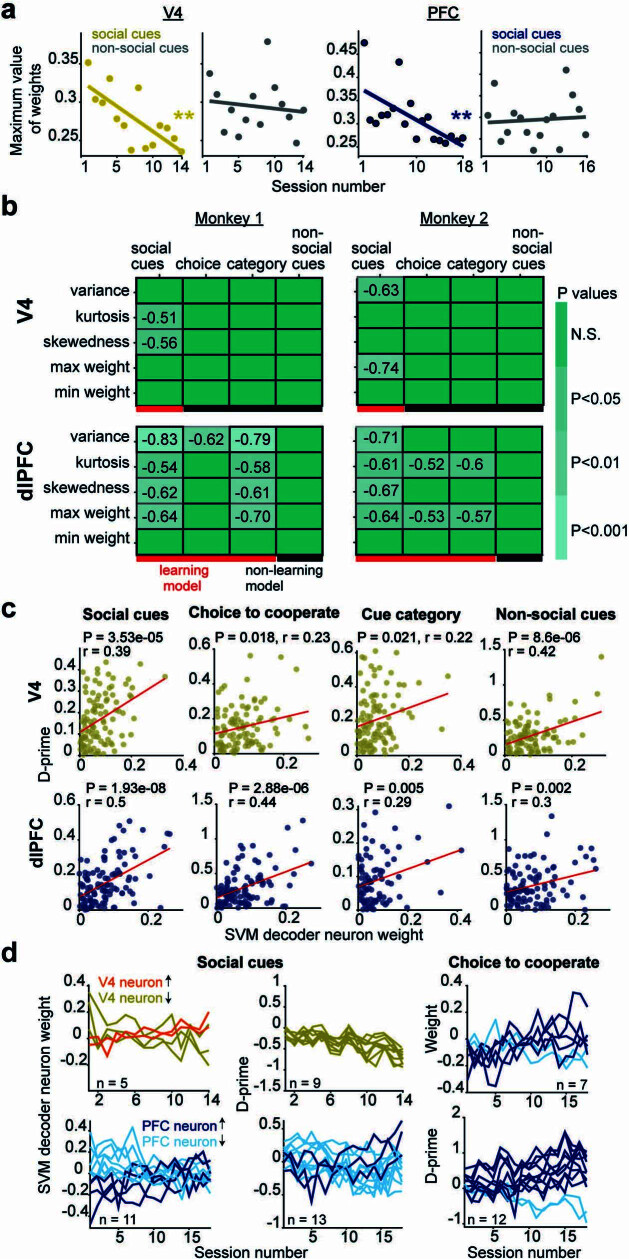
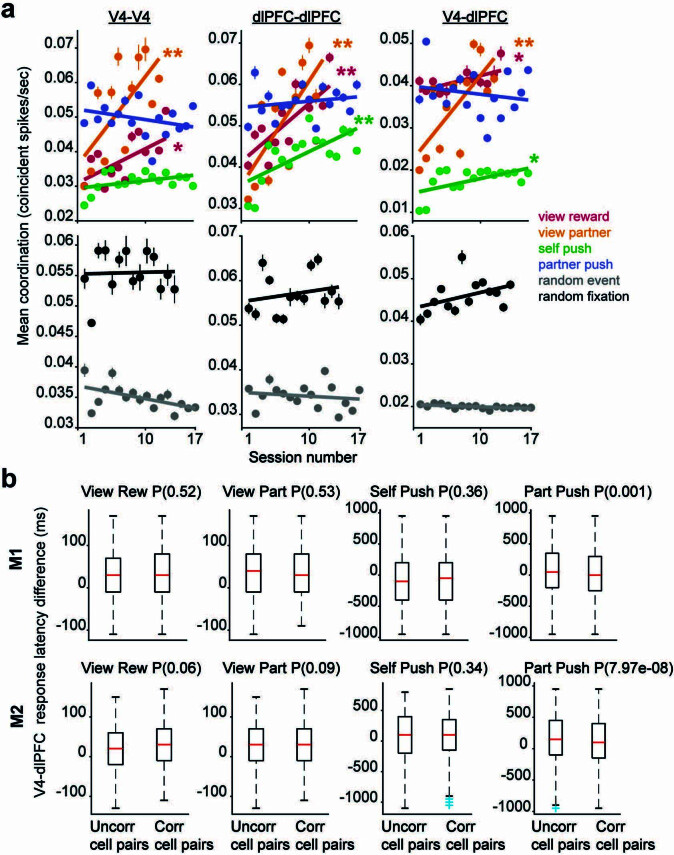
Social interactions represent a ubiquitous aspect of our everyday life that we acquire by interpreting and responding to visual cues from conspecifics1. However, despite the general acceptance of this view, how visual information is used to guide the decision to cooperate is unknown. Here, we wirelessly recorded the spiking activity of populations of neurons in the visual and prefrontal cortex in conjunction with wireless recordings of oculomotor events while freely moving macaques engaged in social cooperation. As animals learned to cooperate, visual and executive areas refined the representation of social variables, such as the conspecific or reward, by distributing socially relevant information among neurons in each area. Decoding population activity showed that viewing social cues influences the decision to cooperate. Learning social events increased coordinated spiking between visual and prefrontal cortical neurons, which was associated with improved accuracy of neural populations to encode social cues and the decision to cooperate. These results indicate that the visual-frontal cortical network prioritizes relevant sensory information to facilitate learning social interactions while freely moving macaques interact in a naturalistic environment.


Conflict of interest statement

The authors declare no competing interests.

Figures

Fig. 1
Fig. 1. Tracking of behavioural, oculomotor and neural events during learning cooperation.
a, Behavioural task. Two animals learned to cooperate for food reward. Left, cooperation paradigm. Right, trial structure. b, Wireless neural recording equipment (Blackrock Neurotech). Red arrows represent information processing between areas. c, Wireless eye tracker and components. d, DeepLabCut labelling of partner-monkey and buttons from the eye tracker’s scene camera. The yellow cross represents self-monkey’s point of gaze. e, Example voltage traces of each animal’s button-push activity from pair 1. A line increase to 1 indicates the monkey began pushing. f, Left, example CCGs of pair 1’s button pushes from the first and last session, using actual and shuffled data. Self-monkey leads cooperation more often in early sessions, as the peak occurs at positive time lag (2 s). Right, session average time lag between pushes when maximum coincident pushes occur. Pair 1: P = 0.03 and r = −0.5; pair 2: P = 0.02 and r = −0.5. g, Push coordination. Session average maximum number of coincident pushes (that is, peaks) from CCGs. Pair 1: P = 0.001 and r = 0.7; pair 2 P = 0.008 and r = 0.7. h, Session average conditional probability to cooperate for each monkey. Pair 1: P = 0.0004, r = 0.7 and P = 6.02 × 106, r = 0.8; pair 2: P = 0.001, r = 0.7 and P = 0.0004 and r = 0.8, self and partner, respectively. i, Session average delay to cooperate or response time for each monkey. Pair 1: P = 0.01, r = −0.6 and P = 0.001, r = −0.6; pair 2: P = 0.01, r = −0.6 and P = 0.006, r = −0.6, self and partner, respectively. All P values are from linear regression, and r is Pearson correlation coefficient. On all plots, circles represent the mean, with error bars s.e.m. *P < 0.05, **P < 0.01, ***P < 0.001. Illustrations in a and b were created using BioRender.
Fig. 2
Fig. 2. Interactions between action and viewing while learning to cooperate.
a, Identifying fixations on various objects. Left, during fixations (highlighted in yellow), eye speed remained below threshold (dashed line) for at least 100 ms. Right, scene camera images of objects the animal viewed, labelled with DeepLabCut (coloured dots). The yellow cross represents self-monkey’s point of gaze. b, Histograms of session mean fixation rates for each object computed during the trial (before cooperation) and intertrial interval. Asterisks represent significance of Wilcoxon signed-rank test only where fixations rates were higher during cooperation compared to intertrial period. Pair 1: P = 0.0002, 0.0002, 0.13, 0.002 and 0.0002; pair 2: P = 0.005, 0.0004, 0.95, 0.001 and 0.7 for fixation rates on objects listed left to right. c, Sequence of action and viewing events occurring during cooperation across a random subset of trials in a session. d, Markov model transitional probabilities for example event pairs that begin with a viewing (top row) or action event (bottom row). Top row: P = 0.0008, P = 0.0008, P = 0.003, P = 0.003 and all r = 0.7; bottom row: P = 0.84, 0.9, 0.01 and 0.2; r = 0.6 (‘partner-push’ to ‘view partner’); from left to right, linear regression and Pearson correlation. Two plots on each row came from each monkey pair. Mean transitional probability with s.e.m. is plotted. For complete transitional probability matrices for each monkey, see Extended Data Fig. 2. e, Hidden Markov model transitional probabilities averaged across both monkey pairs for all event pairs. *P < 0.05, **P < 0.01, ***P < 0.001.
Fig. 3
Fig. 3. V4 and dlPFC cell responses to social events.
a, Raster plot of spiking activity from M1’s V4 units 1–35 and dlPFC units 36–140 during one trial. b, Social cues within neurons’ receptive fields. Left, overlapping receptive fields of V4 and dlPFC neurons. V4 receptive field sizes, 4–6°; dlPFC receptive field sizes, 6–13°. The red square represents the point of fixation. Right, scene camera images measuring 35 × 28° (length × height), for which social cues were within receptive fields during fixation. c, Self- and partner-choice to cooperate. Top, percentage of pushes for which fixations on the partner occurred within 1,000 ms of choice in each session. Pair 1, P = 1.91 × 104; pair 2, P = 2.44 × 104; Wilcoxon signed-rank test. Bottom, percentage of pushes for which fixations on the partner and/or reward system occurred within 1,000 ms of choice in each session. Pair 1, P = 0.0004, r = 0.7 and P = 0.03, r = 0.5; pair 2, P = 0.002, r = 0.7 and P = 0.2, r = 0.3; self and partner-choice, respectively; linear regression and Pearson correlation. d, Peri-event time histogram and raster examples of four distinct V4 and dlPFC cells responding to each social event. Dashed lines represent event onset, and the grey shaded box represents the response period used in analyses. e, Significant responses. Left, percentage of cells of the total recorded (M1, 34 V4 cells and 102 dlPFC cells; M2, 104 V4 cells and 46 dlPFC cells) that exhibited a significant change in firing rate from baseline (intertrial period) during social events, averaged across sessions and monkeys. For each cell, P < 0.01, Wilcoxon signed-rank test with FDR correction. Right, percentage of neurons of the total recorded that responded only to choice (self and/or partner), only to fixations (reward and/or partner), both fixations and choice (‘mixed’) or none at all (‘other’). *P < 0.05, **P < 0.01, ***P < 0.001.
Fig. 4
Fig. 4. Population encoding of social events.
a, Decoding accuracy for fixations on reward system and partner-monkey. Chance is 50%, or 0% shuffle-corrected (dashed lines). Plots display shuffle-corrected mean prediction accuracy on test observations (±s.e.m.). M1, P = 0.006, r = 0.6 and 2.31 × 105, r = 0.8; M2, P = 3.01 × 105, r = 0.9 and P = 0.004, r = 0.7, V4 and dlPFC, respectively. All P values in ae and g are from linear regression; r is Pearson correlation coefficient. b, Decoding performance for fixations on two non-social objects. M1, P = 0.26 and 0.41; M2, P = 0.18 and 0.52, V4 and dlPFC, respectively. c, Decoding performance for object categories: fixations on social and non-social cues. M1, P = 0.08 and P = 0.0001, r = 0.8; M2, P = 0.3 and P = 0.001, r = 0.8, V4 and dlPFC, respectively. d, Decoding performance for each animal’s choice to cooperate. M1, P = 0.54 and P = 0.003, r = 0.7; M2, P = 0.1 and P = 0.002, r = 0.7, V4 and dlPFC, respectively. e, Viewing social cues improves choice encoding. Left, Decoding performance for each animal’s choice using pushes with preceding fixations on either social cue within 1,000 ms of push (navy and gold) compared to pushes without fixations on social cues (grey). V4 M1, P = 0.48 and P = 0.4; M2, P = 0.49 and P = 0.71. dlPFC M1, P = 0.0002, r = 0.8 and P = 0.02, r = 0.5; M2, P = 0.008, r = 0.6 and P = 0.02, r = 0.6; with and without social cues, respectively. Right, decoding accuracy for choice averaged across both monkeys for each condition. V4 P = 7.44 × 107 and dlPFC P = 3.46 × 10−6; Wilcoxon signed-rank test. f, Distribution of absolute valued neurons’ weights from the SVM model for decoding social cues (V4, 98 and 102 neurons; dlPFC, 82 and 101 neurons in first and last session). g, Variance of weight distributions for each session from SVM models decoding social and non-social cues, as seen in a,b. V4 data are M2 (average 104 cells per session), and PFC data are M1 (average 102 cells per session). V4, P = 0.01, r = −0.63 and P = 0.57; dlPFC, P = 1.67 × 10−5, r = −0.83 and P = 0.29; social and non-social cue models, respectively. *P < 0.05, **P < 0.01, ***P < 0.001.
Fig. 5
Fig. 5. Spike-timing coordination while learning social interactions.
a, Top, example CCGs of a V4 cell pair and a dlPFC cell pair during two social events, averaged across observations. Bottom, example CCGs of V4–dlPFC cell pairs. b, Temporal coordination for social and non-social events. Top, mean coordination plotted across sessions for each social event in V4, dlPFC and between areas (V4, P = 0.001, r = 0.7; P = 0.01, r = 0.6; P = 0.09 and P = 0.8. dlPFC, P = 5.68 × 106, r = 0.9; P = 0.003, r = 0.7; P = 1.25 × 104, r = 0.7 and P = 0.07. V4–dlPFC, P = 2.89 × 104, r = 0.8; P = 0.01, r = 0.6; P = 9.93 × 104, r = 0.7 and P = 0.27. Linear regression with Pearson’s correlation coefficient). Bottom: mean coordination during fixations on random objects and during random events (intertrial period). V4, P = 0.4 and 0.7; dlPFC, P = 0.4 and 0.09; V4–dlPFC: P = 0.4 and 0.1; random event and fixations, respectively. All data from M1; for M2, see Extended Data Fig. 10a. c, Colour map of within/between area P values from linear regression of mean coordination for each social event in each monkey. Temporal coordination increases during learning. d, Histograms of time-lag values of CCG peaks between all significantly correlated V4–dlPFC cell pairs across sessions and monkeys for each social event. e, Correlated V4–dlPFC neurons contribute more to encoding of social events. Probability density plots of decoder weights of V4 and dlPFC neurons significantly correlated and the remaining uncorrelated population during each social event. Weights were averaged across neurons in each session for each monkey and then combined. V4 from left to right, P = 6.48 × 104, P = 6.38 × 104, P = 0.33, P = 0.24; PFC: P = 0.002, P = 0.001, P = 7.41 × 104, P = 0.14; Wilcoxon signed-rank test. f, Cartoon of social learning model: increased interarea spike-timing coordination improves the encoding of social variables to mediate learning social interaction. NS, not significant.
Extended Data Fig. 1
Extended Data Fig. 1. Wireless eye tracking methods and fixation statistics.
a, Eye tracking calibration procedure. As the animal views five points on a monitor, this information is entered into the program (ISCAN Inc.), which projects a crosshair indicating the animal’s point of gaze onto scene camera frames. b, Using the equation in panel a, pixel space of the scene camera is converted to degrees to identify when objects in the scene camera frames are within the receptive fields of neurons. Here, the animal’s shoulder and upper arm are within receptive fields. c, Raw traces of eye x and y coordinates, and pupil diameter recorded with the wireless eye tracker. The zero values at 1 second are due to a blink, while the zero values of x and y coordinates at 7 seconds are due to the animal viewing an object located out of the field of view captured by the scene camera. d, Number of objects (sorted) that DeepLabCut labeled in the scene camera frames from one session. e, Session-averaged percentage of scene camera frames out of total recorded that contained the crosshair for each monkey. M1: 2382652 frames labeled out of 2844338 total frames. M2: 1158612 frames labeled out of 2421325 total frames. Each circle is the percentage of crosshair labeled frames for each session. f, Histogram of fixation durations from one representative session that consisted of 12,378 fixations. 70% of the fixations were 200 ms duration or less. Illustrations in a were created using BioRender.
Extended Data Fig. 2
Extended Data Fig. 2. Markov Model transitional probabilities between social events for each monkey pair.
a, Left - Transitional probabilities from Markov Modeling estimation, plotted across sessions for each event pair combination in monkey pair 1. The P value is included if simple linear regression P < 0.05. Across monkeys, most increasing trends occur for event pairs that begin with or include a viewing behavior. Right – the transitional probability matrix for all event pairs, averaged across sessions. b, Same as in a, but for monkey pair 2.
Extended Data Fig. 3
Extended Data Fig. 3. Neural population stability.
a, Example single units from one monkey showing spike waveforms recorded across sessions. Each panel represents the average waveform of the unit from one session, with session 1 plotted in a dark color and increasing in transparency across sessions. The unstable unit shows spike waveforms representing stable MUA (Black) and unstable SUA (red); the single unit was only present for 4 out of the 18 sessions. b, The number of stable cells divided by the total number of cells is the percentage of stable units in each area for each monkey. In monkey 1, 81% of recorded units (504/620) in V4 and 74% of recorded units in dlPFC (1350/1837) were consistent across sessions. In monkey 2, 83% of recorded units in V4 (1479/1773) and 71% of recorded units in dlPFC (561/794) were consistent. c, For each brain region, the percentage of cells out of the total recorded (M1: 34 V4 cells, 102 dlPFC cells; M2: 104 V4 cells, 46 dlPFC cells) that exhibited a statistically significant change in firing rate from baseline (intertrial interval firing rate) during social events (as shown in Fig. 3e but plotted across sessions for each monkey). For each cell, P < 0.01 Wilcoxon signed-rank test with FDR correction. The percentage of responding cells does not systematically change across sessions.
Extended Data Fig. 4
Extended Data Fig. 4. Neural responses and oculomotor events during pushes.
a, Self and partner pushes consist of push types that occurred in their respective outlined boxes. ‘Partner only’ pushes rarely occurred and were not used in analysis. For total number of pushes, see Methods: Firing Rate and Response. b, PSTHs from two example dlPFC units that show an increase in firing rate before self-monkey and partner pushes. Bottom: pie chart reflecting the percentage of push-modulated dlPFC units that respond only to self-push, only to partner push, or to both (“mixed”). Percentages averaged across sessions and monkeys. M1: 102 total dlPFC cells, 73 are push responsive; M2: 46 total dlPFC cells, 41 are push responsive. c, The distribution of the number fixations on each object that occurred before (1000 ms pre) self and partner (1000 ms pre, 500 ms post) pushes in each session. Self-monkey views the partner more during partner pushes compared to self-pushes, but he viewed the reward more before self-pushes. Pair 1 P Values: 0.005 and 5.79e−5, Pair 2 P values: 0.03 and 0.003, Wilcoxon rank-sum test. d, Pupil size and eye speed, averaged across sessions and animals, that occurred before (1000 ms pre) the self and partner monkey pushes. There is no significant difference in pupil size and eye speed between animal’s choices, Wilcoxon rank-sum test, P > 0.05. e, The distribution of Pearson correlation coefficients from the correlation of V4 and dlPFC neuron’s firing rates with pupil size and eye speed occurring before (1000 ms pre) self and partner pushes. N = 1157 neurons from eight sessions across two animals. Percent significant represents neurons with a significant correlation coefficient, P < 0.01. *P < 0.05, **P < 0.01, ***P < 0.001.
Extended Data Fig. 5
Extended Data Fig. 5. Neural firing rate correlations to movements during pushes and fixations.
a, Self-monkey’s head movement, limb movement, or torso movement occurring around (1000 ms pre, 500 ms pre, or 500 post) self or partner monkey pushes, averaged across six sessions from two monkeys. Head movement: P = 2.07e−19, P = 2.49e−18, P = 0.001; Limb movement: P = 7.12e−18, P = 7.39e−11, P = 2.49e−7; Torso movement: P = 7.01e−9, P = 0.46, P = 0.0007; for Pre 1 s, Pre 0.5 s and Post 0.5 s respectively, Wilcoxon rank-sum test. On each boxplot, the central horizontal mark indicates the median, and the bottom and top edges of the box indicate the 25th and 75th percentiles, respectively. The whiskers extend to the most extreme data points not considered outliers, and the outliers are plotted individually using the ‘o’ symbol. b, Distribution of Pearson correlation coefficients from the correlation of V4 and dlPFC neuron’s firing rates with head movement occurring around (1000 ms pre, 500 ms pre, or 500 post) self and partner pushes. N = 900 neurons from six sessions across two animals. “% sig” represents neurons with a significant correlation coefficient, P < 0.01. c, Self-monkey’s head movement occurring 200 ms after onset of fixations on reward and partner monkey, averaged across six sessions from two monkeys. Head movement: P = 2.44e−9; Limb movement: P = 0.29; Torso movement: P = 0.0009; Wilcoxon rank-sum test. While there is a significant difference in torso movement across reward and partner fixations, the magnitude of the difference is <2%. d, The distribution of Pearson correlation coefficients from the correlation of V4 and dlPFC neuron’s firing rates with head movement occurring 200 ms after fixations on the reward system and partner monkey. N = 900 neurons from six sessions across two animals. “% sig” represents the % neurons with a significant correlation coefficient, P < 0.01. *P < 0.05, **P < 0.01, ***P < 0.001.
Extended Data Fig. 6
Extended Data Fig. 6. Non-social controls.
a, Left – Log of the average amount of time between self and partner monkey presses during learning (‘with viewing’) sessions and control sessions with the opaque divider (‘without viewing’). P = 2.30e-08, Wilcoxon rank sum test. Right – Log of the average delay to cooperate, or time for both monkeys to be pressing from the start of a trial, during learning sessions and control sessions with the opaque divider. P = 1.078e-04, Wilcoxon rank sum test. Times were pooled across sessions (n = 4 sessions for each condition) and averaged across monkeys. On each boxplot, the central red mark indicates the median, and the bottom and top edges of the box indicate the 25th and 75th percentiles, respectively. The whiskers extend to the most extreme data points not considered outliers, and the outliers are plotted individually using the ‘+’ symbol in gold. b, Social and solo trial schematic with a peri-event time histogram for a dlPFC cell that exhibits a significant change in firing rate between solo and social conditions, Wilcoxon rank-sum test, P < 0.05. c, Mean percentage of cells (n = 40 cells/session from 9 sessions) responding significantly to self-choice in each condition when compared to baseline and compared across conditions (context difference), P < 0.01 Wilcoxon signed-rank test with FDR correction and Wilcoxon rank-sum test for context difference. Pie chart: Session averaged percentage of modulated (context difference) cells that exhibit significantly higher firing rates before self-choice during solo or social condition. d, Actual and shuffled decoding performance for solo and social trials using dlPFC activity occurring 1000 ms before self-choice, averaged across session values plotted as circles. P = 0.004, Wilcoxon signed-rank test. Dashed line represents chance. SEM is represented with error bars. *P < 0.05, **P < 0.01, ***P < 0.001. Illustrations in were created using Biorender.
Extended Data Fig. 7
Extended Data Fig. 7. Neural correlates of learning cooperation from stable units only.
a, For each monkey, decoding accuracy for social cues from stable neural population activity in each brain area significantly improves during learning, as seen in Fig. 4a. V4 P = 0.01 and 1.32e−4, PFC P = 0.002 and 0.01; monkeys 1 and 2, linear regression. b, For each monkey, the variance of weights from the decoding models shown in panel ‘a’ significantly decreases across sessions during learning, as observed in Fig. 4g. V4 P = 0.03 and 0.01; PFC P = 0.004 and 0.005; monkey 1 and 2, linear regression. c, For each monkey, mean coordination of stable unit pairs for each social event in V4, dlPFC, and between brain areas is plotted across sessions. The same learning trends are observed as those shown in Fig. 5b, c and Extended Data Fig. 10a. Monkey 1 P-values: P = 0.007, 0.02, 0.09, 0.79; P = 0.03, 0.01, 1.93e−4, 0.07; P = 2.9e−4, 0.02, 0.002, 0.29; Monkey 2 P-values: P = 0.03, 0.01, 0.11, 0.26; P = 0.003, 0.006, 4.98e−4, 0.25; P = 0.03, 0.01, 0.01, 0.56; within V4, within PFC, and between areas respectively, linear regression. d, Probability density plots of decoder weights from stable, V4 and dlPFC correlated neurons during viewing social cues. Weights were averaged across neurons within each session for each monkey, then combined. Results are equivalent to those in Fig. 5e. V4 from left to right: P = 0.011 and P = 2.8e−4; PFC from left to right: P = 0.01 and 0.001, Wilcoxon signed-rank test comparing correlated neuron weights to remaining population. *P < 0.05, **P < 0.01, ***P < 0.001.
Extended Data Fig. 8
Extended Data Fig. 8. Decoding performance for social events.
a, Actual and shuffled decoding performance for each animal’s choice to cooperate and discrimination of social cues. Actual and shuffled values are plotted to provide an example comparison for the shuffle-corrected plots completed for monkey 1, Fig. 4a and d. Shuffled decoder accuracies remained at chance levels (50%) across all sessions. This was also the case for every other decoding analyses in Fig. 4. b, Decoding performance for social cues, categories, and choice where the number of observations remained the same across all sessions and for each class. For each brain area, decoding accuracy still significantly improves during learning when the number of observations remains unchanged across sessions. All P-values are from linear regression and r is Pearson correlation coefficient. Social cues M1 dlPFC P = 0.0003, r = 0.75 and V4 P = 0.02, r = 0.53; M2 dlPFC P = 9.9e−4, r = 0.78 and V4 P = 0.0003, r = 0.83. Categories M1 dlPFC P = 1.3e-4, r = 0.78; M2 dlPFC P = 0.002, r = 0.76. Choice M1 dlPFC P = 6.84e-4, r = 0.72; M2 dlPFC P = 0.003, r = 0.68. c, The change in decoding performance for social cues (original model accuracy with all neurons minus model with n-1 accuracy), is sorted according to the descending weight of the removed neuron. X-axis represents the index of a neuron; only one neuron was removed from each model. Session-averaged change in accuracy is plotted. Removing neurons with high weights decreases performance but the effect is attenuated as neurons with lower weights are removed. The change in accuracy for the first 30 neurons (out of 104 total in V4, 102 total in dlPFC) of descending weights is shown for clarity. V4 P = 1.11e-5, r = −0.71 and dlPFC P = 0.0009, r = −0.57; linear regression and Pearson correlation. d, For V4 and dlPFC, histograms display the change in decoding accuracy from removing upper and lower deciles of neurons (11 neurons) with the highest (gold and blue) and lowest (red) weights, respectively. Informative and uninformative neurons have significantly different effects on model performance. V4 P = 0.005 and dlPFC P = 0.009, Wilcoxon rank-sum test. *P < 0.05, **P < 0.01, ***P < 0.001.
Extended Data Fig. 9
Extended Data Fig. 9. Learning reduces variance of neural population decoding weights.
a, The maximum absolute valued weight for each session in SVM models that decode social or non-social cues is plotted for each cortical area. V4 social cues maximum weight, P = 0.002, r = −0.74; non-social cues P = 0.65, r = −0.12; PFC social cues maximum weight, P = 0.004, r = −0.64; non-social cues P = 0.77, r = 0.07, linear regression and Pearson correlation. b, Summary of decoding models that exhibit decreased variance, kurtosis, skewedness, or maximum weight values for each brain area and monkey. For each decoding model, the P value, represented in shades of teal color, reflects linear regression of each weight metric with session number, as shown in panel a and Fig. 4g. Significantly decreased variance, kurtosis, skewedness, or maximum weight value is only observed in decoding models that exhibit increased decoding performance during learning. V4 P-values for monkey 1 kurtosis and skewedness P = 0.02 and P = 0.01, respectively. V4 P-values for monkey 2 variance and maximum weight P = 0.01 and 0.002, respectively. PFC P-values for monkey 1 variance, kurtosis, skewedness, and maximum weight values from social cues model are P = 1.67e−5, P = 0.03, P = 0.006, P = 0.004, respectively; from choice model variance P = 0.005; from category model variance, kurtosis, skewedness, and maximum weight, P = 9.19e−5, P = 0.01, P = 0.006, P = 0.001, respectively. PFC P-values for monkey 2 variance, kurtosis, skewedness, and maximum weight values from social cues model are P = 0.004, P = 0.02, P = 0.008, P = 0.01, respectively; from choice model kurtosis and maximum weight, P = 0.02 and P = 0.03; from category model kurtosis, and maximum weight, P = 0.02 and P = 0.03, respectively. c, Within a session, neurons’ decoding weight and D-prime values for task variables are positively correlated. Example sessions are shown for various decoding models where accuracy is above chance. Each circle represents the absolute value of D-prime and normalized SVM decoding weight of each neuron within a session. P-values and significant Pearson correlation coefficients are shown. d, For each cortical area, examples of individual neuron normalized weights and D-prime values that significantly increased (dark shade) or decreased (light shade) across sessions. N represents the total number of neurons that exhibited changes. In dlPFC, 75 stable neurons were recorded/session and in V4, 87 stable neurons were recorded/session. *P < 0.05, **P < 0.01, ***P < 0.001.
Extended Data Fig. 10
Extended Data Fig. 10. Spike-timing coordination and response latency.
a, Top row: For Monkey 2, mean coordination plotted across sessions for each social event in V4, dlPFC, and between brain areas (V4: P = 0.03, r = 0.6; P = 0.005, r = 0.7; P = 0.1 and P = 0.2. PFC: P = 0.008, r = 0.7; P = 0.003, r = 0.8; P = 0.002, r = 0.7 and P = 0.44. V4-dlPFC: P = 0.02, r = 0.6; P = 0.006, r = 0.7; P = 0.01, r = 0.6 and P = 0.48). For ‘view reward’ and ‘view partner’ events, only 14 sessions were analyzed due to an inadequate number of stimulus fixations in 3 out of 17 sessions (sessions with <30 fixations were not included in the analysis). P-values for these data are reflected in Fig. 5c. Bottom row: For monkey 2, mean spike timing coordination during fixations on random objects and during random events (intertrial period, 4.5 seconds before trial start) for V4, dlPFC, and inter-areal cell pairs. V4: P = 0.03 and 0.9; PFC: P = 0.53 and 0.45; V4-dlPFC: P = 0.01 and 0.14, for random events and random fixations, respectively. Significant P-values here correspond to decreasing trends. b, For each monkey (rows) and social event (columns), boxplots display the distribution of differences in V4 and dlPFC response latencies for correlated and uncorrelated neuron pairs across all sessions. V4 latencies were subtracted from dlPFC, i.e., negative values reflect pairs where the dlPFC neuron responded first. For uncorrelated pairs, the difference in latency between every possible combination of pairs was computed. The P-value from Wilcoxon rank-sum test comparing latency differences from correlated and uncorrelated pairs is displayed. On each boxplot, the central red mark indicates the median, and the bottom and top edges of the box indicate the 25th and 75th percentiles, respectively. The whiskers extend to the most extreme data points not considered outliers, and the outliers are plotted individually using the ‘+’ symbol in blue.

References

    1. Emery, N. J. The eyes have it: the neuroethology, function and evolution of social gaze. Neurosci. Biobehav. Rev.24, 581–604 (2000). - PubMed
    1. Nahm, F. K., Perret, A., Amaral, D. G. & Albright, T. D. How do monkeys look at faces? J. Cogn. Neurosci.9, 611–623 (1997). - PubMed
    1. Emery, N. J., Lorincz, E. N., Perrett, D. I., Oram, M. W. & Baker, C. I. Gaze following and joint attention in rhesus monkeys (Macaca mulatta). J. Comp. Psychol.111, 286–293 (1997). - PubMed
    1. Chang, S. W. C., Gariepy, J.-F. & Platt, M. L. Neuronal reference frames for social decisions in primate frontal cortex. Nat. Neurosci.16, 243–250 (2013). - PMC - PubMed
    1. Aquino, T. G. et al. Value-related neuronal responses in the human amygdala during observational learning. J. Neurosci.40, 4761–4772 (2020). - PMC - PubMed