. 2024 Mar;627(8002):196-203.
doi: 10.1038/s41586-024-07086-9. Epub 2024 Feb 14.

Nuclear morphology is shaped by loop-extrusion programs

Affiliations

Nuclear morphology is shaped by loop-extrusion programs

Indumathi Patta et al. Nature. 2024 Mar.

Abstract

It is well established that neutrophils adopt malleable polymorphonuclear shapes to migrate through narrow interstitial tissue spaces1-3. However, how polymorphonuclear structures are assembled remains unknown4. Here we show that in neutrophil progenitors, halting loop extrusion-a motor-powered process that generates DNA loops by pulling in chromatin5-leads to the assembly of polymorphonuclear genomes. Specifically, we found that in mononuclear neutrophil progenitors, acute depletion of the loop-extrusion loading factor nipped-B-like protein (NIPBL) induced the assembly of horseshoe, banded, ringed and hypersegmented nuclear structures and led to a reduction in nuclear volume, mirroring what is observed during the differentiation of neutrophils. Depletion of NIPBL also induced cell-cycle arrest, activated a neutrophil-specific gene program and conditioned a loss of interactions across topologically associating domains to generate a chromatin architecture that resembled that of differentiated neutrophils. Removing NIPBL resulted in enrichment for mega-loops and interchromosomal hubs that contain genes associated with neutrophil-specific enhancer repertoires and an inflammatory gene program. On the basis of these observations, we propose that in neutrophil progenitors, loop-extrusion programs produce lineage-specific chromatin architectures that permit the packing of chromosomes into geometrically confined lobular structures. Our data also provide a blueprint for the assembly of polymorphonuclear structures, and point to the possibility of engineering de novo nuclear shapes to facilitate the migration of effector cells in densely populated tumorigenic environments.


Conflict of interest statement

Competing interests The authors declare no competing interests.

Figures

Extended Data Fig. 1 |
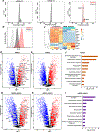
Extended Data Fig. 1 |. Declines in SMC1, SMC3a and RAD21 expression in differentiating neutrophils.
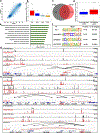
a, Left images represent Wright–Giemsa staining of ECOMG progenitors cultured in the presence (top images) or absence (bottom images) of β-oestradiol (n = 500 cells). Scale bars, 20 μm (left image) and 10 μm (right image). Right images represent Wright–Giemsa staining of CD11b−/+Ly6G neutrophil progenitors (upper image) and CD11b+Ly6G+ differentiated neutrophils (lower image) isolated from the bone marrow. Scale bars, 10 μm. b, Volcano plot shows relative transcript abundance in ECOMG progenitors cultured in the absence versus presence of β-oestradiol. Upregulated transcripts are shown in red while downregulated transcripts are indicated in blue. Genes closely associated with a neutrophil-specific gene program are highlighted. c, Volcano plot highlights transcripts encoding for transcription factors that instruct neutrophil cell fate. Volcano plots represent the results of the limma-voom differential expression analysis displayed as the log2 fold change by the −log10 of the adjusted P value of each gene. Upregulated genes defined Padj < 0.05 and log2-transformed fold change > 1 are represented in red. Downregulated genes defined as Padj < 0.05 and log2-transformed fold change < −1 are represented in blue. d, Western blot analysis of SMC1a, SMC3, RAD21 and NIPBL protein levels in ECOMG progenitors and differentiated neutrophils are shown. e, Heat map indicating normalized transcript counts (DESeq2) and the genome browser tracks (IGV) of RNA-seq indicating transcript abundance for factors that instruct loop extrusion in neutrophil progenitors and differentiated neutrophils derived from mouse bone marrow are shown.
Extended Data Fig. 2 |
Extended Data Fig. 2 |. Depletion of the loop-extrusion loading factors NIPBL and MAU2 instructs cell-cycle arrest and orchestrates distinct neutrophil-specific gene programs.
a, Flow cytometry analyses of propidium iodide staining for NIPBL-FKBP12F36V-EYFP ECOMG cells cultured for 72 h in the absence or presence of dTAG-13 are shown. b, Intracellular staining of the proliferation marker Ki-67 in NIPBL-FKBP12F36V-EYFP cells cultured for 72 h in the absence or presence of dTAG-13 is shown. c, Heat map indicating mRNA abundance encoding for factors involved in structuring the nuclear envelope in ECOMG progenitors and NIPBL-depleted ECOMG progenitors. d, Volcano plot represents the differential expression of transcripts in ECOMG progenitors carrying MAU2-FKBP12F36V-mScarlett cassettes were cultured for 72 h with β-oestradiol in the absence or presence of dTAG-13. Upregulated genes defined by Padj < 0.05 and log2-transformed fold change > 1 are represented in red. Downregulated genes defined by Padj < 0.05 and log2-transformed fold change < −1 are represented in blue. e, Depletion of MAU2 activates the expression of genes encoding for transcription factors that instruct neutrophil cell fate. f, GO-based functional classification of differentially expressed transcripts in MAU2-depleted cells. Representative pathways that relate to neutrophil differentiation and inflammation are shown. g, Depletion of both NIPBL plus MAU2 activates a neutrophil-specific transcription signature. Volcano plot shows differential transcript levels in ECOMG progenitors carrying both NIPBL-FKBP12F36V-EYFP and MAU2-FKBP12F36V-mScarlet cassettes that were cultured for 72 h with β-oestradiol and in the absence or presence of dTAG-13. Genes closely associated with a neutrophil-specific gene program are highlighted. Upregulated genes defined as Padj < 0.05 and log2-transformed fold change > 1 are represented in red. Downregulated genes defined as Padj < 0.05 and log2-transformed fold change < −1 are represented in blue. h. Volcano plot highlights transcripts encoding for neutrophil-signature transcription factors. i, GO-based functional classification of differentially expressed transcripts in cells depleted for both NIPBL and MAU2. Representative pathways that relate to neutrophil differentiation and inflammation are shown.
Extended Data Fig. 3 |
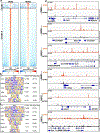
Extended Data Fig. 3 |. Depletion of NIPBL interferes with RAD21 occupancy.
a, NIPBL depletion modulates Rad21 occupancy. NIPBL-FKBP12F36V-EYFP progenitors were cultured with β-oestradiol in the absence or presence of dTAG-13. RAD21 occupancy was analysed using ChIP–seq analysis and presented as tornado plots. Cluster I is comprised of RAD21-binding sites that were enriched upon depletion of NIPBL. Cluster II consists of RAD21-binding sites that were depleted upon removal of NIPBL. In NIPBL-depleted cells 9,293 RAD21-binding sites were lost, 531 binding sites were gained and 7,773 binding sites were shared. RAD21 peaks were generated using FDR <1e-25 and fold enrichment > 5. b, Cis elements associated with 9,293 RAD21-bound sites that were depleted in NIPBL-depleted cells. P values for motif enrichment and matched transcription-factor-binding sites are indicated. c, Cis elements associated with 531 RAD21-bound sites that were gained upon removal of NIPBL expression. d, Genome browser tracks represent ChIP–seq reads in ECOMG progenitors cultured in the absence or presence of dTAG-13. IGV Tracks for Spi1, Nfil3, Ikzf1, Cebpa, Nlrp3 and Lcn2 loci are shown.
Extended Data Fig. 4 |
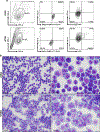
Extended Data Fig. 4 |. Depletion of RAD21 instructs the assembly of polymorphonuclear structures.
a, ECOMG cells carrying RAD21-FKBP12F36V-EYFP cassettes integrated into the endogenous RAD21 loci were cultured for 36 h with β-oestradiol in the absence or presence of dTAG-13. Flow cytometry analysis shows gating of live cells using FSC-A and SSC-A. Gated, live single cells were used for the analysis of EYFP, CD11b and Ly6G expression. b, Wright–Giemsa staining of RAD21-FKBP12F36V-EYFP ECOMG cells cultured with β-oestradiol alone (top images) or in the presence of both β-oestradiol and dTAG-13 (bottom images). Objectives used were 40× (left) and 100× (right). Scale bars, 20 μm (left) and 10 μm (right).
Extended Data Fig. 5 |
Extended Data Fig. 5 |. Depletion of NIPBL increases chromatin accessibility at neutrophil-specific promoters and enhancers.
a, NIPBL depletion increases chromatin accessibility across enhancer and promoter elements. NIPBL-FKBP12F36V-EYFP ECOMG progenitors were cultured with β-oestradiol in the absence or presence of dTAG-13. Changes in chromatin accessibility of cells cultured in the absence (0 h) or presence of dTAG-13 (6 and 72 h) were analysed and presented as tornado plots. Clusters were generated using K-means clustering (n = 2). The number of regions associated with neutrophil-specific promoters (H3K4me3), active enhancers (H3K27Ac and H3K4me1) or weak enhancers (H3K4me1) and transcriptionally silent regions are shown. Tornado plots were generated by sorting maximum signal strength intensities for ATAC-seq reads. Colour scale intensities represent normalized read scores (reads per 10 million uniquely mapped reads per base pair). b, Cis elements associated with increased chromatin accessibility at enhancers and promoters are shown. P values for motif enrichment and matched transcription-factor-binding sites are indicated. c, NIPBL depletion decreases chromatin accessibility across a subset of enhancer and promoter elements. Changes in chromatin accessibility of cells cultured in the absence (0 h) or presence of dTAG-13 (6 and 72 h) were analysed and presented as tornado plots. d, Cis elements associated with decreased chromatin accessibility at enhancers and promoters are shown. e, Genome browser tracks depicting RNA-seq, ChIP–seq and ATAC-seq reads at the Myc, Spi1 and Il1b loci are shown.
Extended Data Fig. 6 |
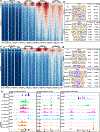
Extended Data Fig. 6 |. Halting loop extrusion leads to widespread changes in chromatin folding to orchestrate an inflammatory gene program.
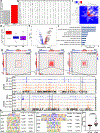
a, Scatter plot shows A versus B compartmentalization (50 kbp resolution) in NIPBL-FKBP12F36V-EYFP ECOMG cells cultured in the absence (x axis) or presence of dTAG-13 (y axis). b, Box plot represents differential segregation scores (50 kbp resolution) for cells cultured in the absence versus presence of dTAG-13. one-sided P < 0.05. In each box, the upper edge, horizontal centre line and lower edge represent the 75th percentile, median and 25th percentile, respectively. The upper whiskers represent the 75th percentile + 1.5× the IQR. The lower whiskers represent the 25th percentile - 1.5× the IQR. c, Venn diagram indicates number of gained or lost chromatin loops in NIPBL-FKBP12F36V-EYFP ECOMG cultured in the absence versus presence of dTAG-13. d, Transcript abundance correlates with the assembly of loops in NIPBL-FKBP12F36V-EYFP cells cultured in the absence versus the presence of dTAG-13. Mean change and corresponding distribution of loops associated with transcriptional silencing or activation log2 FC > = 2 or log2 FC < = −2) in NIPBL-depleted cells are shown. e, GO-based functional classification of differentially expressed transcripts that are associated with gained paired promoter and enhancer elements in NIPBL-depleted cells. f, Cis elements associated with increased chromatin accessibility at enhancers and promoters are shown. P values for motif enrichment and matched transcription-factor-binding sites are indicated. g, Genome browser tracks indicate RNA-seq, ATAC-seq and Hi-C reads across the Myc locus for NIPBL-FKBP12F36V-EYFP ECOMG cells cultured in the absence or presence of dTAG-13. h, Genome browser tracks indicate RNA-seq, ATAC-seq and Hi-C reads across the Nlrp3 and Nfil3 loci for NIPBL-FKBP12F36V-EYFP cells cultured in the absence or presence of dTAG-13.
Extended Data Fig. 7 |
Extended Data Fig. 7 |. Structure of a mega-loop body pairing the NLRP3 and SEC14l1 loci into a common hub.
a, Ten kb resolution (left) and 5 kbp resolution (right) KR-normalized Hi-C contact matrices indicating loop bodies that span Nlrp3 and Sec14l1 loci across chromosome 11 are shown in ECOMG progenitors (−dTAG−13) and NIPBL-depleted cells (+dTAG-13). b, Box plot shows the sum of KR-normalized-interaction frequencies across a gained mega-loop body spanning the Nlrp3 and Sec14l1 loci in ECOMG progenitors (−dTAG) and NIPBL-depleted cells (+dTAG). Two-sided two-sample T-test was performed. P = 1.72 × 10⁻⁹. In each box, the upper edge, horizontal centre line and lower edge represent the 75th percentile, median and 25th percentile, respectively. The upper whiskers represent the 75th percentile + 1.5× the IQR. The lower whiskers represent the 25th percentile − 1.5× the IQR. c,d, Genome browser tracks depicting RNA-seq, ChIP–seq and ATAC-seq reads at mega-loop interactions involving the Nlrp3 (c) and Sec14l1 (d) loci in cells cultured with β-oestradiol and in the absence or presence of dTAG-13. Note that ChIP–seq reads were derived from ECOMG cells cultured in the presence of β-oestradiol (Pro) versus absence of β-oestradiol (Neu).
Extended Data Fig. 8 |
Extended Data Fig. 8 |. Halting loop extrusion enriches for interchromosomal interactions and reduces nuclear volume.
a, Proportions of interchromosomal contacts detected for NIPBL-FKBP12F36V-EYFP cells cultured in the presence versus absence of dTAG-13 are shown (see Methods). b, Table depicts the frequency of interchromosomal interactions enriched in NIPBL-depleted cells. Log2 FC > 3.52 (Z-score > 2.576 with two-sided P = 0.01). c, Heat map shows clustering of interacting chromosomes normalized for size. d, Log2 fold change of transcripts abundance associated with A-A, B-B and A-B compartmental domains at interchromosomal interaction hubs in NIPBL-depleted cells. Z-score>1.96. In each box, the upper edge, horizontal centre line and lower edge represent the 75th percentile, median and 25th percentile, respectively. The upper whiskers represent the 75th percentile + 1.5× the IQR. The lower whiskers represent the 25th percentile - 1.5× the IQR. e, Volcano plot shows the differential expression of 3,951 genes located at interchromosomal hubs that were enriched in NIPBL-FKBP12F36V-EYFP cells cultured in the presence versus absence of dTAG-13. f, GO enrichment analysis for genes located at interchromosomal contact hubs that were enriched in NIPBL-FKBP12F36V-EYFP cells cultured in the presence versus absence of dTAG-13. g, Heat maps show KR-normalized interchromosomal interactions (100 kbp resolution) involving chromosomes 2 and 17 for indicated cell types and culture conditions. Bottom, genome browser (IGV) tracks depicting RNA-seq and ATAC-seq reads at genomic regions of interchromosomal hubs involving chromosomes 2 and 17. h,i, Transcription factor motif analysis of gained (h) and lost (i) ATAC-seq peaks associated with gained interchromosomal interaction hubs enriched in NIPBL-depleted cells. j, Depletion of NIPBL reduces nuclear volume in ECOMG progenitors. Plots show nuclear volumes (μm3) measured for NIPBL-FKBP12F36V-EYFP cells cultured in the presence (n = 33 cells) versus absence (n = 30 cells) of dTAG-13. Unpaired t-test was performed (P < 0.0001).
Extended Data Fig. 9 |
Extended Data Fig. 9 |. Halting loop extrusion activates gene expression at genomic regions enriched for interchromosomal interactions.
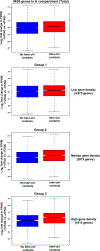
Box plots show log2-transformed fold changes in FKPM reads (+dTAG versus −dTAG treated cells). In each box, the upper edge, horizontal centre line and lower edge represent the 75th percentile, median and 25th percentile, respectively. The upper whiskers represent the 75th percentile + 1.5× the IQR. The lower whiskers represent the 25th percentile − 1.5× the IQR. Genes whose transcription start sites were located in the euchromatic (A) compartment were segregated into 3 groups based on low, median and high gene density. At similar gene density, the euchromatic regions that were enriched for interchromosomal interactions were associated with upregulated gene expression compared to the euchromatic regions without interchromosomal interactions. Two-sample t-test was performed. P = 2.90 × 10⁻⁹ (Total), P = 0.0014 (Group 1), P = 1.83 × 10⁻⁶ (Group 2), P = 5.18 × 10⁻¹⁰ (Group 3).
Extended Data Fig. 10 |
Extended Data Fig. 10 |. Depletion of NIPBL in primary bone marrow haematopoietic progenitors enriches for polymorphonuclear cells.
a, NIPBL-FKBP12F36V-EYFP ECOMG progenitors were electroporated with crRNAs that target four different genomic regions in NIPBL, named NIPBL-crRNA1–4, tracrRNAs conjugated with ATTO-550 and Cas9. Electroporated ECOMG progenitors were cultured for three days in the presence of β-oestradiol and examined for CD11b and Ly6G expression. Upper panels show transfection efficiencies as reflected by ATTO-550 expression. ECOMG cells that were not electroporated served as a control. As an additional control ECOMG cells were electroporated with negative crRNPs (control RNPs) lacking specificity for genomic sequences (IDT). b, ECOMG cells electroporated with NIPBL-crRNPs 1 + 2 and control crRNPs were analysed for the expression of CD11b and Ly6G. c, ECOMG cells were electroporated with NIPBL-crRNPs 1 + 2. Ly6G+ cells were sorted after 72 hrs. Sorted samples were examined by DNA sequencing for the presence of indels. d, Lin- primary bone marrow progenitors were electroporated with crRNPs 1 + 2 targeting NIPBL. Electroporated cells were cultured for three days in the presence of SCF and Flt3L and examined for transfection efficiencies and for CD11b and Ly6G expression. e, Three days after electroporation ATTO-550 and ATTO-550+ cells were sorted and analysed for the presence of indels. f, ATTO-550 and ATTO-550+ cells were sorted and analysed for nuclear morphology using Wright–Giemsa staining. Table indicates the percentages of progenitors and differentiated progeny in cells transfected with crRNPs (1 + 2) that target NIPBL. A total of 400–500 cells for each condition was examined. All experiments were performed independently at least three times.
Extended Data Fig. 11 |
Extended Data Fig. 11 |. Depletion of NIPBL in primary bone marrow haematopoietic progenitors instructs the onset of neutrophil development.
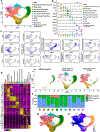
a, UMAP plot derived from two independent replicates of ATTO-550 (control) and ATTO-550+ (NIPBL-depleted) populations is shown. Different clusters representing hematopoietic populations are shown for GMPs, myeloblasts/promyelocytes, myelocytes, immature neutrophils, mature neutrophils, transitional neutrophils, macrophage progenitors, pDCs, cDCs, basophils and myeloid/lymphoid progenitors. b, Violin plots show the expression levels of cluster-specific transcripts. c, UMAP plots of cluster-specific transcript distribution among GMPs, cycling cells, myeloblasts/promyelocytes, myelocytes, immature neutrophils, mature neutrophils, transitional neutrophils, macrophage progenitors, pDCs, cDCs, basophils and myeloid/lymphoid progenitors are shown. d, Heat map indicating cell-type specific expression of a selected group of transcripts. Cluster-specific differentially expressed genes were identified using Wilcoxon rank-sum test implemented in Seurat min.pct of 0.25 and a logfc.threshold of 0.25 (FindMarkers). e, UMAP plots were derived by integrating and clustering of scRNA-seq reads from bone-marrow-derived mouse neutrophils, ATTO-550 (control) and ATTO-550+ (NIPBL-depleted) populations. f, The proportion of indicated cell types in ATTO-550 (control) and ATTO-550+ (NIPBL-depleted) populations is shown. g, Cellular dynamics analysis indicates developmental trajectories adopted by differentiating neutrophils. Putative differentiation trajectories are shown. h, Pseudotime visualization of neutrophil differentiation instructed by NIPBL depletion in primary hematopoietic progenitors is shown. scRNA-seq data were generated from two independent biological replicates.
Extended Data Fig. 12 |
Extended Data Fig. 12 |. Depletion of NIPBL initiates a neutrophil-specific gene program in myeloid progenitors.
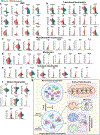
af, Violin plots indicate the expression patterns of neutrophil-signature genes in GMPs (a), transitional neutrophils (b), myeloblasts/promyelocytes (c), myelocytes (d), immature neutrophils (e) and mature neutrophils (f) derived from ATTO-550 (control) and ATTO-550+ (NIPBL-depleted) populations. (t-test; ns: p > 0.05, *: p <= 0.05, **: p <= 0.01, ***: p <= 0.001, ****: p <= 0.0001). g, Model depicting the role of loop extrusion in mononuclear versus polymorphonuclear cell differentiation. Loop extrusion enforces the checkpoint that orchestrates mononuclear versus polymorphonuclear cell fate choice. Chromosomes in mononuclear cells are shown as rigid chromatin fibres (stacked rosettes). In polymorphonuclear cells, chromosomes are depleted for rosettes to adopt flexible conformations that enable the assembly of mega-loops and interchromosomal interactions. Illustration was created using BioRender.
Fig. 1 |
Fig. 1 |. Halting loop extrusion activates a neutrophil-specific gene program.
a, Drawings of polymorphonuclear leukocytes by E. Metchnikoff, reproduced with permission from ref. , Oxford Univ. Press. b, Model system to identify mechanisms that underpin the assembly of polymorphonuclear structures. NIPBL-FKBP12F36V-EYFP cells cultured with β-oestradiol remained mononuclear and undifferentiated, whereas withdrawing β-oestradiol induced neutrophil differentiation. When NIPBL-FKBP12F36V-EYFP cells were cultured in the presence of β-oestradiol and dTAG-13, the abundance of NIPBL acutely declined to orchestrate the differentiation of polymorphonuclear cells. c, RNA sequencing (RNA-seq) tracks indicate the abundance of mRNAs encoding loop-extrusion factors in ECOMG progenitors (Pro; red) and in ECOMG-derived differentiated neutrophils (Neu; black). d, NIPBL-FKBP12F36V-EYFP ECOMG progenitors were cultured for 72 h with β-oestradiol and in the absence or presence of dTAG-13, and examined for the expression of NIPBL–EYFP, CD11b and Ly6G. e, Western blot analysis of the expression of NIPBL in NIPBL-FKBP12F36V-EYFP ECOMG progenitors cultured for 72 h with β-oestradiol and in the absence or presence of dTAG-13. f,g, Depletion of NIPBL activates a neutrophil-specific transcription signature. Volcano plots highlight neutrophil-signature genes (f) and genes encoding transcription factors (g) associated with neutrophil differentiation in NIPBL-depleted cells. Upregulated genes are indicated in red (adjusted P value (Padj) < 0.05 and log2-transformed fold change > 1); downregulated genes are shown in blue (Padj < 0.05 and log2-transformed fold change < −1). h, Gene ontology (GO)-based functional classification of differentially expressed genes that were upregulated in cells depleted for NIPBL. The data were obtained from three independent biological replicates.
Fig. 2 |
Fig. 2 |. Depletion of NIPBL leads to the assembly of polymorphonuclear structures.
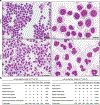
a, Wright–Giemsa staining of NIPBL-FKBP12F36V-EYFP ECOMG cells cultured with β-oestradiol alone (top) or with both β-oestradiol and dTAG-13 (bottom). Objectives used were 40× (left) and 100× (right). Scale bars, 20 μm (left) and 10 μm (right). b, Tables listing the percentages of mononuclear precursor cells, myelocytes, metamyelocytes, band neutrophils, mature neutrophils and hypersegmented neutrophils. DC, differential counts.
Fig. 3 |
Fig. 3 |. Halting loop extrusion produces a chromatin architecture that mirrors that of differentiated neutrophils.
a, Hi-C contact probability plot showing the average intrachromosomal contact frequency as a function of genomic distance for ECOMG progenitors (−dTAG-13) and NIPBL-depleted ECOMG progenitors (+dTAG-13). b, Box plots showing the sum of KR-normalized intra-TAD Hi-C contact frequencies (50 kbp resolution) for NIPBL-FKBP12F36V-EYFP ECOMG cells grown in the absence or in the presence of dTAG-13. P < 2.2 × 10⁻¹⁶ (two-sided paired t-test comparing cells cultured in the presence of dTAG-13 versus those cultured in its absence). In each box, the top edge, horizontal centre line and bottom edge represent the 75th percentile, median and 25th percentile, respectively. The top whiskers represent the 75th percentile + 1.5× the interquartile range (IQR). The bottom whiskers represent the 25th percentile − 1.5× the IQR. c, Box plots showing the ratio of intra-TAD interaction frequencies for the indicated cell types and culture conditions. P < 2.2 × 10⁻¹⁶ (two-sided two-sample t-test). Statistics as described above. d, Heat maps showing differential intrachromosomal contact frequencies across chromosome 17 (250 kbp resolution) for the indicated cell types and culture conditions. e, Average log2 ratios of KR-normalized Hi-C intrachromosomal contact frequencies of chromosome 17 (50-kbp resolution) calculated for ECOMG progenitors (−dTAG-13) versus NIPBL-depleted ECOMG progenitors (+dTAG-13), as well as for ECOMG progenitors (+oestradiol; Pro) versus ECOMG-derived differentiated neutrophils (−oestradiol; Neu) (Pearson correlation coefficient (PCC) value = 0.6582). f, PCC values for individual chromosomes in indicated cell types and conditions, computed for average log2 ratios of KR-normalized Hi-C intrachromosomal contact frequencies that were stratified for genomic distance. NIPBL-FKBP12F36V-EYFP cells cultured in the absence versus the presence of dTAG-13 were compared with NIPBL-FKBP12F36V-EYFP progenitors cultured in the presence (Pro) versus the absence (Neu) of oestradiol. g, Left, meta-TAD plot for NIPBL-FKBP12F36V-EYFP cells cultured in the absence versus the presence of dTAG-13, showing average KR-normalized contact frequencies for TADs (1 Mb) across 3-Mb windows (n = 99). Right, meta-loop plots showing average KR-normalized contact frequencies for loops that span 200 kbp (n = 313). Meta-loop plots are shown for NIPBL-FKBP12F36V-EYFP cells cultured in the absence or presence of dTAG-13. h, Left, meta-TAD plot for NIPBL-FKBP12F36V-EYFP cells cultured in the presence (Pro) versus the absence (Neu) of oestradiol, showing average KR-normalized contact frequencies for TADs (1 Mb) across 3-Mb windows (n = 84). Right, meta-loop plots showing average KR-normalized Hi-C contact frequencies calculated for loops that span 200 kbp (n = 57). Meta-loop plots are shown for NIPBL-FKBP12F36V-EYFP progenitors and NIPBL-FKBP12F36V-EYFP-derived neutrophils.
Fig. 4 |
Fig. 4 |. Halting loop extrusion induces the assembly of mega-loops.
a, Density plots showing the distribution of genomic distances for gained A-A (red) and gained B-B (blue) mega-loops. b, Mega-loop bodies are depleted of intra-TAD genomic interactions in NIPBL-depleted cells. P < 2.2 × 10⁻¹⁶ (two-sided paired t-test comparing NIPBL-FKBP12F36V-EYFP cells cultured in the absence of dTAG-13 versus those cultured in its presence). c, Box plots showing transcript abundance (measured as log2(FPKM + 1) at anchors of gained (217 genes) and lost (21 genes) mega-loops. d, Volcano plot showing the change in transcript abundance, measured in log2(FPKM + 1) (x axis) versus −log10 false discovery rate (FDR) (y axis), for 217 genes located at genomic regions that span anchors (10-kbp resolution) of gained mega-loops in NIPBL-depleted cells. e, GO enrichment analysis for genomic regions that span tethers of gained mega-loops in NIPBL-depleted cells. NIK, NF-κB-inducing kinase. f,g, Transcription factor (TF) motif enrichment analysis of gained (f) and lost (g) ATAC-seq sites at anchors of de novo mega-loops in NIPBL-FKBP12F36V-EYFP cells cultured in the absence versus the presence of dTAG-13. h, Heat map indicating differential intrachromosomal contact frequencies across chromosome 11 (250-kbp resolution) in NIPBL-FKBP12F36V-EYFP cells cultured in the presence versus the absence of dTAG-13. Gain and loss of contact frequencies are shown as red pixels and blue pixels, respectively. Heat maps indicate an intrachromosomal interaction hub involving the Nlrp3 and Sec14l1 loci (10-kbp resolution).

References

    1. Friedl P & Weigelin B Interstitial leukocyte migration and immune function. Nat. Immunol. 9, 960–969 (2008). - PubMed
    1. Rowat AC et al. Nuclear envelope composition determines the ability of neutrophil-type cells to passage through micron-scale constrictions. J. Biol. Chem. 288, 8610–8618 (2013). - PMC - PubMed
    1. Kalukula Y, Stephens AD, Lammerding J & Gabriele S Mechanics and functional consequences of nuclear deformations. Nat. Rev. Mol. Cell Biol. 23, 583–602 (2022). - PMC - PubMed
    1. Georgopoulos K In search of the mechanism that shapes the neutrophil’s nucleus. Genes Dev. 31, 85–87 (2017). - PMC - PubMed
    1. Nasmyth K & Haering CH Cohesin: its roles and mechanisms. Annu. Rev. Genet. 43, 525–558 (2009). - PubMed