. 2024 Feb 14;14(1):3728.
doi: 10.1038/s41598-024-54319-y.

Real-time evaluation of signal accuracy in wastewater surveillance of pathogens with high rates of mutation

Collaborators, Affiliations

Real-time evaluation of signal accuracy in wastewater surveillance of pathogens with high rates of mutation

Ocean Thakali et al. Sci Rep. .

Abstract

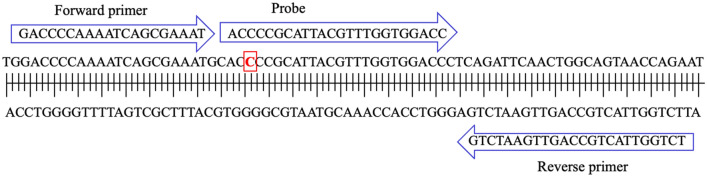
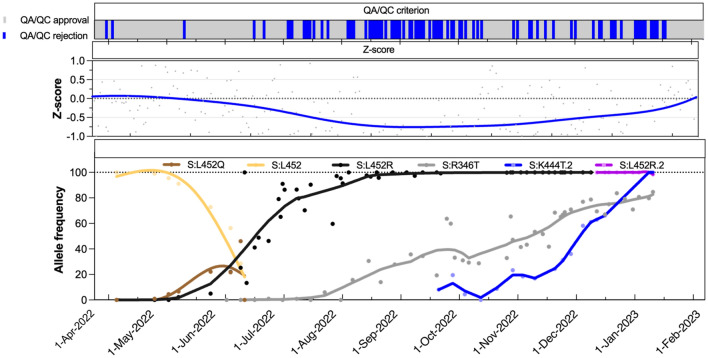
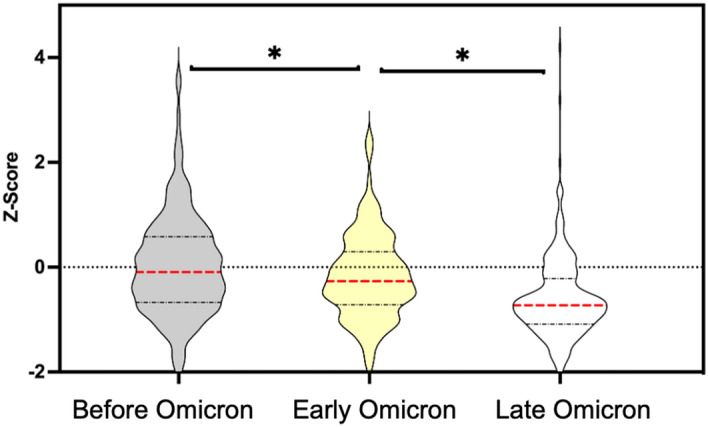
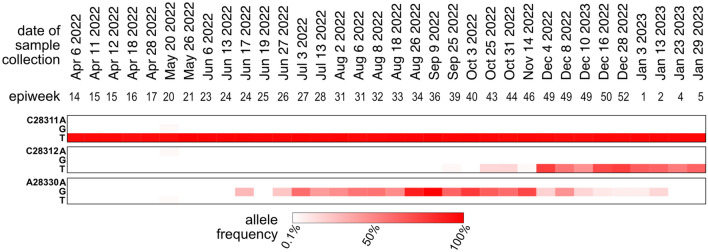
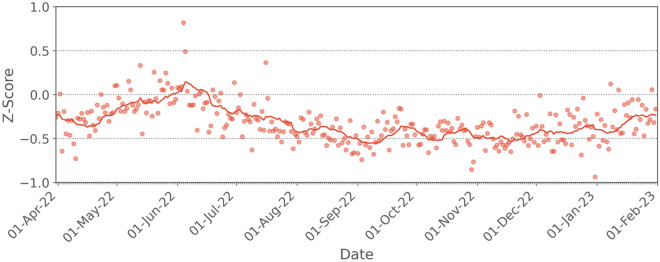
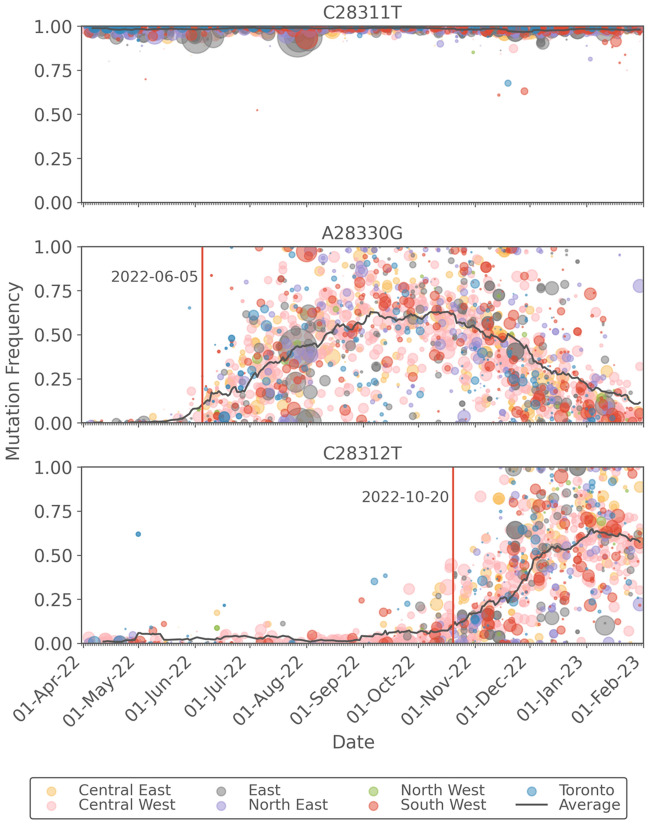
Wastewater surveillance of coronavirus disease 2019 (COVID-19) commonly applies reverse transcription-quantitative polymerase chain reaction (RT-qPCR) to quantify severe acute respiratory syndrome coronavirus 2 (SARS-CoV-2) RNA concentrations in wastewater over time. In most applications worldwide, maximal sensitivity and specificity of RT-qPCR has been achieved, in part, by monitoring two or more genomic loci of SARS-CoV-2. In Ontario, Canada, the provincial Wastewater Surveillance Initiative reports the average copies of the CDC N1 and N2 loci normalized to the fecal biomarker pepper mild mottle virus. In November 2021, the emergence of the Omicron variant of concern, harboring a C28311T mutation within the CDC N1 probe region, challenged the accuracy of the consensus between the RT-qPCR measurements of the N1 and N2 loci of SARS-CoV-2. In this study, we developed and applied a novel real-time dual loci quality assurance and control framework based on the relative difference between the loci measurements to the City of Ottawa dataset to identify a loss of sensitivity of the N1 assay in the period from July 10, 2022 to January 31, 2023. Further analysis via sequencing and allele-specific RT-qPCR revealed a high proportion of mutations C28312T and A28330G during the study period, both in the City of Ottawa and across the province. It is hypothesized that nucleotide mutations in the probe region, especially A28330G, led to inefficient annealing, resulting in reduction in sensitivity and accuracy of the N1 assay. This study highlights the importance of implementing quality assurance and control criteria to continually evaluate, in near real-time, the accuracy of the signal produced in wastewater surveillance applications that rely on detection of pathogens whose genomes undergo high rates of mutation.


Conflict of interest statement

The authors declare no competing interests.

Figures

Figure 1
Figure 1
Schematic layout of the CDC N1 primers and probe sequence. The red rectangle indicates the position of C28311T mutation that also corresponds to the third nucleotide position from the 5’ end of the probe region of N1 assay. Nucleotide coordinates are derived from Genbank SARS-CoV-2 reference sequence NC_045512.
Figure 2
Figure 2
Plot displaying the QA/QC criterion fulfillment, the Z-score, and the proportion of mutations in wastewater across a period of April 1, 2022, to January 31, 2023, in wastewater of Ottawa. The regression curves are Loess regression curve except for S:L452 and S:L452Q for which Spline regression curves are drawn. The frequency estimates are based on AS-RT-qPCR assays.
Figure 3
Figure 3
Violin plot showing Z-scores from the Before Omicron (April 8, 2020 to November 28, 2021), Early Omicron (November 29, 2021 to July 9, 2022), and Late Omicron (July 10, 2022 to January 31, 2023) periods. The asterisk (*) indicates significant difference in Z-score values between two groups (Mann–Whitney test; p < 0.05). Red dotted lines indicate median Z-score values, and the black dashed lines indicate the interquartile range.
Figure 4
Figure 4
Heatmap of mutation frequency within the CDC N1 probe sequence. The frequency estimates are based on tiled amplicon sequencing of 24-h composited samples of wastewater treatment plant influent in the City of Ottawa.
Figure 5
Figure 5
Plot of the Z-score, averaged for each day over all sampling sites in the Ontario WSI. The solid line represents the 14-day moving average.
Figure 6
Figure 6
Plot of the frequencies of the C28311T, A28330G, and C28312T mutations which are present in the N1 region of the N gene. Data points are coloured by the Ontario sub-region from which the sample was taken and are sized in proportion to the sequence coverage. The solid black line represents the 14-day moving average of the daily-averaged frequencies across all sampling sites. The vertical red lines indicate the first date at which the moving average exeeds a frequency of 0.1.
Figure 7
Figure 7
Plot of the frequencies of key mutations in the S gene. Data points are coloured by the Ontario sub-region from which the sample was taken and are sized in proportion to the sequence coverage. The solid black line represents the 14-day moving average of the daily-averaged frequencies across all sampling sites.

References

    1. Naughton, C. C. et al. Show us the Data: Global COVID-19 Wastewater Monitoring Efforts, Equity, and Gaps. - PMC - PubMed
    1. Tiwari A, et al. Tracing COVID-19 trails in wastewater: A systematic review of SARS-CoV-2 surveillance with viral variants. Water. 2023;15:1018. doi: 10.3390/w15061018. - DOI
    1. Bivins A, et al. Variability in RT-qPCR assay parameters indicates unreliable SARS-CoV-2 RNA quantification for wastewater surveillance. Water Res. 2021;203:117516. doi: 10.1016/j.watres.2021.117516. - DOI - PMC - PubMed
    1. Shannon A, et al. Rapid incorporation of Favipiravir by the fast and permissive viral RNA polymerase complex results in SARS-CoV-2 lethal mutagenesis. Nat. Commun. 2020;11:4682. doi: 10.1038/s41467-020-18463-z. - DOI - PMC - PubMed
    1. Chen C, et al. CoV-Spectrum: Analysis of globally shared SARS-CoV-2 data to identify and characterize new variants. Bioinformatics. 2022;38:1735–1737. doi: 10.1093/bioinformatics/btab856. - DOI - PMC - PubMed