

Characterization of graded 6-Hydroxydopamine unilateral lesion in medial forebrain bundle of mice
- PMID: 38355892
- PMCID: PMC10866897
- DOI: 10.1038/s41598-024-54066-0
Characterization of graded 6-Hydroxydopamine unilateral lesion in medial forebrain bundle of mice
Abstract
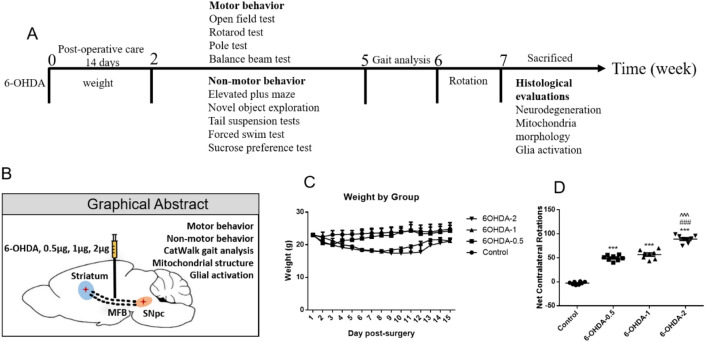
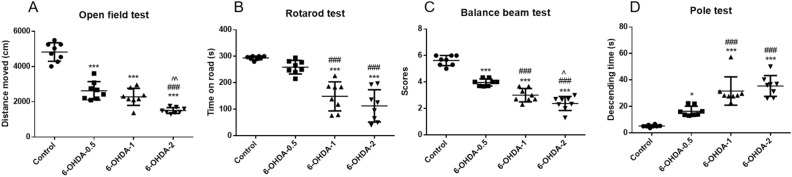
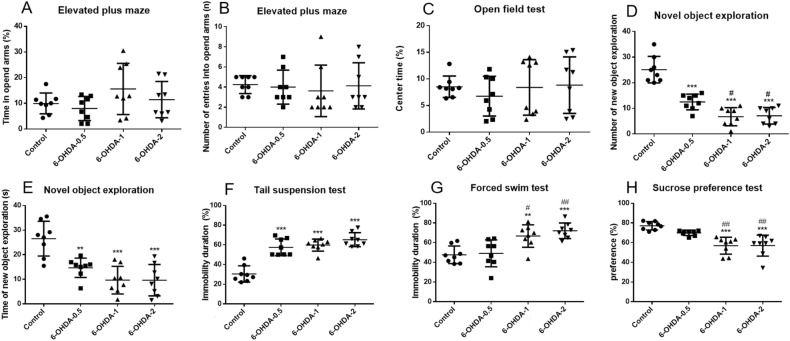
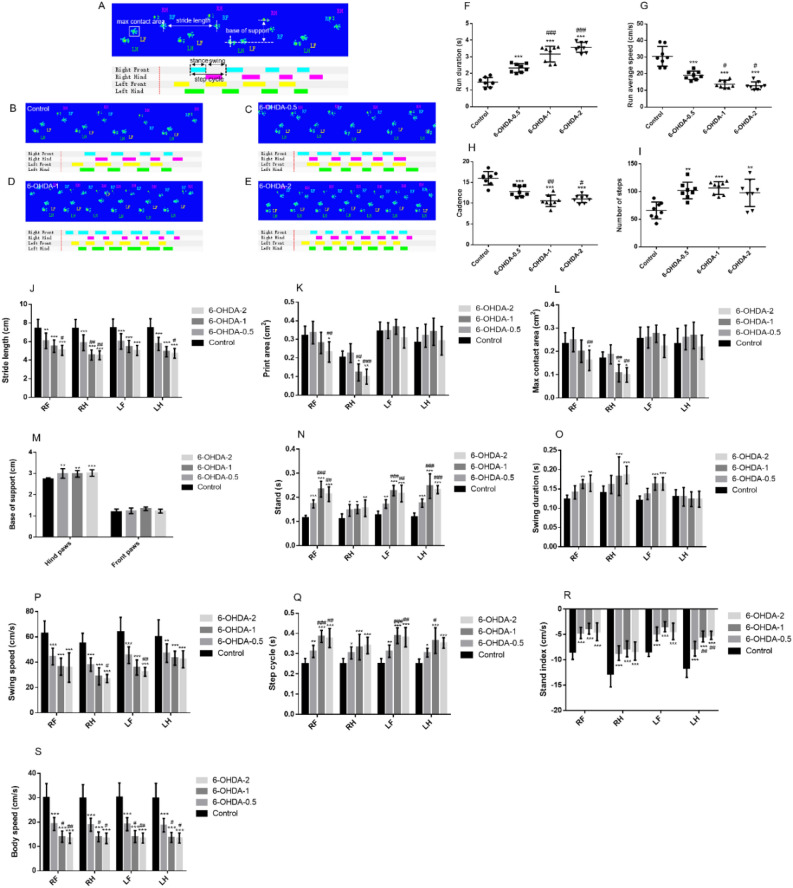
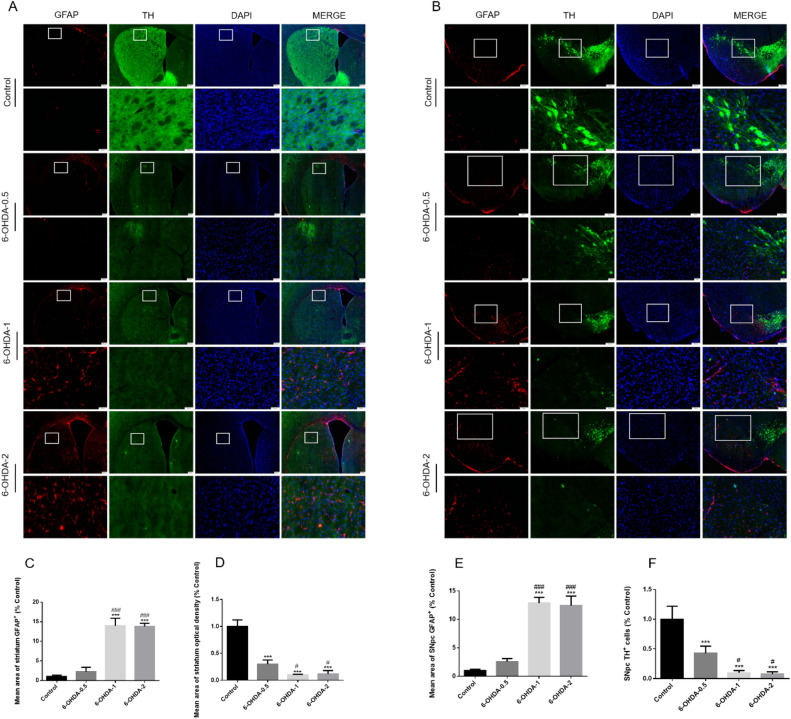
Parkinson's disease (PD) is the second most common age-related neurodegenerative disease, with a progressive loss of dopaminergic cells and fibers. The purpose of this study was to use different doses of 6-hydroxydopamine (6-OHDA) injection into the medial forebrain bundle (MFB) of mice to mimic the different stages of the disease and to characterize in detail their motor and non-motor behavior, as well as neuropathological features in the nigrostriatal pathway. MFB were injected with 0.5 μg, 1 μg, 2 μg of 6-OHDA using a brain stereotaxic technique. 6-OHDA induced mitochondrial damage dose-dependently, as well as substantia nigra pars compacta (SNpc) tyrosine hydroxylase-positive (TH+) cell loss and striatal TH fiber loss. Activation of astrocytes and microglia in the SNpc and striatum were consistently observed at 7 weeks, suggesting a long-term glial response in the nigrostriatal system. Even with a partial or complete denervation of the nigrostriatal pathway, 6-OHDA did not cause anxiety, although depression-like behavior appeared. Certain gait disturbances were observed in 0.5 μg 6-OHDA lesioned mice, and more extensive in 1 μg group. Despite the loss of more neurons from 2 μg 6-OHDA, there was no further impairment in behaviors compared to 1 μg 6-OHDA. Our data have implications that 1 μg 6-OHDA was necessary and sufficient to induce motor and non-motor symptoms in mice, thus a valuable mouse tool to explore disease progression and new treatment in PD.
Keywords: 6-Hydroxydopamine; Gait analysis; Glial cell activation; Medial forebrain bundle; Mitochondrial dysfunction; Motor behavior; Non-motor behavior; Parkinson’s disease.
© 2024. The Author(s).
Conflict of interest statement
The authors declare no competing interests.
Figures


Similar articles
-
Histological, behavioural and neurochemical evaluation of medial forebrain bundle and striatal 6-OHDA lesions as rat models of Parkinson's disease.J Neurosci Methods. 2005 May 15;144(1):35-45. doi: 10.1016/j.jneumeth.2004.10.004. Epub 2004 Dec 8. J Neurosci Methods. 2005. PMID: 15848237
-
Establishment of a 6-OHDA Induced Unilaterally Lesioned Male Wistar Rat Model of Parkinson's Disease.Methods Mol Biol. 2024;2761:491-498. doi: 10.1007/978-1-0716-3662-6_33. Methods Mol Biol. 2024. PMID: 38427257
-
Effect of Intrastriatal 6-OHDA Lesions on Extrastriatal Brain Structures in the Mouse.Mol Neurobiol. 2018 May;55(5):4240-4252. doi: 10.1007/s12035-017-0637-9. Epub 2017 Jun 14. Mol Neurobiol. 2018. PMID: 28616718
-
A partial lesion model of Parkinson's disease in mice--characterization of a 6-OHDA-induced medial forebrain bundle lesion.Behav Brain Res. 2015 May 1;284:196-206. doi: 10.1016/j.bbr.2015.01.053. Epub 2015 Feb 16. Behav Brain Res. 2015. PMID: 25698603
-
Role of GABA pathway in motor and non-motor symptoms in Parkinson's disease: a bidirectional circuit.Eur J Med Res. 2024 Mar 27;29(1):205. doi: 10.1186/s40001-024-01779-7. Eur J Med Res. 2024. PMID: 38539252 Free PMC article. Review.
Cited by
-
Midbrain dopaminergic degeneration differentially modulates primary motor cortex activity and motor behavior in hemi-parkinsonian rats.Res Sq [Preprint]. 2024 May 14:rs.3.rs-4365911. doi: 10.21203/rs.3.rs-4365911/v1. Res Sq. 2024. PMID: 38798359 Free PMC article. Preprint.
-
Protective effects of amphetamine and methylphenidate against dopaminergic neurotoxicants in SH-SY5Y cells.Curr Res Toxicol. 2024 Mar 20;6:100165. doi: 10.1016/j.crtox.2024.100165. eCollection 2024. Curr Res Toxicol. 2024. PMID: 38562456 Free PMC article.
-
Abnormal iron metabolism in the zona incerta in Parkinson's disease mice.J Neural Transm (Vienna). 2025 Jun;132(6):845-857. doi: 10.1007/s00702-025-02913-3. Epub 2025 Mar 22. J Neural Transm (Vienna). 2025. PMID: 40119221
-
Behavioral analysis of motor and non-motor impairment in rodent models of Parkinson's disease.Front Aging Neurosci. 2024 Dec 23;16:1464706. doi: 10.3389/fnagi.2024.1464706. eCollection 2024. Front Aging Neurosci. 2024. PMID: 39763579 Free PMC article. Review.
-
Research models to study lewy body dementia.Mol Neurodegener. 2025 Apr 23;20(1):46. doi: 10.1186/s13024-025-00837-w. Mol Neurodegener. 2025. PMID: 40269912 Free PMC article. Review.
References
MeSH terms
Substances
Grants and funding
LinkOut - more resources
Full Text Sources
Medical
Miscellaneous
