

The target sign: a significant CT sign for predicting small-bowel ischemia and necrosis
- PMID: 38355906
- PMCID: PMC10942902
- DOI: 10.1007/s11547-024-01793-z
The target sign: a significant CT sign for predicting small-bowel ischemia and necrosis
Abstract
Objective: To investigate the correlation between changes in the thickness and density of diseased small-bowel wall and small-bowel ischemia and necrosis (SBN) on CT imaging when small-bowel obstruction (SBO) occurs.
Methods: We retrospectively analyzed 186 patients with SBO in our hospital from March 2020 to June 2023. The patients were divided into simple SBO (control group) and SBN (case group) groups. We used logistic regression analysis, the chi-square test, and Fisher's exact test to analyze the correlation between the changes in the thickness and density of the diseased intestinal wall and the SBN. A receiver operating characteristic (ROC) curve was used to calculate the accuracy of the multivariate analysis.
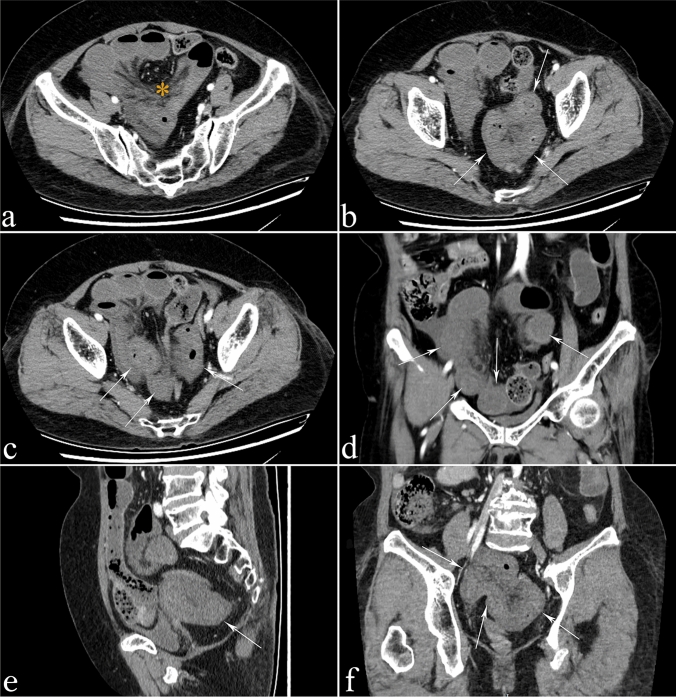
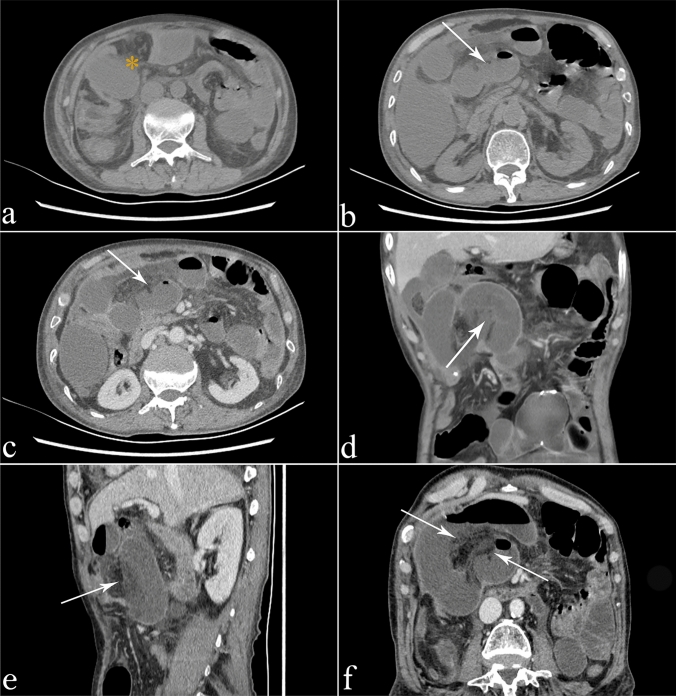
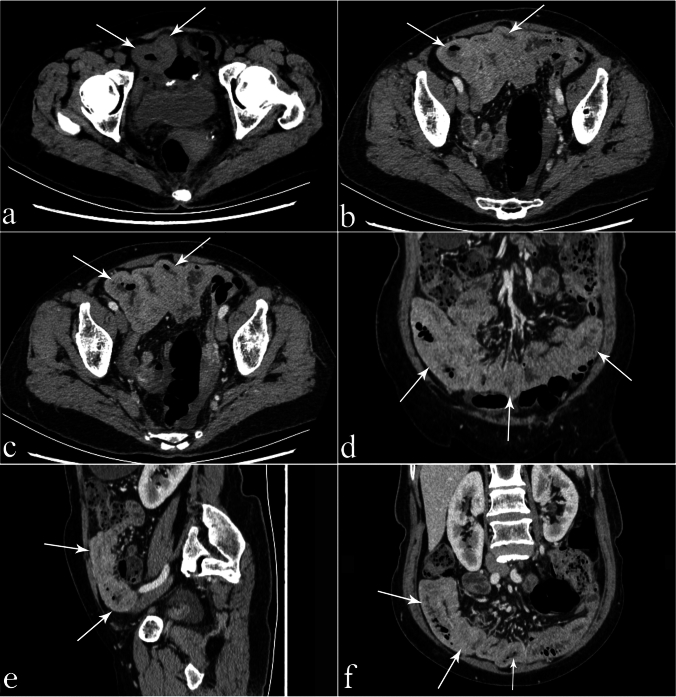
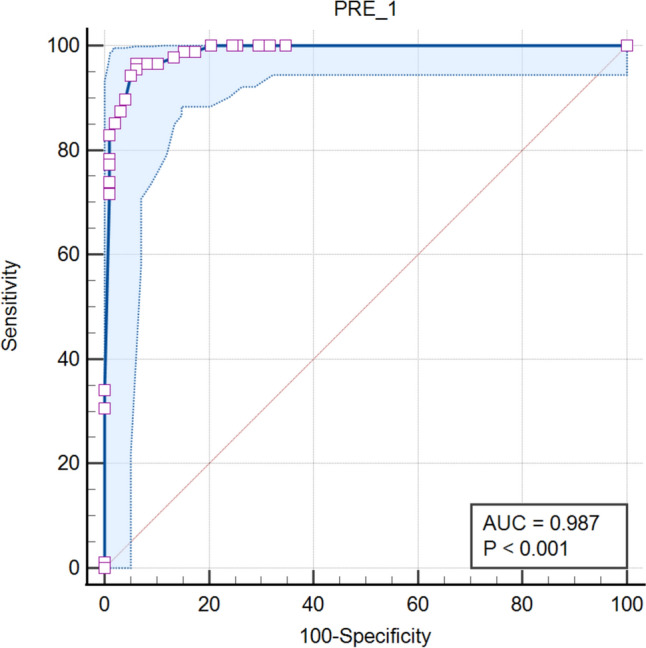
Results: Of the 186 patients with SBO, 98 (52.7%) had simple SBO, 88 (47.3%) had SBN, and the rate of SBN was 47.3% (88/186). Multivariate regression analysis revealed that six CT findings were significantly correlated with SBN (p < 0.05), namely, thickening of the diseased intestinal wall with the target sign (OR = 21.615), thinning of the diseased intestinal wall (OR = 48.106), increase in the diseased intestinal wall density (OR = 13.696), mesenteric effusion (OR = 21.635), decrease in the diseased intestinal wall enhancement on enhanced scanning (OR = 41.662), and increase in the diseased intestinal wall enhancement on enhanced scanning (OR = 15.488). The AUC of the multivariate analysis reached 0.987 (95% CI 0.974-0.999). Specifically, the target sign was easily recognizable on CT images and was a significant CT finding for predicting SBN.
Conclusion: We identified 6 CT findings that were significantly associated with SBN, and may be helpful for clinical treatment.
Keywords: CT scanning; Ischemia and necrosis; Small-bowel obstruction.
© 2024. The Author(s).
Conflict of interest statement
The authors declare that they have no competing interests.
Figures

Similar articles
-
Increased unenhanced bowel-wall attenuation at multidetector CT is highly specific of ischemia complicating small-bowel obstruction.Radiology. 2014 Jan;270(1):159-67. doi: 10.1148/radiol.13122654. Epub 2013 Oct 28. Radiology. 2014. PMID: 24029649
-
Increased unenhanced bowel-wall attenuation: a specific sign of bowel necrosis in closed-loop small-bowel obstruction.Eur Radiol. 2018 Oct;28(10):4225-4233. doi: 10.1007/s00330-018-5402-6. Epub 2018 Apr 20. Eur Radiol. 2018. PMID: 29679213
-
Small bowel obstruction-who needs an operation? A multivariate prediction model.World J Surg. 2010 May;34(5):910-9. doi: 10.1007/s00268-010-0479-3. World J Surg. 2010. PMID: 20217412 Free PMC article.
-
Small bowel obstruction and intestinal ischemia: emphasizing the role of MDCT in the management decision process.Abdom Radiol (NY). 2022 May;47(5):1541-1555. doi: 10.1007/s00261-020-02800-3. Epub 2020 Oct 14. Abdom Radiol (NY). 2022. PMID: 33057806 Review.
-
MDCT findings in small bowel obstruction: implications of the cause and presence of complications on treatment decisions.Abdom Imaging. 2015 Oct;40(7):2248-62. doi: 10.1007/s00261-015-0477-x. Abdom Imaging. 2015. PMID: 26070748 Review.
Cited by
-
Indications for treatment of incidental obturator hernia encountered during transabdominal preperitoneal repair (TAPP).Hernia. 2024 Dec 2;29(1):37. doi: 10.1007/s10029-024-03224-4. Hernia. 2024. PMID: 39623060
-
Development and validation of a nomogram model to predict the risk of strangulated intestinal obstruction.Sci Rep. 2024 Dec 28;14(1):31049. doi: 10.1038/s41598-024-82131-1. Sci Rep. 2024. PMID: 39730785 Free PMC article.
-
Radiological diagnosis of acute mesenteric ischemia in adult patients: a systematic review and meta-analysis.Sci Rep. 2025 Mar 22;15(1):9875. doi: 10.1038/s41598-025-94846-w. Sci Rep. 2025. PMID: 40119151 Free PMC article.
-
Clinical and Radiological Factors Associated with Nonoperative Management Failure for Small Bowel Obstruction: A Retrospective Study from a Resource-Limited Setting.Ther Clin Risk Manag. 2024 Dec 25;20:893-906. doi: 10.2147/TCRM.S496629. eCollection 2024. Ther Clin Risk Manag. 2024. PMID: 39734746 Free PMC article.
References
MeSH terms
LinkOut - more resources
Full Text Sources
Medical
