

Osseointegration of implant surfaces in metabolic syndrome and type-2 diabetes mellitus
- PMID: 38355936
- PMCID: PMC10883641
- DOI: 10.1002/jbm.b.35382
Osseointegration of implant surfaces in metabolic syndrome and type-2 diabetes mellitus
Abstract
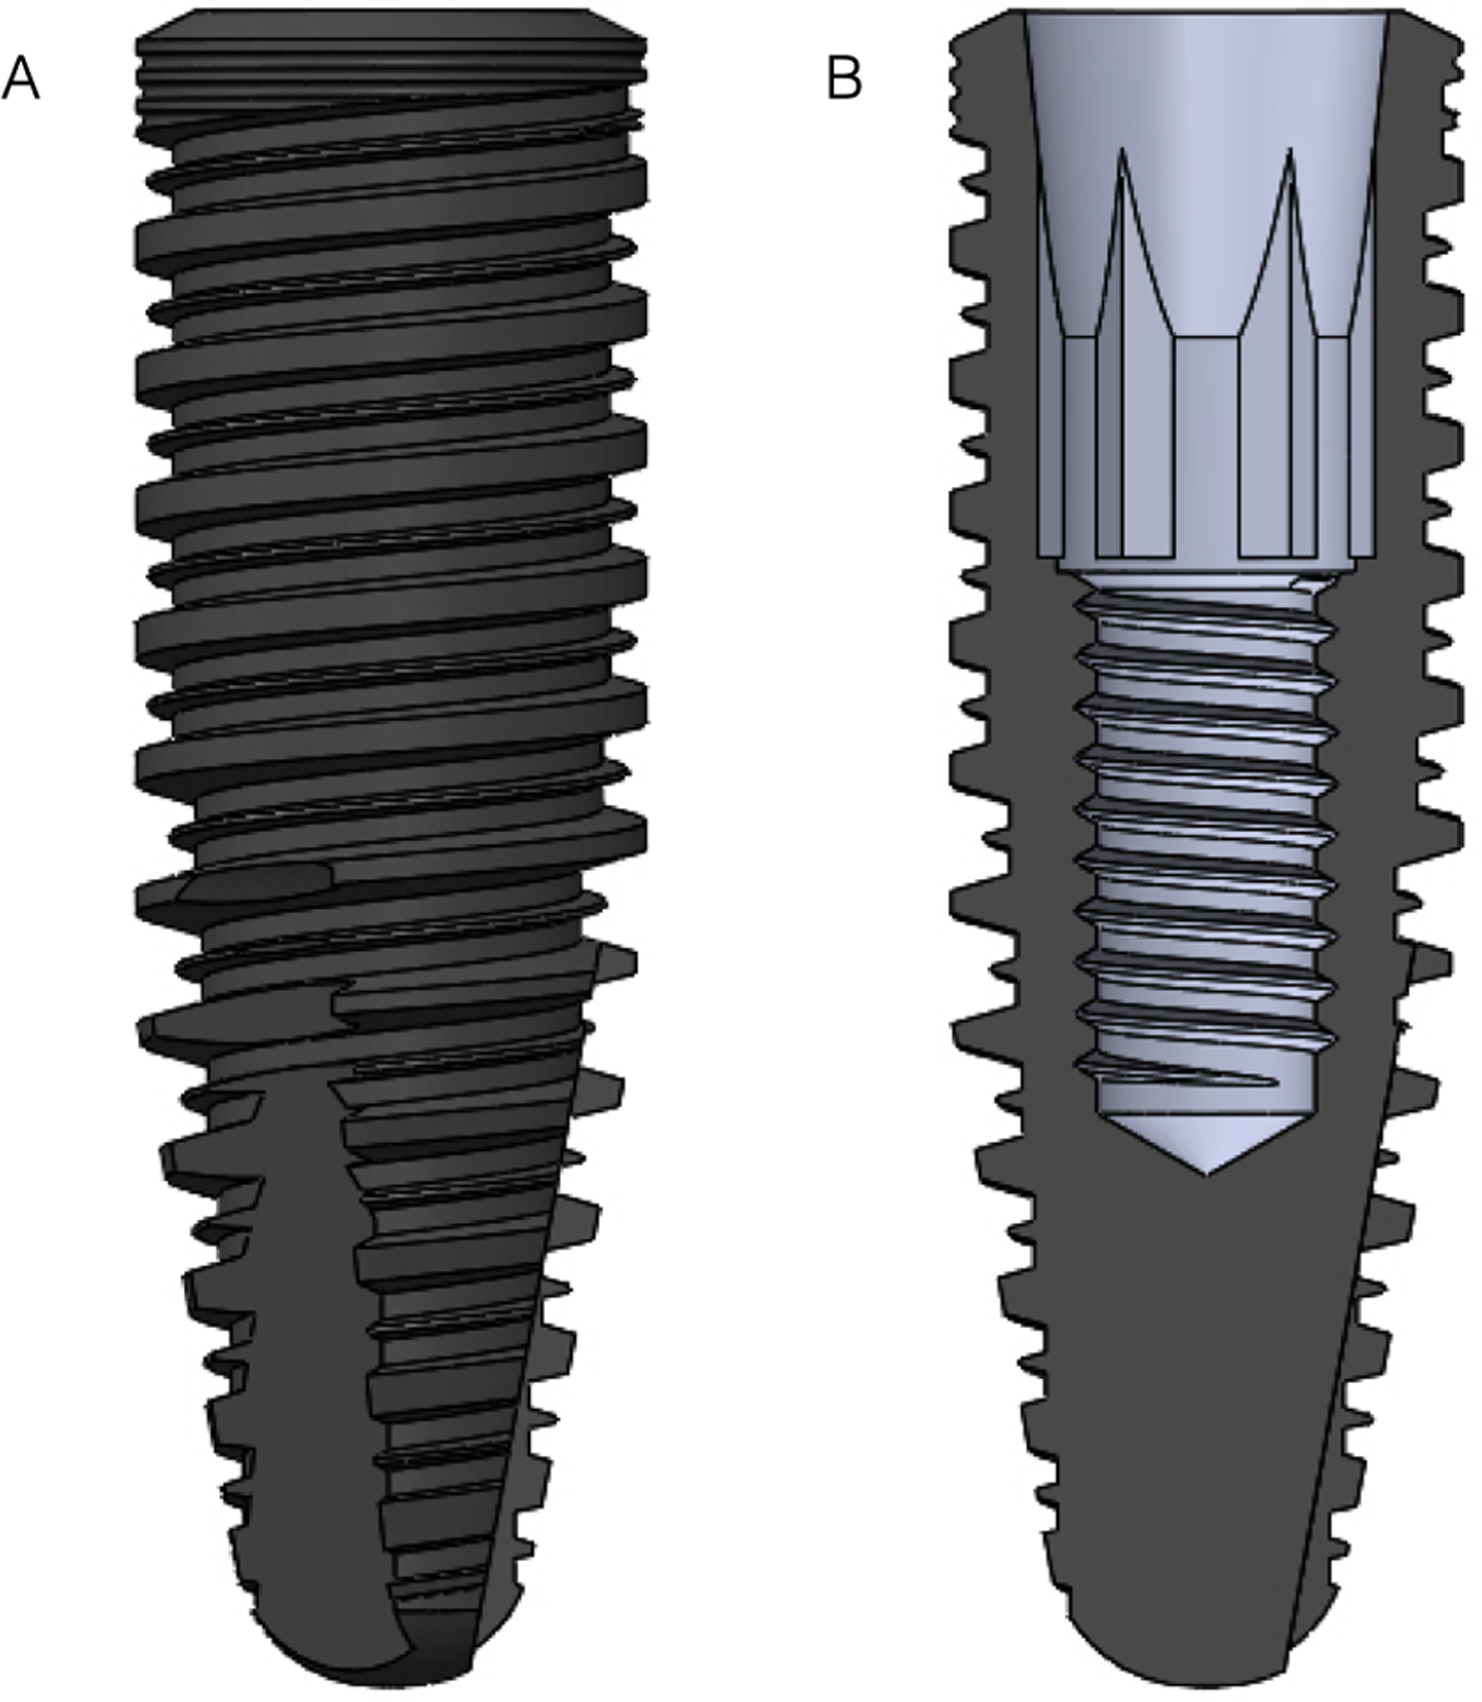
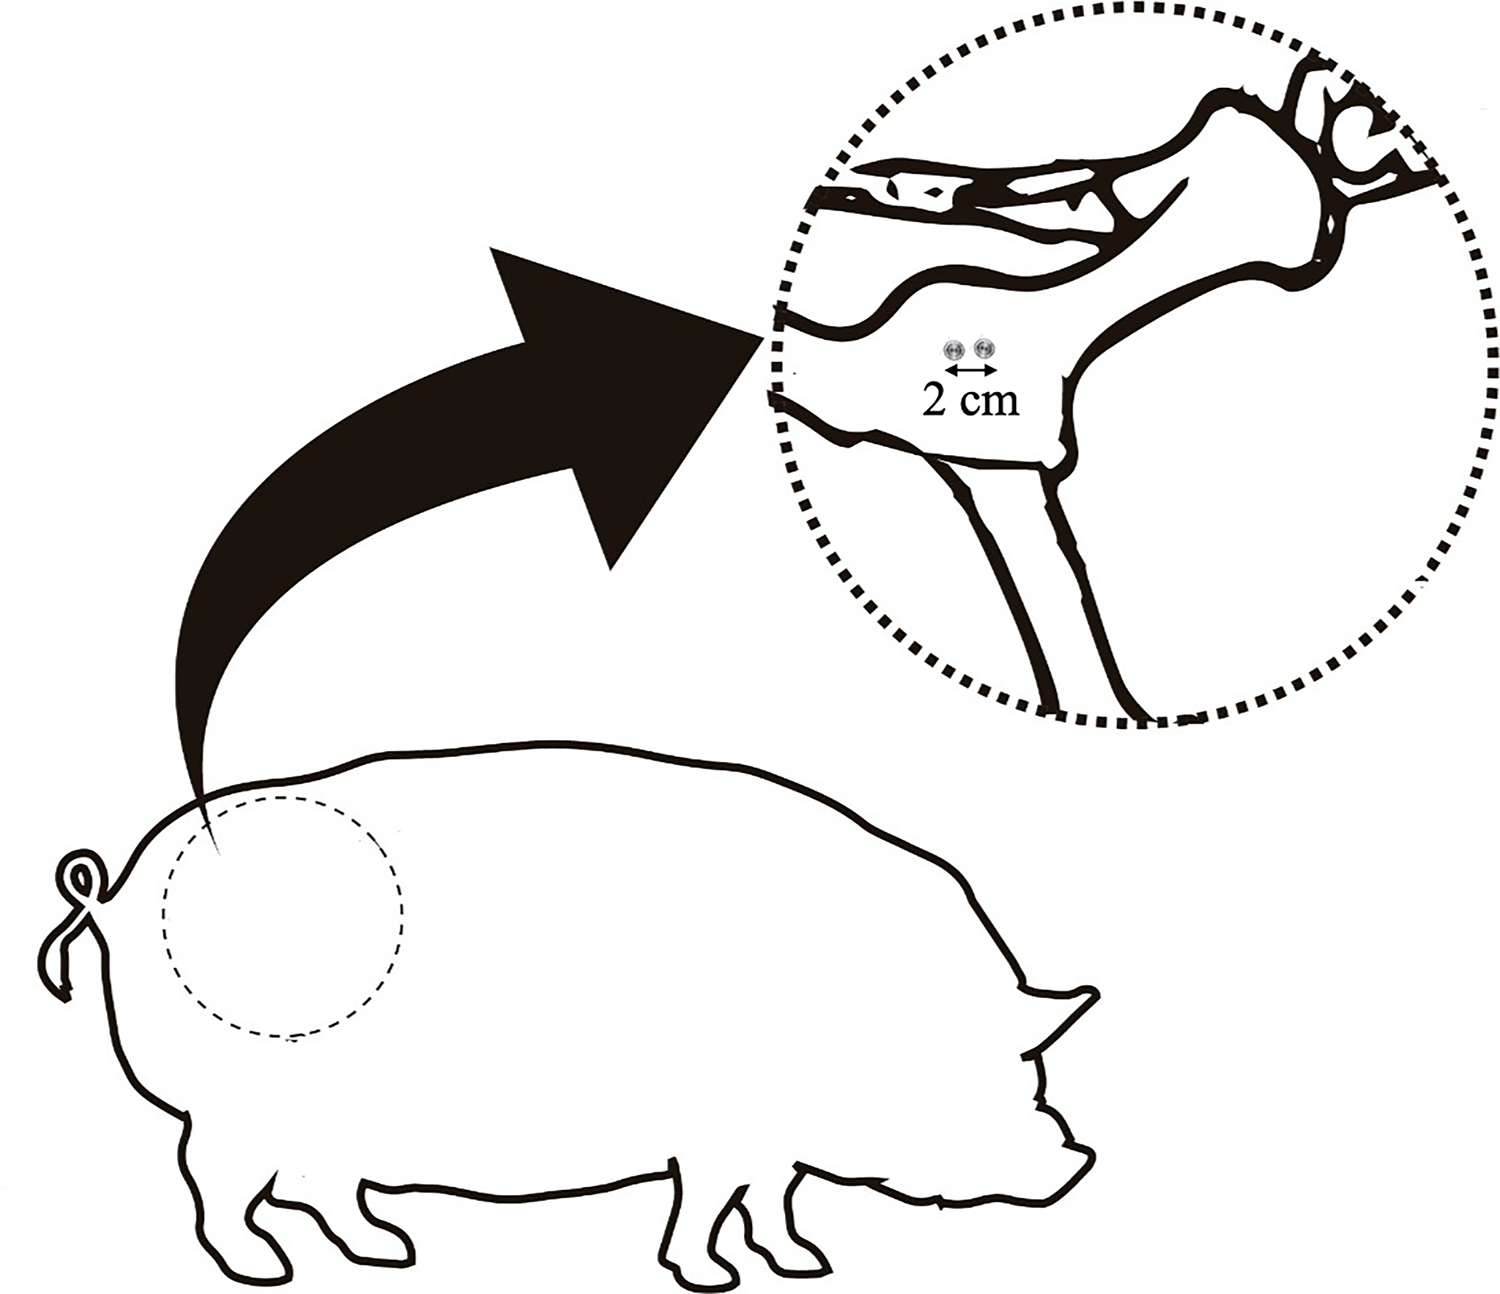
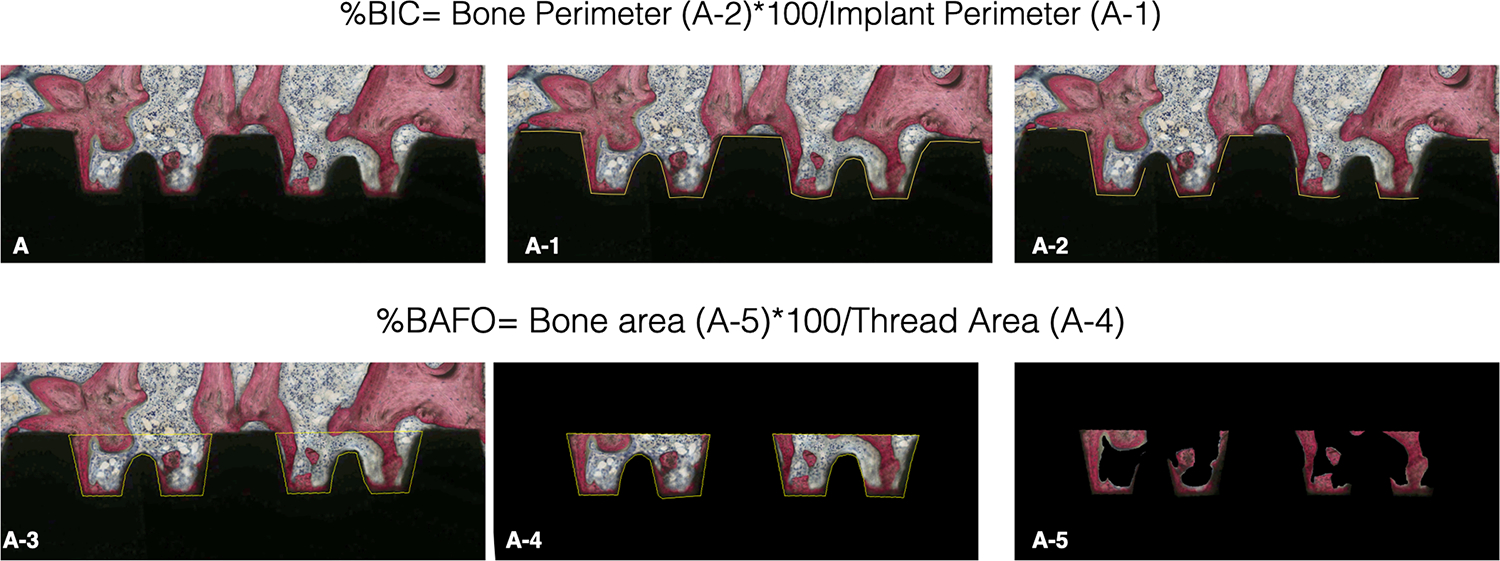
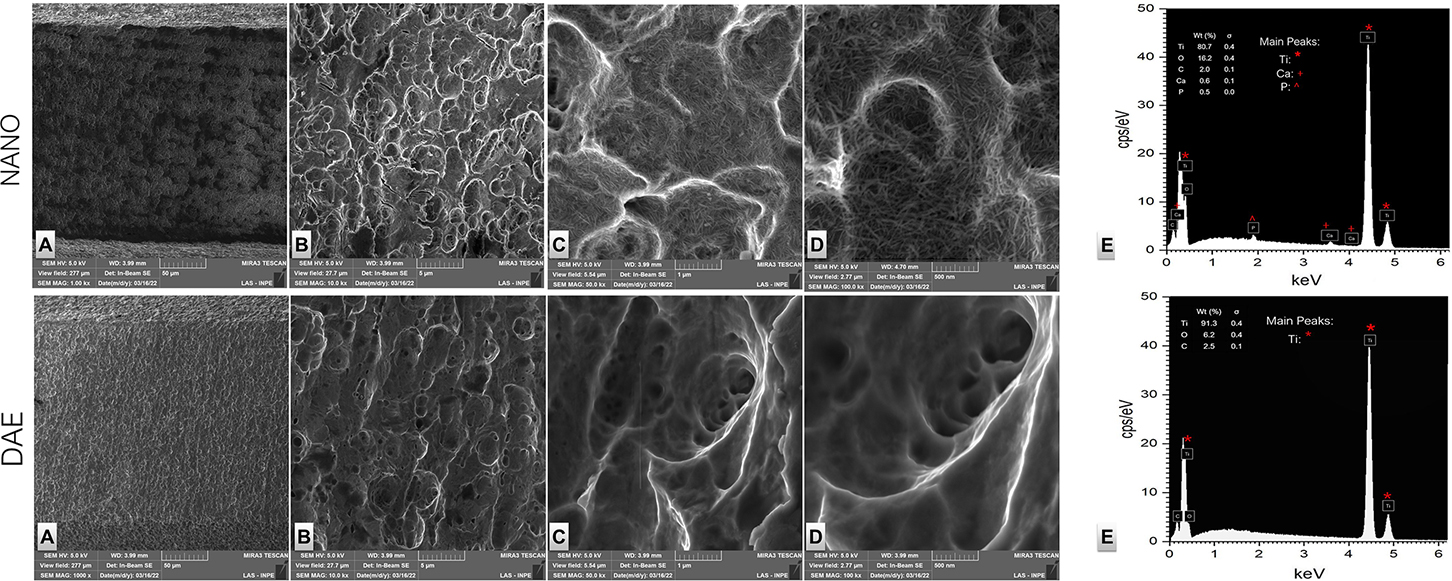
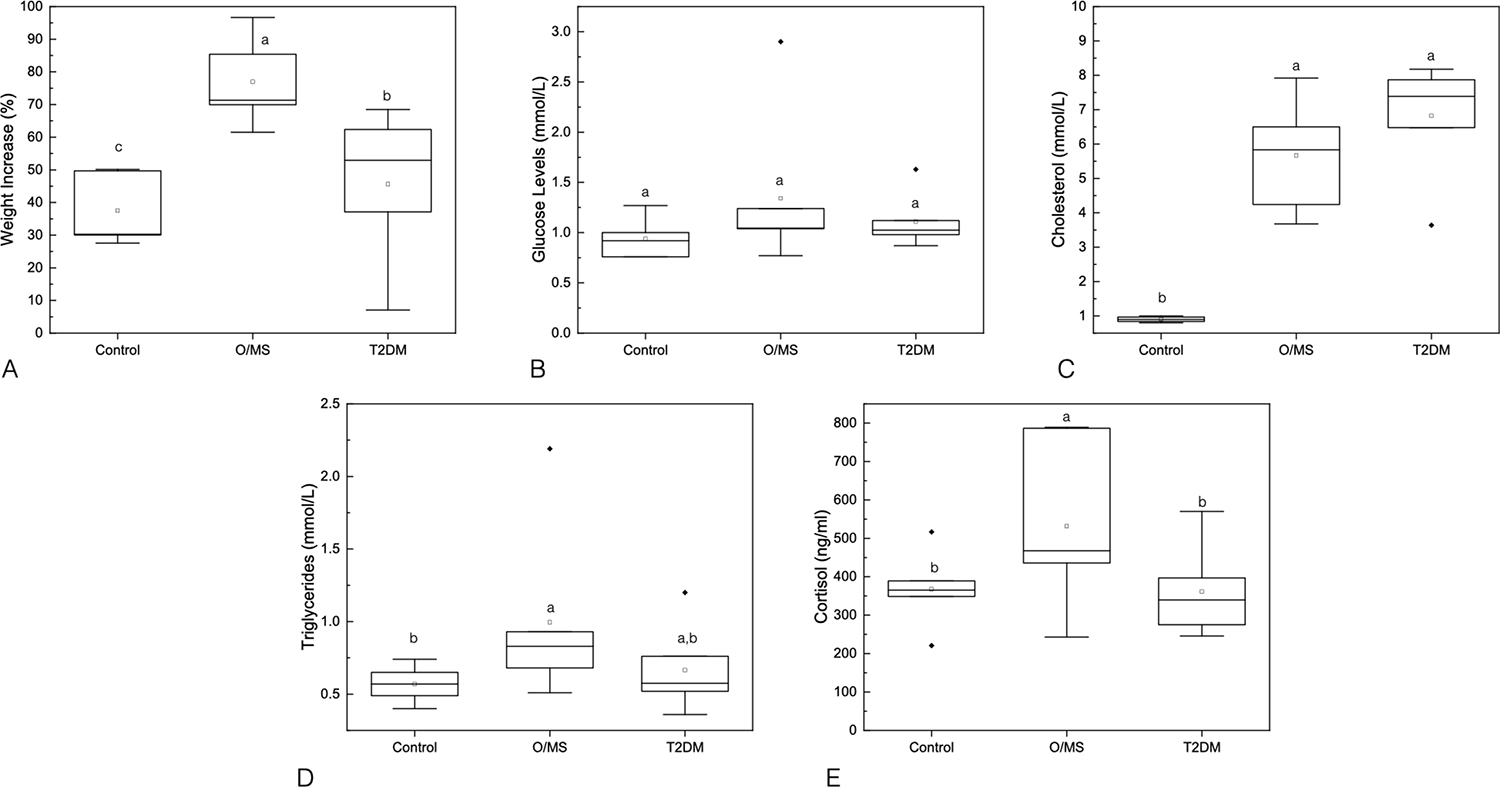
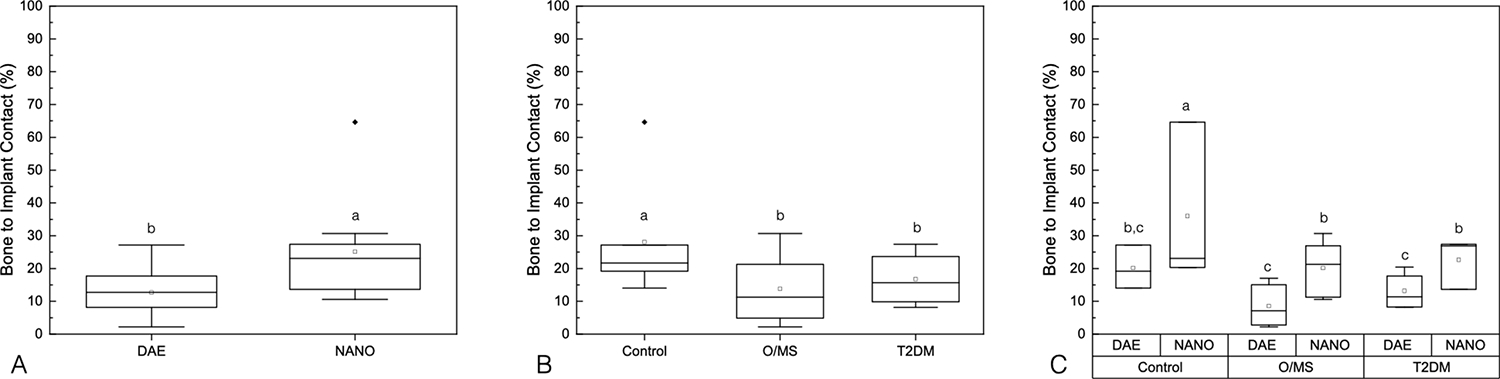
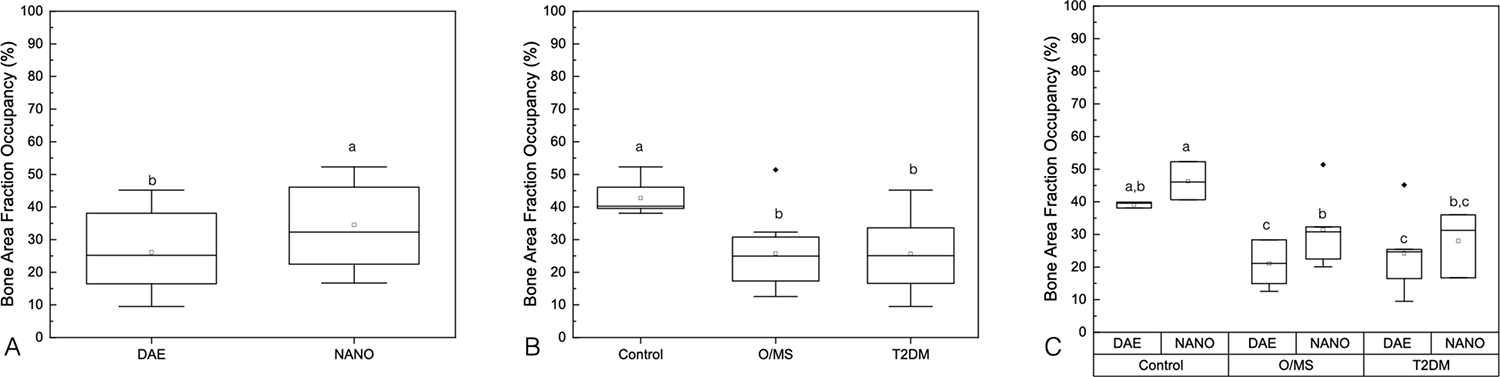
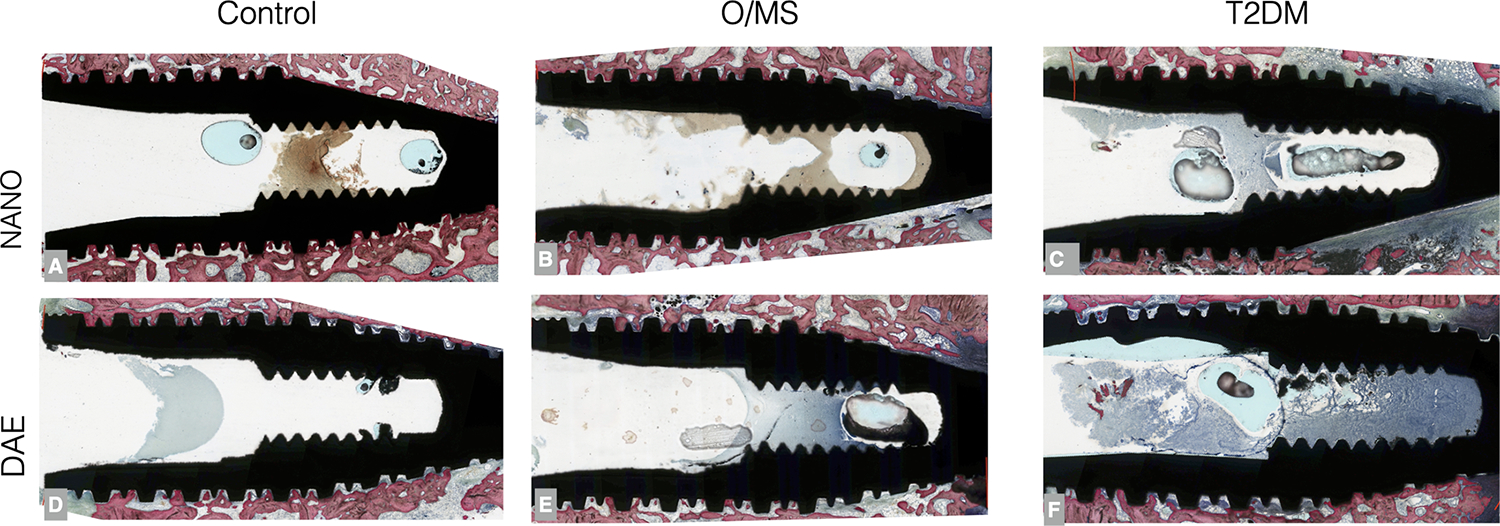
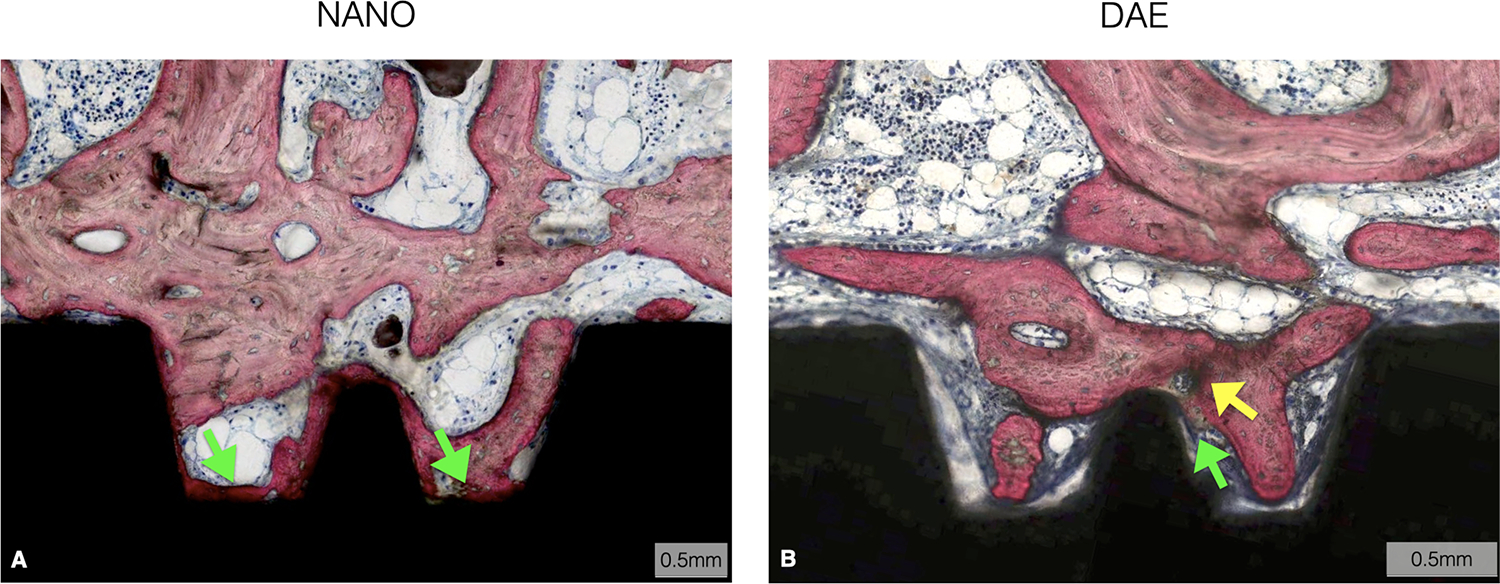
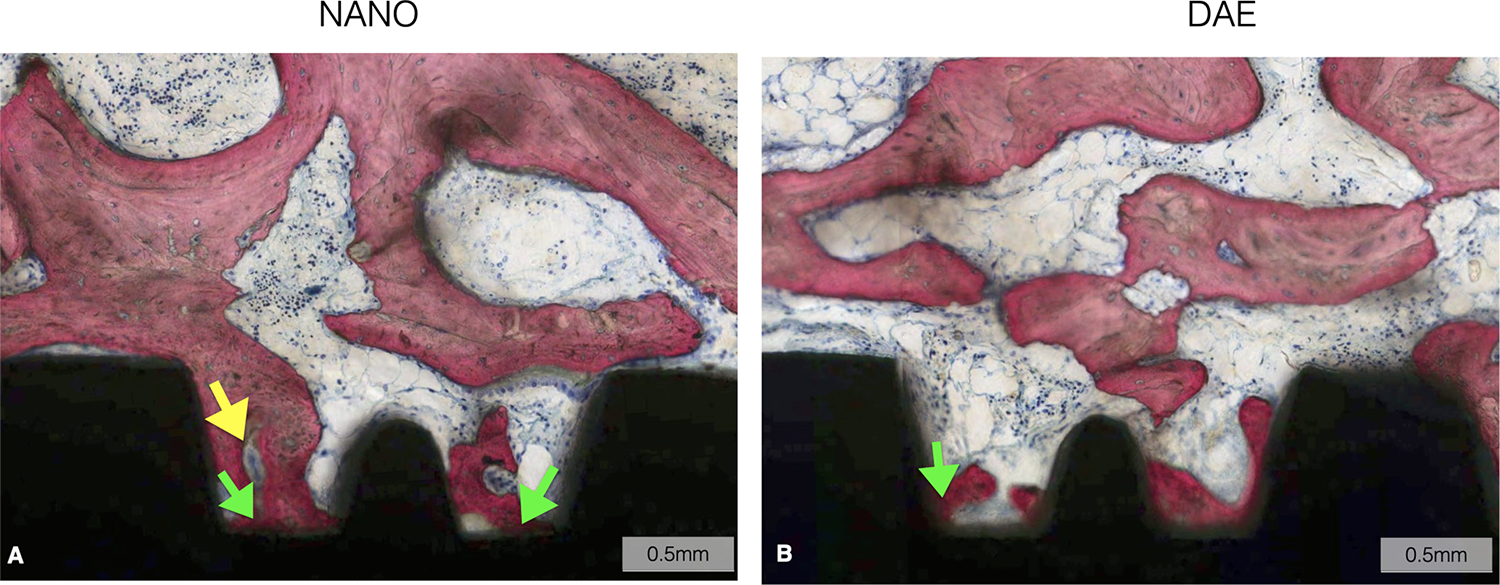
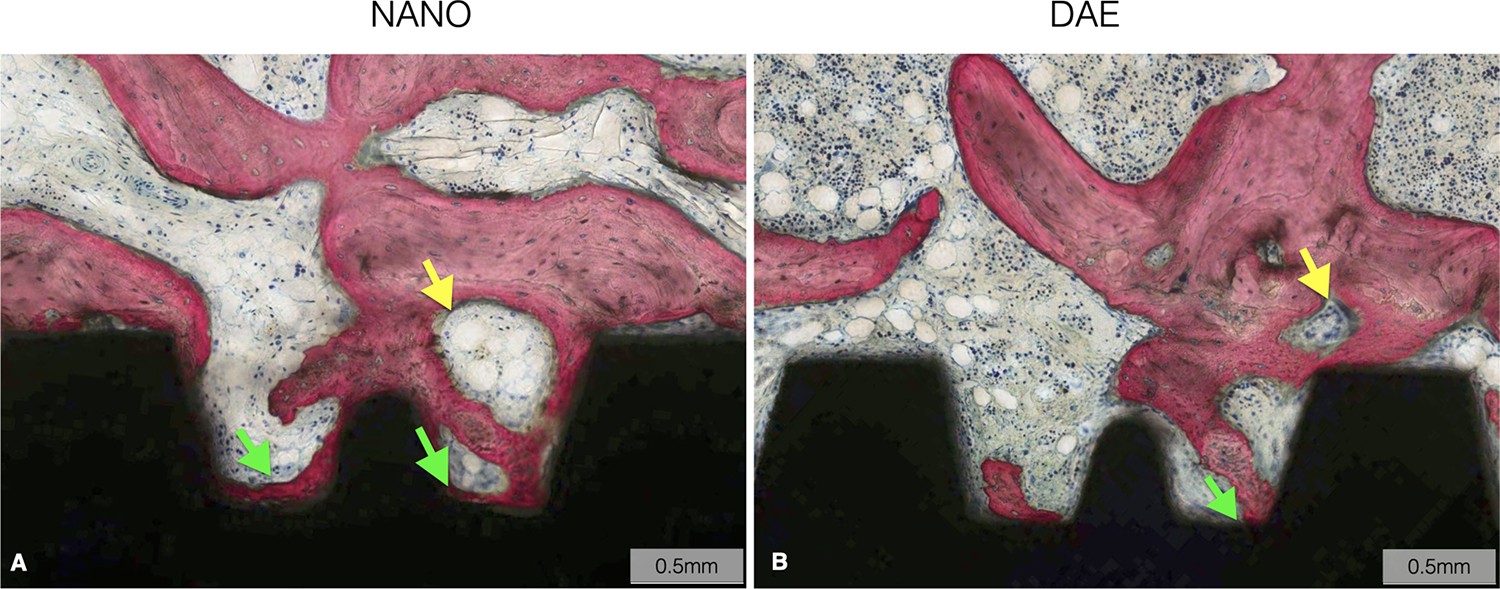
This in vivo study evaluated the bone healing response around endosteal implants with varying surface topography/chemistry in a preclinical, large transitional model induced with metabolic syndrome (MS) and type-2 diabetes mellitus (T2DM). Fifteen Göttingen minipigs were randomly distributed into two groups: (i) control (normal diet, n = 5) and (ii) O/MS (cafeteria diet for obesity induction, n = 10). Following obesity induction, five minipigs from the obese/metabolic syndrome (O/MS) group were further allocated, randomly, into the third experimental group: (iii) T2DM (cafeteria diet + streptozotocin). Implants with different surface topography/chemistry: (i) dual acid-etched (DAE) and (ii) nano-hydroxyapatite coating over the DAE surface (NANO), were placed into the right ilium of the subjects and allowed to heal for 4 weeks. Histomorphometric evaluation of bone-to-implant contact (%BIC) and bone area fraction occupancy (%BAFO) within implant threads were performed using histomicrographs. Implants with NANO surface presented significantly higher %BIC (~26%) and %BAFO (~35%) relative to implants with DAE surface (%BIC = ~14% and %BAFO = ~28%, p < .025). Data as a function of systemic condition presented significantly higher %BIC (~28%) and %BAFO (~42%) in the control group compared with the metabolically compromised groups (O/MS: %BIC = 14.35% and %BAFO = 26.24%, p < .021; T2DM: %BIC = 17.91% and %BAFO = 26.12%, p < .021) with no significant difference between O/MS and T2DM (p > .05). Statistical evaluation considering both factors demonstrated significantly higher %BIC and %BAFO for the NANO surface relative to DAE implant, independent of systemic condition (p < .05). The gain increase of %BIC and %BAFO for the NANO compared with DAE was more pronounced in O/MS and T2DM subjects. Osseointegration parameters were significantly reduced in metabolically compromised subjects compared with healthy subjects. Nanostructured hydroxyapatite-coated surfaces improved osseointegration relative to DAE, regardless of systemic condition.
Keywords: dental implants; metabolic diseases; osseointegration.
© 2024 Wiley Periodicals LLC.
Figures
Similar articles
-
Bone healing around implants placed in subjects with metabolically compromised systemic conditions.J Biomed Mater Res B Appl Biomater. 2023 Sep;111(9):1664-1671. doi: 10.1002/jbm.b.35264. Epub 2023 May 15. J Biomed Mater Res B Appl Biomater. 2023. PMID: 37184298 Free PMC article.
-
The effect of nano hydroxyapatite coating implant surfaces on gene expression and osseointegration.Med Oral Patol Oral Cir Bucal. 2024 May 1;29(3):e326-e333. doi: 10.4317/medoral.26303. Med Oral Patol Oral Cir Bucal. 2024. PMID: 37992148 Free PMC article.
-
In vivo evaluation of cp Ti implants with modified surfaces by laser beam with and without hydroxyapatite chemical deposition and without and with thermal treatment: topographic characterization and histomorphometric analysis in rabbits.Clin Oral Investig. 2017 Mar;21(2):685-699. doi: 10.1007/s00784-016-1936-7. Epub 2016 Aug 16. Clin Oral Investig. 2017. PMID: 27530186
-
Does an Osteoporosis-like Condition Jeopardize the Osseointegration Process Around Dental Implants Placed in Animal Models? A Systematic Review.Int J Oral Maxillofac Implants. 2025 Apr 8;40(2):141-150. doi: 10.11607/jomi.11057. Int J Oral Maxillofac Implants. 2025. PMID: 39485908
-
Anti-diabetic therapies on dental implant success in diabetes mellitus: a comprehensive review.Front Pharmacol. 2024 Dec 11;15:1506437. doi: 10.3389/fphar.2024.1506437. eCollection 2024. Front Pharmacol. 2024. PMID: 39723258 Free PMC article. Review.
Cited by
-
The Effect of Three-Dimensional Stabilization Thread Design on Biomechanical Fixation and Osseointegration in Type IV Bone.Biomimetics (Basel). 2025 Jun 12;10(6):395. doi: 10.3390/biomimetics10060395. Biomimetics (Basel). 2025. PMID: 40558364 Free PMC article.
-
Biomimetic Tissue Engineering Strategies for Craniofacial Applications.Biomimetics (Basel). 2024 Oct 18;9(10):636. doi: 10.3390/biomimetics9100636. Biomimetics (Basel). 2024. PMID: 39451842 Free PMC article. Review.
-
In Vitro Bacterial Growth on Titanium Surfaces Treated with Nanosized Hydroxyapatite.J Funct Biomater. 2025 Feb 16;16(2):66. doi: 10.3390/jfb16020066. J Funct Biomater. 2025. PMID: 39997600 Free PMC article.
References
-
- Ozougwu JCO KC; Belonwu CD; Unakalamba CB The pathogenesis and pathophysiology of type 1 and type 2 diabetes mellitus. Journal of Physiology and Pathophysiology 2013;4(4):12.
-
- Guyton ACH JE Textbook of medical physiology; 2006.
-
- Guthrie RA, Guthrie DW. Pathophysiology of diabetes mellitus. Crit Care Nurs Q 2004;27(2):113–25. - PubMed
-
- King S, Klineberg I, Levinger I, Brennan-Speranza TC. The effect of hyperglycaemia on osseointegration: a review of animal models of diabetes mellitus and titanium implant placement. Arch Osteoporos 2016;11(1):29. - PubMed
-
- Lois K, Kumar S. Obesity and diabetes. Endocrinol Nutr 2009;56 Suppl 4:38–42. - PubMed
Publication types
MeSH terms
Substances
Grants and funding
LinkOut - more resources
Full Text Sources
Medical
