. 2024 Feb 14;15(1):1362.
doi: 10.1038/s41467-024-45585-5.

Oncoprotein SET-associated transcription factor ZBTB11 triggers lung cancer metastasis

Affiliations

Oncoprotein SET-associated transcription factor ZBTB11 triggers lung cancer metastasis

Wenbin Xu et al. Nat Commun. .

Abstract

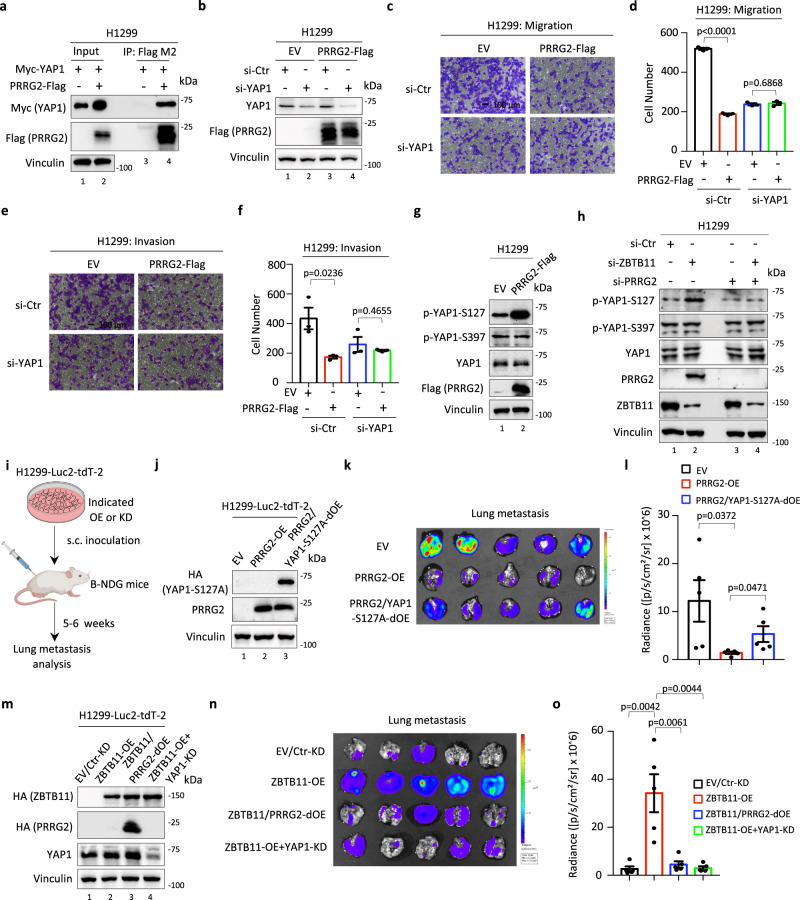
Metastasis is the major cause of lung cancer-related death, but the mechanisms governing lung tumor metastasis remain incompletely elucidated. SE translocation (SET) is overexpressed in lung tumors and correlates with unfavorable prognosis. Here we uncover SET-associated transcription factor, zinc finger and BTB domain-containing protein 11 (ZBTB11), as a prometastatic regulator in lung tumors. SET interacts and collaborates with ZBTB11 to promote lung cancer cell migration and invasion, primarily through SET-ZBTB11 complex-mediated transcriptional activation of matrix metalloproteinase-9 (MMP9). Additionally, by transcriptional repression of proline-rich Gla protein 2 (PRRG2), ZBTB11 links Yes-associated protein 1 (YAP1) activation to drive lung tumor metastasis independently of SET-ZBTB11 complex. Loss of ZBTB11 suppresses distal metastasis in a lung tumor mouse model. Overexpression of ZBTB11 is recapitulated in human metastatic lung tumors and correlates with diminished survival. Our study demonstrates ZBTB11 as a key metastatic regulator and reveals diverse mechanisms by which ZBTB11 modulates lung tumor metastasis.


Conflict of interest statement

The authors declare no competing interests.

Figures

Fig. 1
Fig. 1. Identification of the SET-ZBTB11 protein complex.
a Silver staining and mass spectrometry (MS) analysis of the protein complex purified from control- or SET-overexpressing stable H1299 cells identified ZBTB11. An empty vector (EV) or a Flag-HA-tagged SET (FH-SET)-expressing construct was stably transfected into H1299 cells, and the protein complex from the nuclear fraction of the indicated cells was tandemly purified by immobilized anti-Flag and anti-HA agarose. 7 unique out of 9 peptides corresponding to ZBTB11 were identified from the FH-SET-containing protein complex. b Coimmunoprecipitation (Co-IP)-Western blot (WB) analysis of the SET-ZBTB11 complex in H1299-EV or H1299-FH-SET cells purified by anti-Flag agarose. c Co-IP-WB analysis of the SET-ZBTB11 interaction in HEK293T cells transiently transfected with Myc-tagged SET (Myc-SET) with or without S protein-Flag-streptavidin-binding protein-tagged ZBTB11 (SFB-ZBTB11). Co-IP-WB analysis of the interaction between endogenous SET and ZBTB11 in H1299 cells by anti-SET (d) or anti-ZBTB11 (e) antibody. f WB analysis of ZBTB11 and SET in the cytoplasmic or nuclear fraction of H1299 cells. g Immunofluorescence assay of endogenous SET and ZBTB11 in H1299 cells. DAPI was used to counterstain the nucleus. h In vitro pull-down analysis of the direct binding between purified full-length SET and ZBTB11. In vitro pull-down analysis of the domain(s) of SET (i) or ZBTB11 (j) responsible for mediating their physical interaction. Source data are provided as a Source Data file. * indicates GST or GST-fusion protein.
Fig. 2
Fig. 2. ZBTB11 acts as a transcription factor in lung cancer cells.
a WB analysis of ZBTB11 knockdown efficiency in H1299 cells transiently transfected with control siRNA (si-Ctr) or two individual siRNAs targeting ZBTB11 (si-ZBTB11) for 96 h. b Volcano plot revealing the differentially expressed genes upon ZBTB11 knockdown in H1299 cells (n = 2 biologically independent samples). The p-values were determined by Wald test. c Pie-plot showing the category of the differentially expressed genes upon ZBTB11 knockdown in H1299 cells. d Distribution of ZBTB11 ChIP-seq reads and heatmap of binding signals around the 10-kb windows centered on the transcription start site (TSS) of genes. e The ZBTB11 binding motif discovered de novo from ZBTB11-high peaks in ChIP-seq. f Venn diagram of the genes with ZBTB11 enrichment analyzed by ChIP-seq. ChIP with normal IgG served as a negative control. g Venn diagram showing putative ZBTB11 direct target genes by combinational analyses of both RNA-seq and ChIP-seq datasets. h Heatmap of putative ZBTB11 direct target genes with upregulation or downregulation upon ZBTB11 depletion. i Gene Ontology (GO) analysis of the top 10 biological processes enriched by the differentially expressed putative ZBTB11 direct target genes. The p-value was determined by one-sided hypergeometric test. Source data are provided as a Source Data file.
Fig. 3
Fig. 3. SET cooperates with ZBTB11 in transcriptional regulation.
a WB analysis of SET knockdown efficiency in H1299 cells transiently transfected with control siRNA (si-Ctr) or siRNAs targeting SET (si-SET) for 96 h. b Volcano map of the differentially expressed genes upon SET knockdown in H1299 cells (n = 2 biologically independent samples). The p-value was determined by Wald test. c Pie-plot showing the category of the differentially expressed genes upon SET knockdown in H1299 cells. d Venn diagram of the ZBTB11 target genes coregulated by SET. e Correlation analysis of SET/ZBTB11-regulated genes revealing that SET and ZBTB11 synergistically modulate transcription. Pearson’s correlation analysis was performed to calculate correlation coefficients and p-values. The genes related to extracellular matrix organization were highlighted with red. f GO analysis of the top 10 biological processes enriched by the SET-regulated ZBTB11 direct target genes. The p-values were determined by hypergeometric test. g RT–qPCR analysis of representative genes in H1299 cells with SET or ZBTB11 knockdown, individually or together. Data were shown as the mean ± S.E.M., n = 2 experimental replicates. Source data are provided as a Source Data file.
Fig. 4
Fig. 4. SET-ZBTB11 complex promotes lung cancer cell metastasis.
a WB analysis of ZBTB11 knockdown efficiency in H1299-EV or H1299-FH-SET stable cells transiently transfected with control siRNA (si-Ctr) or siRNA targeting ZBTB11 (si-ZBTB11) for 96 h. Cell migration (b, c) or invasion (d, e) of H1299-EV or H1299-FH-SET stable cells depleted with or without ZBTB11. Data were shown as the mean ± S.E.M., n = 3 biologically independent samples. The p-value was determined by two-sided t-test. f WB analysis of SET knockdown efficiency in H1299-EV or H1299-ZBTB11-SFB stable cells transiently transfected with control siRNA (si-Ctr) or siRNA targeting SET (si-SET) for 96 h. Cell migration (g, h) or invasion (i, j) of H1299-EV or H1299-ZBTB11-SFB cells depleted with or without SET. Data were shown as the mean ± S.E.M., n = 3 biologically independent samples. The p-value was determined by two-sided t-test. k WB analysis of SET and ZBTB11 knockdown efficiency in H1299 cells transiently transfected with control siRNA (si-Ctr) or siRNA against SET or ZBTB11 (si-SET or si-ZBTB11) for 96 h. Cell migration (l, m) or invasion (n, o) of H1299 cells upon SET and/or ZBTB11 depletion. Data were shown as the mean ± S.E.M., n = 3 biologically independent samples. The p-value was determined by two-sided t-test. p Schematic diagram (created with BioRender) of the workflow for analyzing tumor metastasis in vivo. q WB analysis of SET and ZBTB11 knockdown efficiency in H1299-Luc2-tdT-2 cells stably transfected with control shRNA (sh-Ctr) or shRNA targeting SET and/or ZBTB11 (sh-SET and/or sh-ZBTB11). r Bioluminescent image of lung metastasis from the primary tumors in a mouse model where H1299-Luc2-tdT-2 cells with or without SET/ZBTB11 knockdown were subcutaneously inoculated into the flanks of immunodeficient B-NDG (NSG) mice. s Quantitative analysis of the metastasis of cancer cells in the lung based on (r). Data were shown as the mean ± S.E.M., n = 5 mice per group. The p-value was determined by two-sided t-test. Source data are provided as a Source Data file.
Fig. 5
Fig. 5. MMP9 is a downstream effector of the SET-ZBTB11 complex in metastatic regulation.
a WB analysis of ZBTB11 in H1299-EV or H1299-MMP9-Flag stable cells upon endogenous ZBTB11 depletion. Cell migration (b, c) or invasion (d, e) of H1299-EV or H1299-MMP9-Flag stable cells upon ZBTB11 depletion (mean ± S.E.M., n = 3 biologically independent samples, two-sided t-test). f WB analysis of SET in H1299-EV or H1299-MMP9-Flag stable cells upon endogenous SET depletion. Cell migration (g, h) or invasion (i, j) of H1299-EV or H1299-MMP9-Flag stable cells upon SET depletion (mean ± S.E.M., n = 3 biologically independent samples, two-sided t-test). k ChIP–qPCR analysis of the enrichment of ZBTB11 and SET at MMP9 loci in H1299 cells (mean ± S.E.M., n = 3 experimental replicates, two-sided t-test). l Re-ChIP–qPCR analysis of SET binding to MMP9 loci following primary ChIP with anti-ZBTB11 antibody in H1299 cells (mean ± S.E.M., n = 3 experimental replicates, two-sided t-test). m ChIP–qPCR analysis of SET enrichment at MMP9 loci in H1299-ZBTB11-iKO cells upon doxycycline (Doxy) treatment (mean ± S.E.M., n = 3 experimental replicates, two-sided t-test). n ChIP–qPCR analysis of ZBTB11 enrichment at MMP9 loci in H1299-EV or H1299-FH-SET stable cells (mean ± S.E.M., n = 3 experimental replicates, two-sided t-test). o Luciferase assays of SET/ZBTB11-driven transcriptional of MMP9. The EV or FH-ZBTB11 construct was transfected into H1299-EV or H1299-FH-SET stable cells, together with luciferase reporter and Renilla control vector, for 24 h (mean ± S.E.M., n = 3 experimental replicates, two-sided t-test). p Schematic diagram (created with BioRender) of the workflow for analyzing tumor metastasis in vivo. q WB analysis of ZBTB11 and MMP9 in H1299-Luc2-tdT-2 cells stably transfected with the ZBTB11-expressing construct (ZBTB11-OE) and/or shRNA targeting MMP9 (MMP9-KD). r Bioluminescent image of lung metastasis from the primary tumors in a mouse model where H1299-Luc2-tdT-2 cells with ZBTB11-OE/MMP9-KD were subcutaneously inoculated into the flanks of immunodeficient B-NDG (NSG) mice. s Quantitative analysis of the metastasis of cancer cells in the lung based on (r) (mean ± S.E.M., n = 4 mice per group, two-sided t-test). c, h shared the same si-Ctr group for quantitative analysis; (e) and (j) shared the same si-Ctr group for quantitative analysis. Source data are provided as a Source Data file.
Fig. 6
Fig. 6. Transcriptional repression of PRRG2 contributes to ZBTB11-induced metastasis independently of the SET-ZBTB11 complex.
a WB analysis of ectopic PRRG2 in H1299-EV or H1299-PRRG2-Flag stable cell lines. Cell migration (b, c) or invasion (d, e) of H1299-EV or H1299-PRRG2-Flag stable cells (mean ± S.E.M., n = 3 biologically independent samples, two-sided t-test). f RT–qPCR analysis of ZBTB11 or PRRG2 expression in H1299 cells depleted with or without ZBTB11 or PRRG2 for 96 h (mean ± S.E.M., n = 2 experimental replicates). Cell migration (g, h) or invasion (i, j) assays of H1299 cells with ZBTB11 or PRRG2 depletion, individually or together (mean ± S.E.M., n = 3 biologically independent samples, two-sided t-test). k ChIP-seq and ChIP–qPCR analysis of ZBTB11 enrichment on the PRRG2 promoter in H1299 cells (mean ± S.E.M., n = 2 experimental replicates). l Luciferase assays of ZBTB11-driven transcriptional regulation of PRRG2 (mean ± S.E.M., n = 2 experimental replicates). The luciferase reporter containing the ZBTB11-binding element of the PRRG2 promoter and Renilla control were transfected into the cells as indicated for 24 h. For ZBTB11 depletion, siRNA against ZBTB11 was used. For overexpression of ZBTB11, the H1299-ZBTB11-SFB stable cell line was used. The ZBTB11 knockdown efficiency or the expression of ectopic ZBTB11 was validated by WB assay. m Schematic diagram (created with BioRender) of the workflow for analyzing tumor metastasis in vivo. n WB analysis of ZBTB11 and PRRG2 in H1299-Luc2-tdT-2 cells stably knocked down with ZBTB11 (ZBTB11-KD) and/or PRRG2 (PRRG2-KD). o Bioluminescent image of lung metastasis from the primary tumors in a mouse model where H1299-Luc2-tdT-2 cells with ZBTB11-KD and/or PRRG2-KD were subcutaneously inoculated into the flanks of immunodeficient B-NDG (NSG) mice. p Quantitative analysis of the metastasis of cancer cells in the lung based on (o) (mean ± S.E.M., n = 5 mice per group, two-sided t-test). Source data are provided as a Source Data file.
Fig. 7
Fig. 7. ZBTB11-PRRG2 axis links YAP1 for metastatic regulation.
a Co-IP-WB assay of the interaction between YAP1 and PRRG2 in H1299 cells transfected with or without Myc-YAP1 and PRRG2-Flag, as indicated. b WB analysis of YAP1 knockdown in H1299-EV or H1299-PRRG2-Flag cells transfected with control siRNA (si-Ctr) or siRNA against YAP1 (si-YAP1) for 96 h. Cell migration (c, d) or invasion (e, f) of H1299-EV or H1299-PRRG2-Flag cells with or without YAP1 depletion (mean ± S.E.M., n = 3 biologically independent samples, two-sided t-test). g WB analysis of YAP1 phosphorylation in H1299-EV and H1299-PRRG2-Flag stable cells with the indicated antibodies. h WB analysis of YAP1 phosphorylation in H1299 cells with or without ZBTB11 and/or PRRG2 depletion, as indicated, for 48 h. i Schematic diagram of the workflow for analyzing tumor metastasis in vivo. j WB analysis of PRRG2 and YAP1 in H1299-Luc2-tdT-2 cells stably expressing PRRG2 (PRRG2-OE) and/or the YAP1-S127A construct (YAP1-S127A-OE). k Bioluminescent image of lung metastasis from the primary tumors in a mouse model where H1299-Luc2-tdT-2 cells with PRRG2-OE and/or YAP1-S127A-OE were subcutaneously inoculated into the flanks of immunodeficient B-NDG (NSG) mice. l Quantitative analysis of the metastasis of cancer cells in the lung based on (k) (mean ± S.E.M., n = 5 mice per group, two-sided t-test). m WB analysis of ZBTB11, PRRG2 and YAP1 in H1299-Luc2-tdT-2 cells stably expressing the ZBTB11 (ZBTB11-OE) and/or PRRG2 (PRRG2-OE) construct and/or depleted of YAP1 (YAP-KD), as indicated. n Bioluminescent image of lung metastasis from the primary tumors in a mouse model where H1299-Luc2-tdT-2 cells with ZBTB11-OE, PRRG2-OE and/or YAP1-KD were subcutaneously inoculated into the flanks of immunodeficient B-NDG (NSG) mice. o Quantitative analysis of the metastasis of cancer cells in the lung based on (n) (mean ± S.E.M., n = 5 mice per group, two-sided t-test). Source data are provided as a Source Data file.
Fig. 8
Fig. 8. Loss of ZBTB11 suppresses genetic aberration-induced lung tumor metastasis.
a Schematic diagram (created with BioRender) of the strategy to establish a metastatic lung tumor mouse model. b IVIS of the primary lung tumors in KLLE and KLLE-Zbtb11Fl/Fl mice at approximately 9 weeks after Ad-Cre inhalation. c Ex vivo bioluminescent assays of biopsied lung tissues derived from KLLE or KLLE-Zbtb11Fl/Fl mice showing primary lung tumor formation. d Quantitative analysis of primary lung tumor formation in (c). Data were shown as boxplots with medians, interquartile ranges and lower/upper whiskers, n = 5 mice per group. The p-values were determined by two-way ANOVA. e Ex vivo bioluminescent assays of biopsied metastatic tumors in the liver, kidney, spleen and intestine derived from KLLE or KLLE-Zbtb11Fl/Fl mice. Quantitative analysis of metastatic tumors in the liver (f), kidney (g), spleen (h) and intestine (i) based on (e). Data were shown as boxplots with medians, interquartile ranges and lower/upper whiskers, n = 5 mice per group. The p-values were determined by two-way ANOVA. j Overall survival (OS) analysis of KLLE or KLLE-Zbtb11Fl/Fl mice with lung tumor onset induced by Ad-Cre virus inhalation. The p-value was determined by log-rank test. Source data are provided as a Source Data file.
Fig. 9
Fig. 9. Dysfunction of ZBTB11 and SET correlates with a poor prognosis of lung cancer.
a The positive correlation of high expression of both ZBTB11 and SET with LUAD based on the TCGA database. b The relationship of ZBTB11 and SET expression with the stages of LUAD based on the TCGA database. c The relationship of ZBTB11 and SET expression with the lymph node metastatic status of LUAD based on the TCGA database. N0: no regional lymph node metastasis; N1: 1–3 axillary lymph node metastases; N2: 4–9 axillary lymph node metastases; N3: ≥10 axillary lymph node metastases. Data were shown as boxplots with medians, interquartile ranges and lower/upper whiskers in (ac). The p-values were determined by two-sided t-test. d The positive correlation of the expression between ZBTB11 and SET in lung tissues based on TCGA database. Pearson’s correlation analysis was performed to determine correlation coefficients and p-values. The gray band represents the 95% confidence interval band. e Representative and quantitative IHC of ZBTB11 and SET in LUAD tissue arrays containing primary lung tumors with paired adjacent normal lung tissues and long-distance metastatic tumors from primary LUAD. Data were shown as mean±S.E.M. The p-values were determined by one-sided t-test. f The positive correlation of the expression between ZBTB11 and SET in lung tissue arrays. Pearson’s correlation analysis was performed to determined correlation coefficients and p-values. The gray band represents the 95% confidence interval band. g Kaplan–Meier plots of lung cancer patients stratified by ZBTB11, SET, MMP9, and PRRG2 expression levels, based on GEO dataset (GSE30219). The p-values were determined by log-rank test. Source data are provided as a Source Data file.

References

    1. Sung H, et al. Global cancer statistics 2020: GLOBOCAN estimates of incidence and mortality worldwide for 36 cancers in 185 countries. CA Cancer J. Clin. 2021;71:209–249. doi: 10.3322/caac.21660. - DOI - PubMed
    1. Travis WD, et al. The 2015 World Health Organization classification of lung tumors: impact of genetic, clinical and radiologic advances since the 2004 classification. J. Thorac. Oncol. 2015;10:1243–1260. doi: 10.1097/JTO.0000000000000630. - DOI - PubMed
    1. Hanahan D, Weinberg RA. Hallmarks of cancer: the next generation. Cell. 2011;144:646–674. doi: 10.1016/j.cell.2011.02.013. - DOI - PubMed
    1. Hanahan D. Hallmarks of cancer: new dimensions. Cancer Discov. 2022;12:31–46. doi: 10.1158/2159-8290.CD-21-1059. - DOI - PubMed
    1. von Lindern M, et al. Can, a putative oncogene associated with myeloid leukemogenesis, may be activated by fusion of its 3’ half to different genes: characterization of the set gene. Mol. Cell. Biol. 1992;12:3346–3355. - PMC - PubMed