. 2024 Feb 14;14(1):3694.
doi: 10.1038/s41598-024-53999-w.

An inflamed tumor cell subpopulation promotes chemotherapy resistance in triple negative breast cancer

Affiliations

An inflamed tumor cell subpopulation promotes chemotherapy resistance in triple negative breast cancer

Mauricio Jacobo Jacobo et al. Sci Rep. .

Abstract

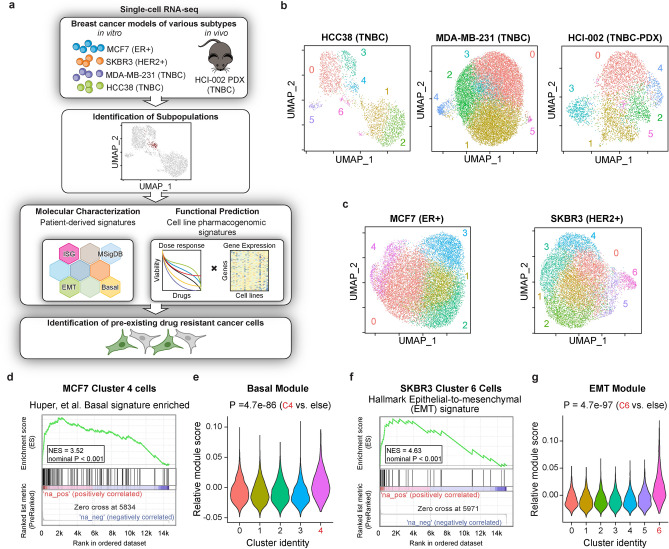
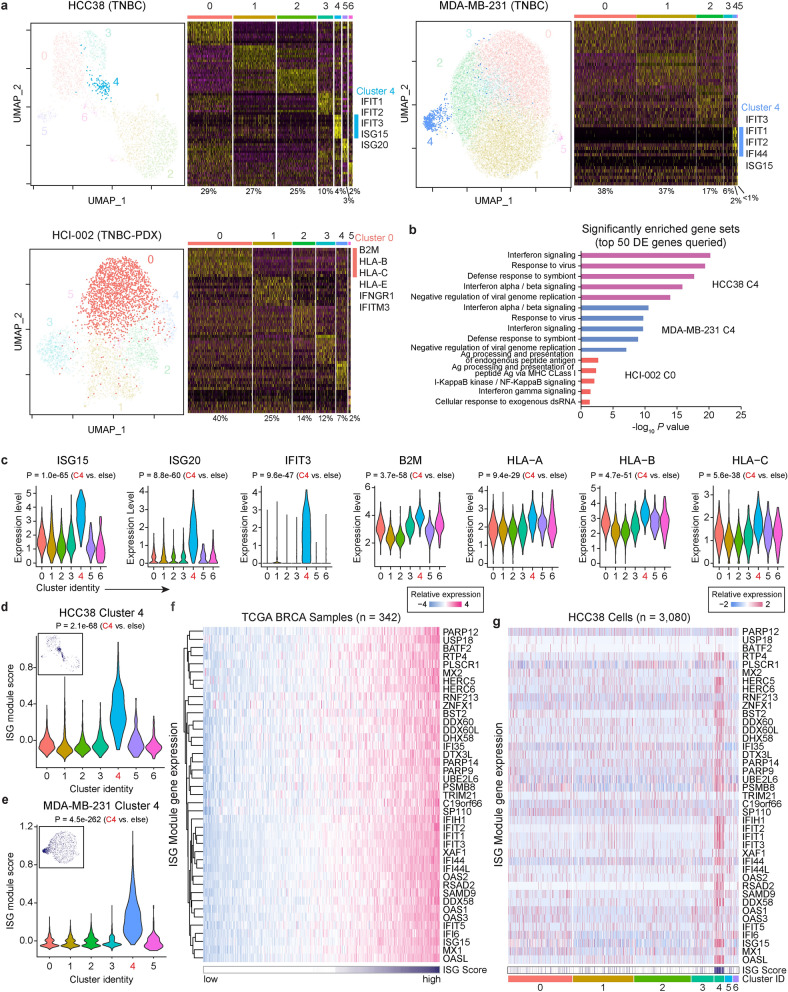
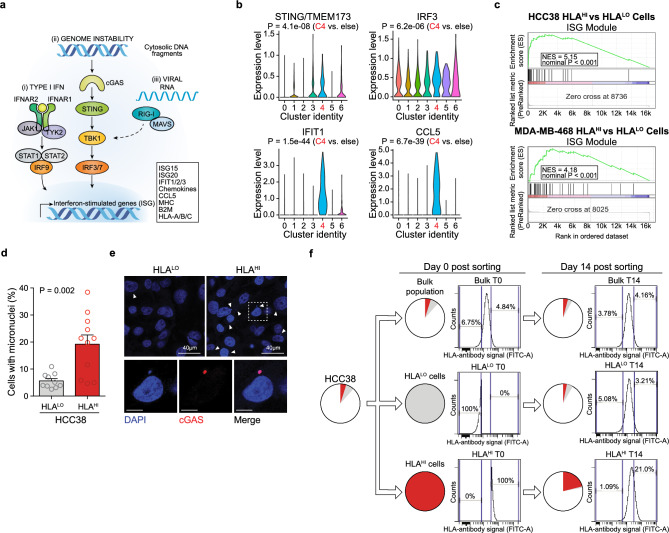
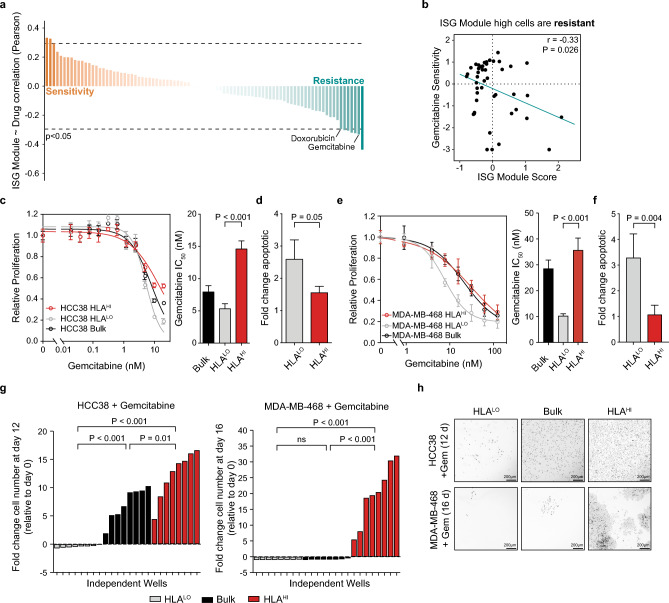
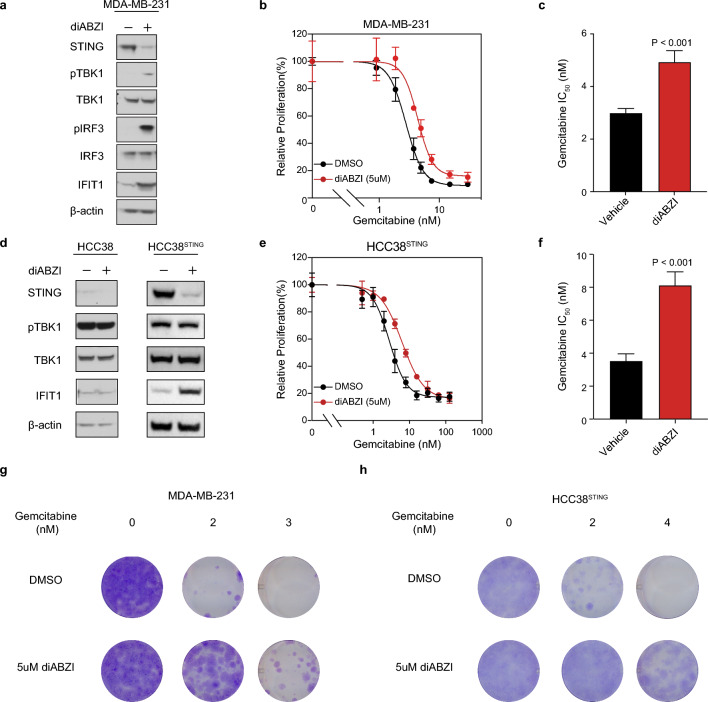
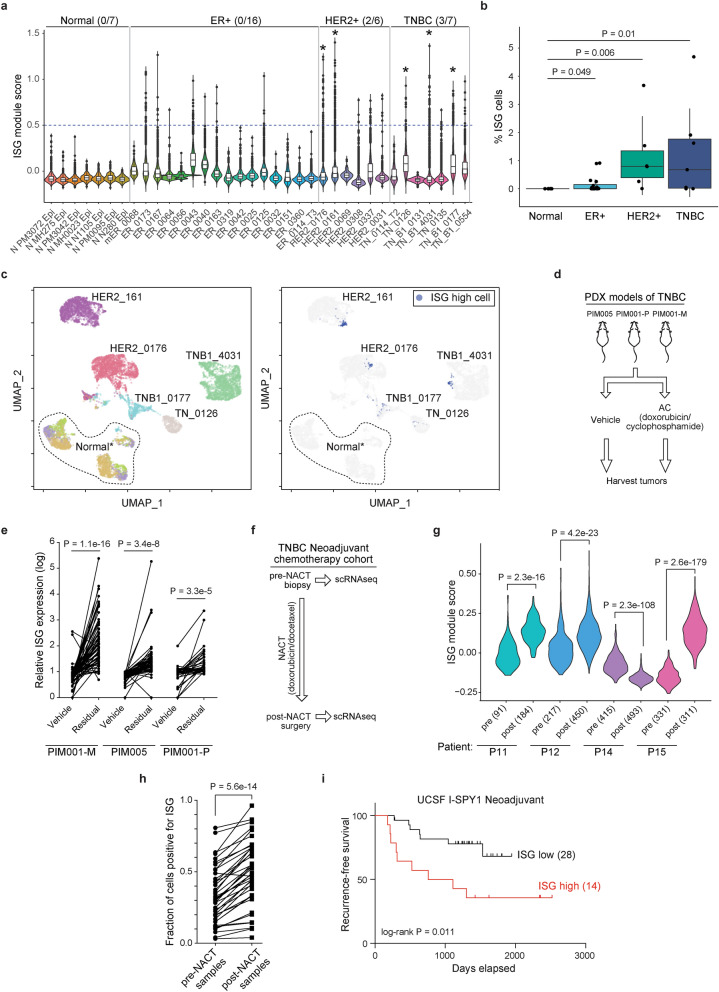
Individual cancers are composed of heterogeneous tumor cells with distinct phenotypes and genotypes, with triple negative breast cancers (TNBC) demonstrating the most heterogeneity among breast cancer types. Variability in transcriptional phenotypes could meaningfully limit the efficacy of monotherapies and fuel drug resistance, although to an unknown extent. To determine if transcriptional differences between tumor cells lead to differential drug responses we performed single cell RNA-seq on cell line and PDX models of breast cancer revealing cell subpopulations in states associated with resistance to standard-of-care therapies. We found that TNBC models contained a subpopulation in an inflamed cellular state, often also present in human breast cancer samples. Inflamed cells display evidence of heightened cGAS/STING signaling which we demonstrate is sufficient to cause tumor cell resistance to chemotherapy. Accordingly, inflamed cells were enriched in human tumors taken after neoadjuvant chemotherapy and associated with early recurrence, highlighting the potential for diverse tumor cell states to promote drug resistance.


Conflict of interest statement

S.B. consults with and/or receives research funding from Pfizer, Ideaya Biosciences and Revolution Medicines and is an employee and shareholder in Rezo Therapeutics. No other authors have any conflict of interest on this work.

Figures

Figure 1
Figure 1
Single-cell RNA-seq identified transcriptional variability in multiple models of breast cancer. (a) Schematic for molecular and functional characterization of single-cell RNA-seq data in various model systems. (b) UMAP projection of single cell RNAseq data from MDA-MB-231 and HCC38 TNBC breast cancer cell lines and the HCI-002 TNBC-PDX model. Clusters determined by optimized Louvain clustering. (c) UMAP projection of scRNA-seq data from the ER + MCF7 cell line and HER2 + SKBR3 cell line with optimized Louvain clustering shown. (d) Gene set enrichment analysis (GSEA) of a basal gene signature performed on transcript profiles from MCF7 Cluster 4 cells. NES, normalized enrichment score. (e) Relative scores for a basal module in MCF7 clusters. (f) Gene set enrichment analysis (GSEA) of a EMT gene signature performed on transcript profiles from SKBR3 Cluster 6 cells. NES, normalized enrichment score. (g) Relative scores for an EMT module in SKBR3 clusters. In all graphs P values are calculated using a two-sided Wilcoxon test as indicated. TNBC triple-negative breast cancer, PDX patient-derived xenograft.
Figure 2
Figure 2
A subpopulation of inflamed cells is recurrent in TNBCs. (a) UMAP plots for cells from two TNBC cell lines (HCC38, MDA-MB-231) and a patient-derived xenograft model of TNBC (HCI-002) with optimized Louvain clustering shown and highlighting clusters enriched for ISG genes. Heatmaps displaying scaled expression patterns of top marker genes within each cluster shown to the right with high expression in yellow and low expression in purple. Percentage of total cells contained in each cluster is listed, and inflamed clusters highlighted with accompanying top differentially expressed genes. (b) Top significantly enriched gene sets identified from a Gene Set Enrichment Analysis (GSEA) of the 50 most differentially expressed (DE) genes from HCC38 Cluster 4, MDA-MB-231 Cluster 4, and HCI-002 Cluster 0 cells. (c) Expression levels of known interferon-stimulated genes for individual HCC38 cells in each cluster. (d,e) Relative ISG module scores for individual (d) HCC38 and (e) MDA-MB-231 cells in each cluster. Insert shows ISG module expression for individual cells mapped onto a UMAP plot. (f) Relative mRNA expression levels for ISG module genes across the breast cancer TCGA cohort. Samples sorted based on ISG module score. (g) Relative expression levels for ISG module genes across individual HCC38 cells. Cells are arranged based on cluster identity and annotated for ISG module score (white indicates low, and purple indicates high). In all graphs P values are calculated using a two-sided Wilcoxon test unless indicated otherwise. ISG interferon stimulated genes.
Figure 3
Figure 3
Inflamed cells display heightened cGAS/STING-pathway activation and genomic instability. (a) Processes that lead to upregulation of ISG including interferon signaling (IFN), genomic instability channeled through cGAS/STING-pathway activity, and detection of viral RNAs. (b) Expression levels of STING and STING effector genes for individual HCC38 cells based on cluster identity. P values are calculated using a two-sided Wilcoxon test. (c) Gene set enrichment analysis (GSEA) of the ISG module gene signature performed on transcript profiles from HCC38 (top) and MDA-MB-231 (bottom) HLAHI sorted cells. NES, normalized enrichment score. Data representative of n = 2 independent experiments. (d) Percentage of cells positive for the presence of micronuclei in HCC38 HLAHI (top 5%) and HLALO (bottom 10%) cells. Data is an average of at least five high-powered (63 ×) fields analyzed per sample (≥ 150 cells/field). Error bars are mean + s.e.m., and P value calculated using a two-sided t-test. (e) Representative images of HCC38 HLALO (top left) and HLAHI (top right) cells with DAPI (blue) staining DNA. Arrows indicate micronuclei. Higher magnification of HCC38 HLAHI cells positive for micronuclei shown below with co-staining for cGAS (red). Scale bars 10 µm unless indicated otherwise. (f) HCC38 cells were sorted into HLAHI (top 5%) and HLALO (bottom 10%) populations and re-analyzed after 14 d of cell culture. Pie charts depict relative proportions of HLAHI (red) and HLALO (grey) subpopulations. Data representative of n = 2 independent experiments.
Figure 4
Figure 4
TNBC cells in the inflamed state are chemoresistant. (a) ISG module scores from a panel of 84 breast cancer cell lines were correlated with drug sensitivity values across 90 compounds. Sorted Pearson correlation values shown with a cutoff for significant (p = 0.05) correlations indicated by a dashed line. (b) Scatter plot of ISG module scores in breast cancer cell lines compared with their sensitivity (normalized –log of IC50) to gemcitabine. P value based on Pearson correlation. (c) Proliferation of HCC38 HLAHI (top 5%), HLALO (bottom 10%), and bulk population in response to 72 h gemcitabine treatment compared to DMSO control. IC50 quantification of dose–response curves shown to the right. (d) Fold change in apoptotic cells in HCC38 HLA subpopulations after 72 h treatment with the IC50 dose (5 nM) of gemcitabine normalized to DMSO control. (e) Proliferation of MDA-MB-468 HLAHI, HLALO and bulk populations in response to 72 h gemcitabine treatment compared to DMSO control. IC50 quantification of dose–response curves shown to the right. (f) Fold change in apoptotic cells in MDA-MB-468 HLA subpopulations after 72 h treatment with the IC50 dose (7.8 nM) of gemcitabine normalized to DMSO control. (g) Fold change in the number of cells remaining for HCC38(left) and MDA-MB-468 (right) samples treated for the indicated time period with 2.5 nM or 11 nM gemcitabine relative to day 0 calculated for n = 8 independent samples. For comparison, the mean day 0 cell count from n = 4 independent samples was used. (h) Representative images of colony formation assay for HCC38 (top) and MDA-MB-468 (top) HLALO (left), bulk (middle), and HLAHI (right) cells following chemotherapy treatment. Cells were stained with Hoechst 33,342 and fluorescent image inverted for clarity. Scale bar, 200 µm. For (cf), data represents n = 4 biologically independent samples. Error bars are mean ± s.d., and P values calculated using a two-sided t-test except for (g) in which a two-sided t-test with Welch’s correction was used.
Figure 5
Figure 5
STING activity is sufficient for chemoresistance and contributes to drug tolerance and acquired resistance in vitro. (a) Immunoblot of lysates taken after 24 h of 5uM diABZI or DMSO treatment in MDA-MB-231 cells with the indicated antibodies. β-actin is shown as a loading control. Representative image from n = 3 independent experiments. (b) Proliferation of MDA-MB-231 cells in response to 24 h diABZI or DMSO pre-treatment followed by 72 h gemcitabine co-treatment. (c) IC50 quantification of MDA-MB-231 dose–response curve (b). (d) Immunoblot of lysates taken after 24 h of 5uM diABZI or DMSO treatment in HCC38 (left) and HCC38STING overexpressing cells (right) with the indicated antibodies. β-actin is shown as a loading control. Representative image from n = 3 independent experiments. (e) Proliferation of HCC38STING overexpressing cells in response to 24 h diABZI or DMSO pre-treatment followed by 72 h gemcitabine co-treatment. (f) IC50 quantification of HCC38STING dose–response curve (e). (g,h) Crystal violet staining of MDA-MB-231 (g) and HCC38STING overexpressing cells (h) after 9 d treatment with increasing concentrations of gemcitabine. Images are representative of n = 3 independent experiments with similar results. For (b,c,e,f), data represents n = 4 biologically independent samples. Error bars are mean ± s.d., and P values calculated using a two-sided t-test.
Figure 6
Figure 6
Inflamed cells are enriched in chemotherapy-induced residual disease and associated with poor outcome in TNBC. (a) Relative ISG module scores in treatment naïve patient tumors and normal breast tissue samples. Cutoff for cells exhibiting heightened inflammatory signaling is indicated by a dashed line. Number of tumor samples with > 1% inflamed cells is shown per subtype. (b) Percentage of inflamed cells in each tumor sample grouped by subtype. Box plots show median, upper/lower quartiles and range from 25–75 percentiles. (c) UMAP plot of samples with abundant inflammatory cells colored according to patient identify (left) and ISG cell classification (right). Normal* indicates three normal samples (N MH0023, N N1105, N MH275). (d) TNBC PDX models from 3 primary breast tumors were treated with vehicle or a single dose of AC treatment (doxorubicin/cyclophosphamide) and harvested approximately 20 days later for RNA-seq. (e) Scatter plot showing relative expression levels for each of the 41 ISG genes in the indicated vehicle and residual tumors following AC treatment. (f) Single-cell transcriptome profiles were derived from matched pre- and post-NACT (neoadjuvant chemotherapy containing doxorubicin and docetaxel) samples from 4 TNBC patients. (g) Violin plot of relative ISG module scores for pre- and post-NACT cells from each patient shown with number of cells analyzed in each sample indicated. (h) Fraction of cells expressing each individual ISG module gene where each point represents a single ISG averaged over 4 matched pre- or post-NACT biopsies. (i)The top third of patients whose tumor ISG score was the most elevated in the surgical post-chemotherapy sample compared to pre-treatment were classified as ISG high and the remaining two-thirds as ISG low in the ISPY cohort. Probability of recurrence-free survival (%) is shown and the number of patients in each group indicated. P values calculated using a two-sided t-test except for (b) in which a two-sided Wilcoxon test was used.

References

    1. Alizadeh AA, et al. Toward understanding and exploiting tumor heterogeneity. Nat. Med. 2015;21:846–853. doi: 10.1038/nm.3915. - DOI - PMC - PubMed
    1. Martelotto LG, Ng CK, Piscuoglio S, Weigelt B, Reis-Filho JS. Breast cancer intra-tumor heterogeneity. Breast Cancer Res. 2014;16:210. doi: 10.1186/bcr3658. - DOI - PMC - PubMed
    1. Vitale I, Shema E, Loi S, Galluzzi L. Intratumoral heterogeneity in cancer progression and response to immunotherapy. Nat. Med. 2021;27:212–224. doi: 10.1038/s41591-021-01233-9. - DOI - PubMed
    1. Dagogo-Jack I, Shaw AT. Tumour heterogeneity and resistance to cancer therapies. Nat. Rev. Clin. Oncol. 2018;15:81–94. doi: 10.1038/nrclinonc.2017.166. - DOI - PubMed
    1. Morris LGT, et al. Pan-cancer analysis of intratumor heterogeneity as a prognostic determinant of survival. Oncotarget. 2016;7:10051–10063. doi: 10.18632/oncotarget.7067. - DOI - PMC - PubMed

MeSH terms