

Adjusting surface coverage of Pt nanocatalyst decoration for selectivity control in CMOS-integrated SnO2 thin film gas sensors
- PMID: 38356629
- PMCID: PMC10863709
- DOI: 10.1039/d3na00552f
Adjusting surface coverage of Pt nanocatalyst decoration for selectivity control in CMOS-integrated SnO2 thin film gas sensors
Abstract
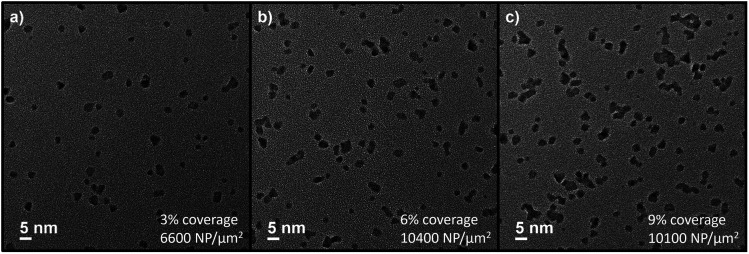
Smart gas-sensor devices are of crucial importance for emerging consumer electronics and Internet-of-Things (IoT) applications, in particular for indoor and outdoor air quality monitoring (e.g., CO2 levels) or for detecting pollutants harmful for human health. Chemoresistive nanosensors based on metal-oxide semiconductors are among the most promising technologies due to their high sensitivity and suitability for scalable low-cost fabrication of miniaturised devices. However, poor selectivity between different target analytes restrains this technology from broader applicability. This is commonly addressed by chemical functionalisation of the sensor surface via catalytic nanoparticles. Yet, while the latter led to significant advances in gas selectivity, nanocatalyst decoration with precise size and coverage control remains challenging. Here, we present CMOS-integrated gas sensors based on tin oxide (SnO2) films deposited by spray pyrolysis technology, which were functionalised with platinum (Pt) nanocatalysts. We deposited size-selected Pt nanoparticles (narrow size distribution around 3 nm) by magnetron-sputtering inert-gas condensation, a technique which enables straightforward surface coverage control. The resulting impact on SnO2 sensor properties for CO and volatile organic compound (VOC) detection via functionalisation was investigated. We identified an upper threshold for nanoparticle deposition time above which increased surface coverage did not result in further CO or VOC sensitivity enhancement. Most importantly, we demonstrate a method to adjust the selectivity between these target gases by simply adjusting the Pt nanoparticle deposition time. Using a simple computational model for nanocatalyst coverage resulting from random gas-phase deposition, we support our findings and discuss the effects of nanoparticle coalescence as well as inter-particle distances on sensor functionalisation.
This journal is © The Royal Society of Chemistry.
Conflict of interest statement
There are no conflicts to declare.
Figures


Similar articles
-
Novel Miniature and Selective Combustion-Type CMOS Gas Sensor for Gas-Mixture Analysis-Part 1: Emphasis on Chemical Aspects.Micromachines (Basel). 2020 Mar 26;11(4):345. doi: 10.3390/mi11040345. Micromachines (Basel). 2020. PMID: 32224994 Free PMC article.
-
Nanoparticle cluster gas sensor: Pt activated SnO2 nanoparticles for NH3 detection with ultrahigh sensitivity.Nanoscale. 2015 Sep 28;7(36):14872-80. doi: 10.1039/c5nr03585f. Epub 2015 Aug 20. Nanoscale. 2015. PMID: 26289622
-
Performance and stress analysis of metal oxide films for CMOS-integrated gas sensors.Sensors (Basel). 2015 Mar 25;15(4):7206-27. doi: 10.3390/s150407206. Sensors (Basel). 2015. PMID: 25815445 Free PMC article.
-
P-Type Metal Oxide Semiconductor Thin Films: Synthesis and Chemical Sensor Applications.Sensors (Basel). 2022 Feb 10;22(4):1359. doi: 10.3390/s22041359. Sensors (Basel). 2022. PMID: 35214257 Free PMC article. Review.
-
Semiconductor Metal Oxides as Chemoresistive Sensors for Detecting Volatile Organic Compounds.Sensors (Basel). 2019 Jan 9;19(2):233. doi: 10.3390/s19020233. Sensors (Basel). 2019. PMID: 30634523 Free PMC article. Review.
Cited by
-
Ferromagnetic-Antiferromagnetic Coupling in Gas-Phase Synthesized M(Fe, Co, and Ni)-Cr Nanoparticles for Next-Generation Magnetic Applications.Adv Sci (Weinh). 2024 Nov;11(43):e2403708. doi: 10.1002/advs.202403708. Epub 2024 Sep 24. Adv Sci (Weinh). 2024. PMID: 39316368 Free PMC article. Review.
-
A Review of Gas Sensors for CO2 Based on Copper Oxides and Their Derivatives.Sensors (Basel). 2024 Aug 23;24(17):5469. doi: 10.3390/s24175469. Sensors (Basel). 2024. PMID: 39275379 Free PMC article. Review.
-
Development of a Screening Platform for Optimizing Chemical Nanosensor Materials.Sensors (Basel). 2024 Aug 28;24(17):5565. doi: 10.3390/s24175565. Sensors (Basel). 2024. PMID: 39275475 Free PMC article.
-
Size-Dependent Thresholds in CuO Nanowires: Investigation of Growth from Microstructured Thin Films for Gas Sensing.Nanomaterials (Basel). 2024 Jul 16;14(14):1207. doi: 10.3390/nano14141207. Nanomaterials (Basel). 2024. PMID: 39057883 Free PMC article.
References
LinkOut - more resources
Full Text Sources