. 2024 Jan 20;15(5):1429-1441.
doi: 10.7150/jca.92521. eCollection 2024.

Disruption of Autophagic Flux and Treatment with the PDPK1 Inhibitor GSK2334470 Synergistically Inhibit Renal Cell Carcinoma Pathogenesis

Affiliations

Disruption of Autophagic Flux and Treatment with the PDPK1 Inhibitor GSK2334470 Synergistically Inhibit Renal Cell Carcinoma Pathogenesis

Wei Zhou et al. J Cancer. .

Abstract

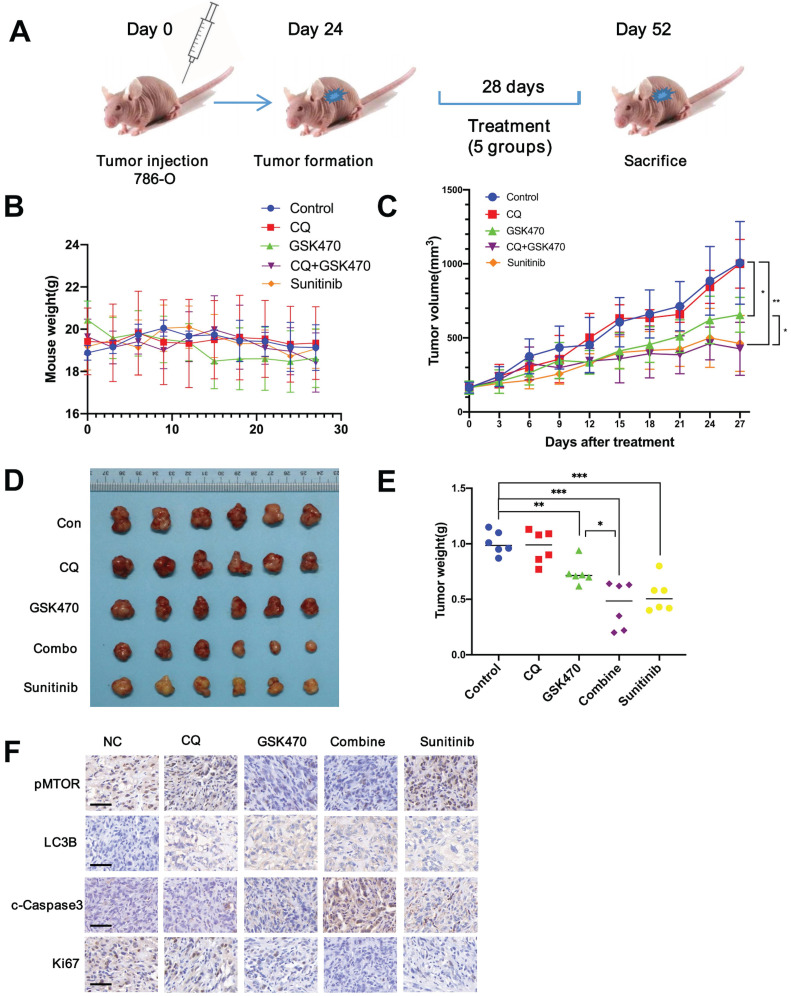
Background: Renal cell carcinoma (RCC) frequently exhibits activating PI3K-Akt-mTOR pathway mutations. 3-Phosphoinositide-dependent kinase 1 (PDPK1 or PDK1) has been established to play a pivotal role in modulating PI3K pathway signaling. mTOR is the main autophagy-initiating factor. However, limited advances have been made in understanding the relationship between PDPK1 and autophagy in RCC. Methods: GSK2334470 (GSK470), a novel and highly specific inhibitor of PDPK1, was selected to investigate the anticancer effects in two RCC cell lines. Cell growth was assessed by CCK-8 test and colony formation. Changes in the protein levels of key Akt/mTOR pathway components and apoptosis markers were assessed by Western blotting. Autophagy was assessed by using LC3B expression, transmission electron microscopy, and a tandem mRFP-EGFP-LC3 construct. The effect of PDPK1 and autophagy inhibitor chloroquine in RCC in vivo was examined in a mouse tumor-bearing model. Results: GSK470 significantly inhibited cell proliferation and induces apoptosis in A498 and 786-O RCC cells. GSK470 downregulates the phosphorylation of PDPK1, thereby inhibiting downstream phosphorylation of Akt1 at Thr308 and Ser473 and mTOR complex 1 (mTORC1) activity. Treatment with insulin-like growth factor-1 (IGF-1) partially restored GSK470-induced behaviors/activities. Interestingly, treatment of A498 and 786-O cells with GSK470 or siPDPK1 induced significant increases in the hallmarks of autophagy, including autophagosome accumulation, autophagic flux, and LC3B expression. Importantly, GSK470 and chloroquine synergistically inhibited the growth of RCC cells in vitro and in xenograft models, supporting the protective role of autophagy activation upon blockade of the PDPK1-Akt-mTOR signaling pathway. Conclusion: Our study provides new insight into PDPK1 inhibition combined with autophagy inhibition as a useful treatment strategy for RCC.

Keywords: 3-Phosphoinositide-dependent kinase 1; Autophagy; PI3K-Akt-mTOR pathway; Renal cell carcinoma; Targeted therapy.


Conflict of interest statement

Competing Interests: The authors have declared that no competing interest exists.

Figures

Figure 1
Figure 1
The PDPK1 inhibitor GSK470 inhibits RCC cell proliferation and induces apoptosis. A. Effects of GSK470 on the proliferation of A498 and 786-O cells. Cells were treated with 0.1% DMSO or GSK470 for 48 h, and cell viability was evaluated using a CCK-8 kit. B. Effect of GSK470 on RCC cell colony formation. RCC cells were treated with the indicated concentrations of GSK470 for 14 d and were then fixed, stained, and counted. Colony collection is shown on the left, and the colony number used for statistical analysis is shown on the right. C. Western blot analysis showing the effects of GSK470 on the levels of apoptosis-related proteins. A498 and 786-O cells were treated with GSK470 at the specified concentrations for 48 h. GAPDH was used as a loading control. D. Western blot analysis was performed to assess the expression of components of the PDPK1-Akt-mTOR pathway after treatment with GSK470 for 48 h. The thin and thick arrow indicates the hyperphosphorylated and hypophosphorylated form of 4E-BP1, respectively. The relative quantification of 4E-BP1 refers to the ratio of hyperphysiologylated form to hyperphysiologylated form. Mean ± SD, n = 3. * indicates a significant difference compared with the control group.
Figure 2
Figure 2
The PI3K/Akt agonist IGF-1 partially reversed the inhibition of the PDPK1/AKT/mTOR pathway, colony formation and apoptosis induced by GSK470. A. Western blot analysis showing the efficiency of IGF-1 in abrogating the effects of GSK470 on the PDPK1/AKT/mTOR pathway. RCC cells were incubated with or without 100 ng/ml IGF-1 for 2 h and were then cocultured with or without 4 μM GSK470 for 48 h. B. Effect of IGF-1 on changes in colony formation induced by GSK470. RCC cells were treated with DMSO, IGF-1 (100 ng/ml), GSK470 (4 μM), or a combination of IGF-1 and GSK470 for 14 d and were then fixed, stained, and counted. C. Effects of IGF-1 on changes in cell viability induced by GSK470 in RCC cells. Cells were treated with DMSO, IGF-1 (100 ng/ml), GSK470 (4 μM), or a combination of IGF-1 and GSK470, and cell viability was evaluated by a CCK-8 assay. D. Western blot showing the effect of IGF-1 on abrogating the change in apoptosis caused by GSK470. RCC cells were incubated with or without 100 ng/ml IGF-1 for 2 h and were then cocultured with or without 4 μM GSK470 for 48 h. Mean ± SD, n = 3. * indicates a significant difference between the indicated groups.
Figure 3
Figure 3
Inhibition of PDPK1 significantly increases autophagy. A. Western blotting was performed to assess the expression of the autophagy-related protein LC3 in RCC cells treated with increasing concentrations of GSK470. B. Western blot analysis of RCC cells upon siRNA-mediated interference with PDPK1 expression. PDPK1 and LC3 expression was measured. C. Autophagosomes were visualized by transmission electron microscopy (6000 ×/20000 × magnification) in RCC cells cultured with GSK470 (4 μM). Scale bar, 1 μm. D. RCC cells with stable expression of the mRFP-EGFP-LC3 fusion protein were cocultured with DMSO or GSK470 (4 μM). In the merged images, autophagosomes appear as yellow puncta (RFP+GFP+), while autolysosomes appear as red puncta (RFP+GFP-). Confocal micrographs are shown (2000 × magnification). Scale bar, 25 μm. Mean ± SD, n = 3. * Indicates a significant difference compared with the control group.
Figure 4
Figure 4
Autophagy inhibition synergizes with the anticancer effects of GSK470. A. The autophagy-related genes ATG5 and ATG7 were knocked down in 786-O and A498 RCC cells using siRNA. The knockdown efficiency was assessed by immunoblotting. B. CCK-8 assay of RCC cells transfected with a nontargeted siRNA as a control or with ATG5- or ATG7-targeted siRNAs and then treated with the indicated concentrations of GSK470 for 48 h. C. CCK-8 assay of RCC cells treated with DMSO, GSK470 (2 μM), CQ (10 μM), or a combination of GSK470 and CQ for 48 h. D. Western blot analysis showed that the levels of apoptosis-related proteins were significantly increased upon combined treatment with the autophagy inhibitor CQ and GSK470. RCC cell lines were treated with GSK470 (2 μM), CQ (10 µM), or a combination of GSK470 and CQ for 48 h. E. Flow cytometric analysis confirmed the proapoptotic effect of CQ (10 µM) and GSK470 (2 μM) in RCC cell lines after treatment for 48 h. Mean ± SD, n = 3. * indicates a significant difference compared with the control group (or between the indicated groups).
Figure 5
Figure 5
GSK470 inhibits tumor growth in RCC mouse models, and its growth inhibitory effect is enhanced by CQ. A. Mice were implanted with 786-O RCC cells, and treatment was initiated on day 24 post-implantation. The mice were treated with (1) vehicle (normal saline, ip, tiw), (2) CQ (65 mg/kg, ip, qd), (3) GSK470 (100 mg/kg, ip, tiw), (4) GSK470+ CQ, or (5) sunitinib (80 mg/kg, po, 5 d/w). Tumor volume and mouse weight were measured in the groups once every three days. B. The weight of mice in each group did not differ significantly after treatment. C. The tumor volumes in the five groups were recorded after treatment. D, E The mice in all five groups were sacrificed, and tumors were then harvested and weighed. F. Immunohistochemical staining of tumor specimens. Scale bars = 50 μm. * indicates a significant difference compared with the control group (or between the indicated groups).
Figure 6
Figure 6
Schematic representation of the effects of PDPK1 on the PI3K-Akt-mTOR pathway and autophagy resulting in regulation of proliferation and apoptosis in RCC.

Similar articles

References

    1. Siegel RL, Miller KD, Fuchs HE, Jemal A. Cancer statistics, 2022. CA Cancer J Clin. 2022;72:7–33. - PubMed
    1. Lipworth L, Morgans AK, Edwards TL, Barocas DA, Chang SS, Herrell SD. et al. Renal cell cancer histological subtype distribution differs by race and sex. BJU Int. 2016;117:260–5. - PubMed
    1. Hsieh JJ, Purdue MP, Signoretti S, Swanton C, Albiges L, Schmidinger M. et al. Renal cell carcinoma. Nat Rev Dis Primers. 2017;3:17009. - PMC - PubMed
    1. Jonasch E. Updates to the Management of Kidney Cancer. J Natl Compr Canc Netw. 2018;16:639–41. - PubMed
    1. Alzahrani AS. PI3K/Akt/mTOR inhibitors in cancer: At the bench and bedside. Semin Cancer Biol. 2019;59:125–32. - PubMed

LinkOut - more resources