From genomic spectrum of NTRK genes to adverse effects of its inhibitors, a comprehensive genome-based and real-world pharmacovigilance analysis
- PMID: 38357305
- PMCID: PMC10864613
- DOI: 10.3389/fphar.2024.1329409
From genomic spectrum of NTRK genes to adverse effects of its inhibitors, a comprehensive genome-based and real-world pharmacovigilance analysis
Abstract
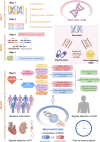
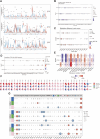
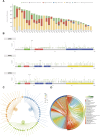
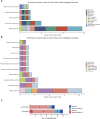
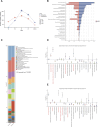
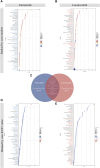
Introduction: The discovery of neurotrophic tyrosine receptor kinase (NTRK) gene fusions has facilitated the development of precision oncology. Two first-generation NTRK inhibitors (larotrectinib and entrectinib) are currently approved for the treatment of patients with solid tumors harboring NTRK gene fusions. Nevertheless, comprehensive NTRK profiling at the pan-cancer genomic level and real-world studies pertaining to the adverse events of NTRK inhibitors are lacking. Methods: We characterize the genome of NTRK at the pan-cancer level through multi-omics databases such as The Cancer Genome Atlas (TCGA). Through the FDA Adverse Event Reporting System (FAERS) database, we collect reports of entrectinib and larotrectinib-induced adverse events and perform a pharmacovigilance analysis using various disproportionality methods. Results: NTRK1/2/3 expression is lower in most tumor tissues, while they have higher methylation levels. NTRK gene expression has prognostic value in some cancer types, such as breast invasive carcinoma (BRCA). The cancer type with highest NTRK alteration frequency is skin cutaneous melanoma (SKCM) (31.98%). Thyroid carcinoma (THCA) has the largest number of NTRK fusion cases, and the most common fusion pair is ETV6-NTRK3. Adverse drug events (ADEs) obtained from the FAERS database for larotrectinib and entrectinib are 524 and 563, respectively. At the System Organ Class (SOC) level, both drugs have positive signal value for "nervous system disorder". Other positive signals for entrectinib include "cardiac disorders", "metabolism and nutrition disorders", while for larotrectinib, it is "hepatobiliary disorders". The unexpected signals are also listed in detail. ADEs of the two NTRK inhibitors mainly occur in the first month. The median onset time of ADEs for entrectinib and larotrectinib was 16 days (interquartile range [IQR] 6-86.5) and 44 days ([IQR] 7-136), respectively. Conclusion: Our analysis provides a broad molecular view of the NTRK family. The real-world adverse drug event analysis of entrectinib and larotrectinib contributes to more refined medication management.
Keywords: FAERS; NTRK; adverse drug event; entrectinib; gene fusion; larotrectinib; pharmacovigilance.
Copyright © 2024 Cui, Zhai, Xie, Wang, Cheng, Lou, Zou, Pan, Chang, Yao, She, Zhang and Yang.
Conflict of interest statement
The authors declare that the research was conducted in the absence of any commercial or financial relationships that could be construed as a potential conflict of interest.
Figures

Similar articles
-
The Safety Profiles of Two First-Generation NTRK Inhibitors: Analysis of Individual Case Safety Reports from the FDA Adverse Event Reporting System (FAERS) Database.Biomedicines. 2023 Sep 15;11(9):2538. doi: 10.3390/biomedicines11092538. Biomedicines. 2023. PMID: 37760979 Free PMC article.
-
Clinical characteristics and treatment patterns of patients with NTRK fusion-positive solid tumors: A multisite cohort study at US academic cancer centers.J Manag Care Spec Pharm. 2024 Jul;30(7):672-683. doi: 10.18553/jmcp.2024.30.7.672. J Manag Care Spec Pharm. 2024. PMID: 38950155 Free PMC article.
-
NTRK fusion events and targeted treatment of advanced radioiodine refractory thyroid cancer.J Cancer Res Clin Oncol. 2023 Nov;149(15):14035-14043. doi: 10.1007/s00432-023-05134-x. Epub 2023 Aug 7. J Cancer Res Clin Oncol. 2023. PMID: 37548775 Free PMC article.
-
Locally Recurrent Secretory Carcinoma of the Breast with NTRK3 Gene Fusion.Oncologist. 2021 Oct;26(10):818-824. doi: 10.1002/onco.13880. Epub 2021 Jul 13. Oncologist. 2021. PMID: 34176200 Free PMC article. Review.
-
Tissue-Agnostic Targeting of Neurotrophic Tyrosine Receptor Kinase Fusions: Current Approvals and Future Directions.Cancers (Basel). 2024 Oct 4;16(19):3395. doi: 10.3390/cancers16193395. Cancers (Basel). 2024. PMID: 39410015 Free PMC article. Review.
Cited by
-
Real-world safety profile of elexacaftor/tezacaftor/ivacaftor: a disproportionality analysis using the U.S. FDA adverse event reporting system.Front Pharmacol. 2025 Mar 12;16:1531514. doi: 10.3389/fphar.2025.1531514. eCollection 2025. Front Pharmacol. 2025. PMID: 40144660 Free PMC article.
-
Clinical signature and associated immune metabolism of NLRP1 in pan-cancer.J Cell Mol Med. 2024 Sep;28(18):e70100. doi: 10.1111/jcmm.70100. J Cell Mol Med. 2024. PMID: 39318060 Free PMC article.
-
Recent Advancements in Research on DNA Methylation and Testicular Germ Cell Tumors: Unveiling the Intricate Relationship.Biomedicines. 2024 May 8;12(5):1041. doi: 10.3390/biomedicines12051041. Biomedicines. 2024. PMID: 38791003 Free PMC article. Review.
-
Entrectinib-Induced Pericarditis with Cardiac Tamponade in a Patient with Neurotrophic Tropomyosin Receptor Kinase 1 Fusion-Positive Breast Cancer.Case Rep Oncol. 2025 May 17;18(1):824-829. doi: 10.1159/000546503. eCollection 2025 Jan-Dec. Case Rep Oncol. 2025. PMID: 40546717 Free PMC article.
-
NTRK Gene Expression Analysis in Oral Squamous Cell Carcinoma Mexican Population.Dent J (Basel). 2024 Oct 14;12(10):327. doi: 10.3390/dj12100327. Dent J (Basel). 2024. PMID: 39452455 Free PMC article.
References
-
- Ardini E., Bosotti R., Borgia A. L., De Ponti C., Somaschini A., Cammarota R., et al. (2014). The TPM3-NTRK1 rearrangement is a recurring event in colorectal carcinoma and is associated with tumor sensitivity to TRKA kinase inhibition. Mol. Oncol. 8 (8), 1495–1507. 10.1016/j.molonc.2014.06.001 - DOI - PMC - PubMed
LinkOut - more resources
Full Text Sources

