

Iron uptake pathway of Escherichia coli as an entry route for peptide nucleic acids conjugated with a siderophore mimic
- PMID: 38357356
- PMCID: PMC10864483
- DOI: 10.3389/fmicb.2024.1331021
Iron uptake pathway of Escherichia coli as an entry route for peptide nucleic acids conjugated with a siderophore mimic
Abstract
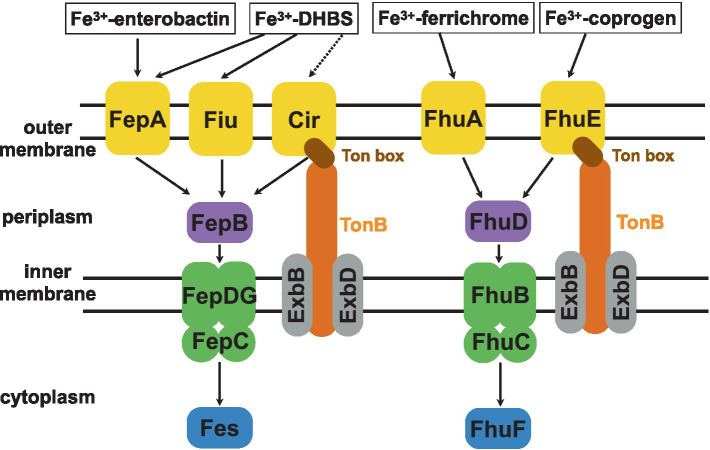
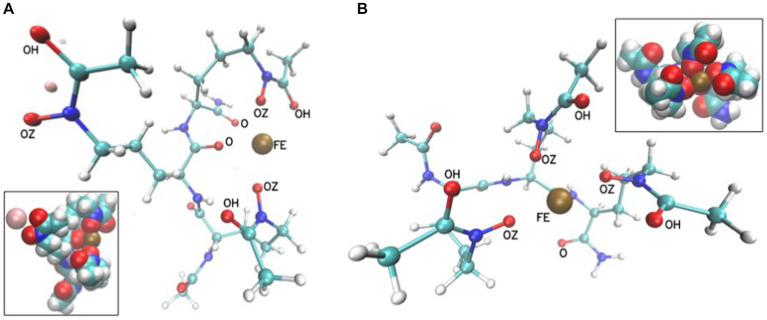
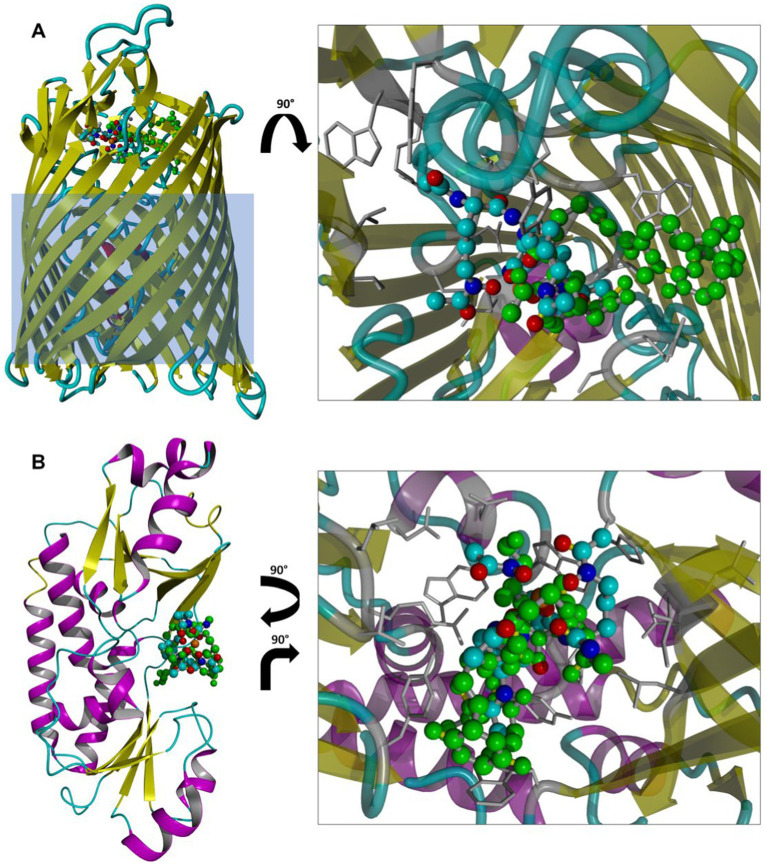
Bacteria secrete various iron-chelators (siderophores), which scavenge Fe3+ from the environment, bind it with high affinity, and retrieve it inside the cell. After the Fe3+ uptake, bacteria extract the soluble iron(II) from the siderophore. Ferric siderophores are transported inside the cell via the TonB-dependent receptor system. Importantly, siderophore uptake paths have been also used by sideromycins, natural antibiotics. Our goal is to hijack the transport system for hydroxamate-type siderophores to deliver peptide nucleic acid oligomers into Escherichia coli cells. As siderophore mimics we designed and synthesized linear and cyclic Nδ-acetyl-Nδ-hydroxy-l-ornithine based peptides. Using circular dichroism spectroscopy, we found that iron(III) is coordinated by the linear trimer with hydroxamate groups but not by the cyclic peptide. The internal flexibility of the linear siderophore oxygen atoms and their interactions with Fe3+ were confirmed by all-atom molecular dynamics simulations. Using flow cytometry we found that the designed hydroxamate trimer transports PNA oligomers inside the E. coli cells. Growth recovery assays on various E. coli mutants suggest the pathway of this transport through the FhuE outer-membrane receptor, which is responsible for the uptake of the natural iron chelator, ferric-coprogen. This pathway also involves the FhuD periplasmic binding protein. Docking of the siderophores to the FhuE and FhuD receptor structures showed that binding of the hydroxamate trimer is energetically favorable corroborating the experimentally suggested uptake path. Therefore, this siderophore mimic, as well as its conjugate with PNA, is most probably internalized through the hydroxamate pathway.
Keywords: E. coli outer-membrane receptors; TonB-dependent transport system; iron coordination; peptide nucleic acid (PNA); siderophores.
Copyright © 2024 Tsylents, Burmistrz, Wojciechowska, Stępień, Maj and Trylska.
Conflict of interest statement
The authors declare that the research was conducted in the absence of any commercial or financial relationships that could be construed as a potential conflict of interest.
Figures


Similar articles
-
X-ray crystallographic structures of the Escherichia coli periplasmic protein FhuD bound to hydroxamate-type siderophores and the antibiotic albomycin.J Biol Chem. 2002 Apr 19;277(16):13966-72. doi: 10.1074/jbc.M109385200. Epub 2002 Jan 22. J Biol Chem. 2002. PMID: 11805094
-
Species selectivity of new siderophore-drug conjugates that use specific iron uptake for entry into bacteria.Antimicrob Agents Chemother. 1996 Nov;40(11):2610-7. doi: 10.1128/AAC.40.11.2610. Antimicrob Agents Chemother. 1996. PMID: 8913474 Free PMC article.
-
Iron transport systems of Serratia marcescens.J Bacteriol. 1992 Feb;174(4):1378-87. doi: 10.1128/jb.174.4.1378-1387.1992. J Bacteriol. 1992. PMID: 1531225 Free PMC article.
-
Iron uptake by fungi: contrasted mechanisms with internal or external reduction.Adv Microb Physiol. 2000;43:39-74. doi: 10.1016/s0065-2911(00)43002-x. Adv Microb Physiol. 2000. PMID: 10907554 Review.
-
Iron(III) hydroxamate transport across the cytoplasmic membrane of Escherichia coli.Biol Met. 1991;4(1):23-32. doi: 10.1007/BF01135553. Biol Met. 1991. PMID: 1830209 Review.
Cited by
-
Escherichia coli causing bloodstream infections in Mexican paediatric patients: molecular typing, antimicrobial resistance, virulence factors, and clinical features.BMC Infect Dis. 2025 May 27;25(1):764. doi: 10.1186/s12879-025-11163-3. BMC Infect Dis. 2025. PMID: 40426089 Free PMC article.
-
Chemical strategies for antisense antibiotics.Chem Soc Rev. 2024 Nov 25;53(23):11303-11320. doi: 10.1039/d4cs00238e. Chem Soc Rev. 2024. PMID: 39436264 Free PMC article. Review.
-
An antisense oligomer conjugate with unpredicted bactericidal activity against Fusobacterium nucleatum.mBio. 2025 Jun 11;16(6):e0052425. doi: 10.1128/mbio.00524-25. Epub 2025 Apr 29. mBio. 2025. PMID: 40298409 Free PMC article.
-
ASOBIOTICS 2024: an interdisciplinary symposium on antisense-based programmable RNA antibiotics.RNA. 2025 Mar 18;31(4):465-474. doi: 10.1261/rna.080347.124. RNA. 2025. PMID: 39814459 Free PMC article.
-
RNA toehold switch-based reporter assay to assess bacterial uptake of antisense oligomers.mBio. 2025 Apr 9;16(4):e0398324. doi: 10.1128/mbio.03983-24. Epub 2025 Mar 4. mBio. 2025. PMID: 40035593 Free PMC article.
References
LinkOut - more resources
Full Text Sources
Research Materials